
We can’t control the weather…
But we can control what we do on the landscape!
Recent findings released by the Iowa Soybean Association (ISA) has provided evidence to the fact that how we manage the land (our farms) plays a role in how much nutrients leave that land and enter surface waters. At the ISA Research Conference last month in Ames, Adam Kiel, state water resources manager at ISA, revealed the results of tile drain monitoring from 153 sites across the state during 2014 (793 tile samples in total during the year).

Tile drains were monitored from Water Quality Initiative-identified priority watersheds across the state in 2014 (image courtesy of Adam Kiel).

Monthly precipitation for 2014 and the historical averages for north-central Iowa (data after Chris Jones, 2014).
Recall that in 2014, April, June and August-September were exceptionally wet in Iowa due to above-normal precipitation in those months (figure to the right). Perhaps not surprising in a wet year such as 2014, between April 1 and December 1, 78% of tile drains sampled across the state showed nitrate (NO3-N) concentrations above 10 mg/L, which is the standard set by the EPA for safe drinking water (figure below).
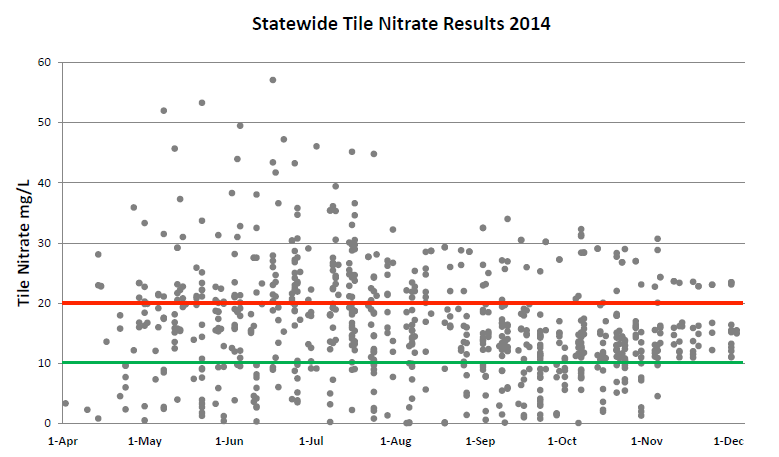
Tile nitrate concentrations from sites sampled across the state in 2014. The EPA safe drinking water standard is marked in green (image and data courtesy of Adam Kiel).
These samples were pulled from tiles that drained corn and soybean fields. Let’s take a look at what ISA observed when they looked at corn and soybean fields separately (table below). It seems that the nitrate concentrations in tile outflows from corn and soybean fields were pretty much equivalent save for a divergence beginning in August and ending in October when nitrate concentrations were greater in tile water coming from soybean fields. Note that the average nitrate concentration for the year for both corn and soybean fields was above the EPA drinking water standard of 10 mg/L.
|
|
|
|---|---|---|
Monthly average tile nitrate (mg/L) |
||
| May | 14.91 | 13.69 |
| June | 15.74 | 15.32 |
| July | 17.03 | 15.78 |
| August | 6.01 | 16.33 |
| September | 7.71 | 13.94 |
| October | 13.23 | 13.35 |
| November | 23.48 | 17.64 |
Average |
|
|
| Data courtesy of Adam Kiel. | ||
ISA also broke it down between situations involving tillage and no-till (table below). Note that the average tile water nitrate concentrations in no-till situations were actually slightly greater than those that involved tillage. While these are not controlled, paired, side-by-side comparisons, we might be able to assume that these greater nitrate concentrations in the no-till situations owe to the fact that no-till can increase the water infiltration capacity of a soil, thereby resulting in more tile water (and nitrate) draining from those systems.
|
|
|
|---|---|---|
| Tillage | 12.37 | 85 |
| No-till | 14.62 | 110 |
| Data courtesy of Adam Kiel. | ||
What about cover crops?? Well, ISA also made note of which fields had a history of cover crop use. The figure below shows their observations from the Boone River Watershed in north-central Iowa. Note that the fields with a history of cover crops (red dots) show tile water nitrate levels consistently below (or around) the EPA safe drinking water standard of 10 mg/L.
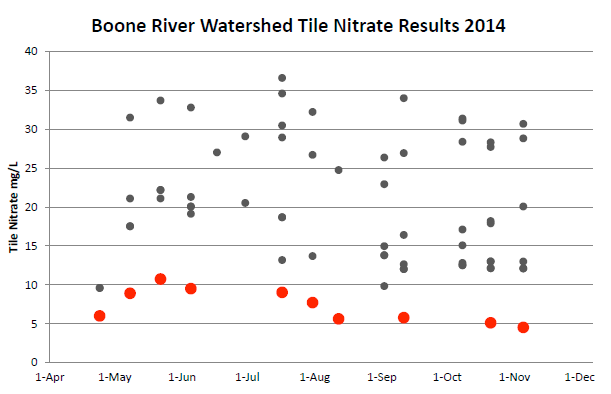
Tile nitrate concentrations from samples collected in the Boone River Watershed. Red dots denote observations from fields with a history of cover crop use (image and data courtesy of Adam Kiel).
Yes, it is true that we cannot control when it rains and how much it rains. And experience has shown us that frequency and intensity of rainfall can vary within a year and across years. And yes, weather patterns can drive the loss of nutrients from our fields to our surface waters. No doubt about it. But we shouldn’t throw our hands up and feel powerless! The data presented above should be extremely encouraging! For though we may be at the mercy of Mother Nature when it comes to rainfall, the decisions we make in managing our corn-soybean productions systems on the land can dictate the loss (or prevention of loss!) of nutrients from our fields. Corn-soybean production systems are inherently “leaky” in terms of nitrogen as we have living roots in the ground for only 4-5 months during the year in these systems. Using cover crops adds to the amount of time we have living roots in the ground and appears to be an exceptional tool for farmers to address the issue of nutrient pollution of the state’s surface waters.
Acknowledgements: I would like to thank Adam Kiel and Chris Jones from the Iowa Soybean Association for sharing with me their data and observations. You can find Adam’s presentation at the ISA Research Conference here: “Water Quality Initiative: Tile Monitoring 2014.” You can read about Chris Jones’s thoughts in this ISA Advance article: “HVN is Slipperier than a Wet Fish.”