

In a Nutshell
- Cover crops are recognized for their ability to scavenge nitrogen and possibly improve soil characteristics in corn-soybean production systems.
- Farmer-cooperator Jack Boyer investigated three different cereal rye cover crop seeding dates in his seed corn field. Cover crop performance was evaluated by assessing above ground biomass as well as soil chemical and health characteristics using the Haney Test, a novel approach to soil testing.
Key findings
- The two aerial seeding dates in August 2014 resulted in more cover crop growth in both Fall 2014 and Spring 2015 compared to the drill seeding date in September 2014.
- The two aerial seeding treatments reduced soil nitrate concentration in the top six inches of the soil profile compared to the drill seeding and nocover treatment in Fall 2014; all cover crop treatments reduced soil nitrate concentration compared to the nocover treatment in Spring 2015.
- Compared to the no-cover treatment, all cover crop treatments resulted in increased soil microbial activity in the spring as determined by the Solvita method in the Haney Test.
Background
The Iowa Nutrient Reduction Strategy, released in 2012, outlined several practices farmers can implement to reduce nonpoint source pollution (Iowa Department of Agriculture and Land Stewardship et al., 2012). One such practice is use of cover crops that are grown during the “off season” between the growing seasons of corn and soybean. Typically, cover crops are either aerially seeded into standing corn or soybeans at the time of physiological maturity or drilled into the soil directly following harvest of the corn or soybeans. Aerially seeding cover crops into standing corn or soybeans results in a longer period of time for the cover crop to grow and establish prior to the onset of winter compared to drill-seeding following harvest. The aerial seeding of cover crops is performed at the time of physiological maturity as this marks the time when sunlight penetration through the crop canopy to the soil surface begins to increase as the corn or soybean senesces. Seeding a cover crop too early into a standing crop may result in insufficient sunlight reaching the soil surface for the cover crop to successfully establish. In seed corn production, sunlight penetration through the canopy begins to increase after detasseling in July and more so after destruction and removal of the male rows in August. (Every fourth row of corn in a seed corn production field is a male row that will be destroyed and removed in August.) Thus, farmers raising seed corn may be able to successfully aerially seed and establish a cover crop earlier in the year than those who raise corn or soybeans for grain. This may present these farmers with the opportunity to reap more environmental benefits from the cover crop with potential increased fall growth and winter survival.
The objective of this research project was to determine the performance of a cereal rye cover crop aerially seeded into seed corn at two dates prior to harvest and drilled on one date directly following harvest.
Jack seeding cereal rye into seed corn in August 2014.
Methods
This research project was conducted by Jack Boyer of J Boyer Farms, Inc. in Tama County near Reinbeck in north-central Iowa. Jack raises seed corn for Dupont Pioneer.
Treatments included a cereal rye cover crop seeded into a seed corn field at three different times: aerially in mid-August (early aerial), aerially in late August (late aerial) and drilled after harvest in late September (drill) as well as a control treatment that received no cover crop (no-cover). The design of the project was a completely randomized design with each of the treatments replicated four times in strips running the length of the field. Strips measured between 50-60 ft wide and 2,550 ft long.
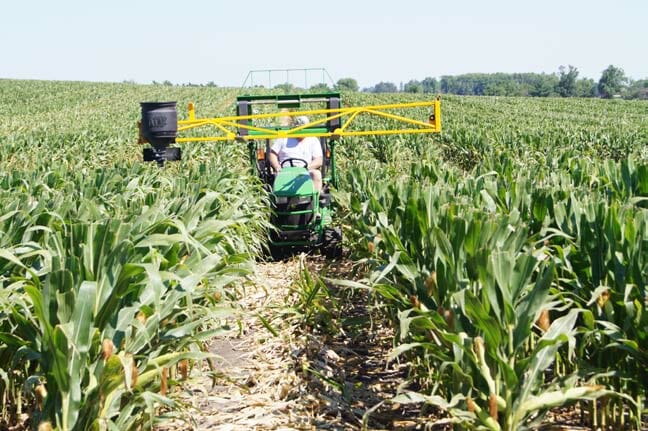
In 2014, the field was planted to seed corn in a 4:1 (female:male) row pattern. The female rows were planted on May 19, 2014; the male rows on May 22, 2014. The female rows were detasseled on July 15 and the male rows were destroyed on August 19. Cereal rye was aerially seeded into appropriate strips of standing seed corn at a rate of 56 lb/ac on August 19 (early aerial) and August 29 (late aerial) with the use of a small tractor and cyclone seeder, provided by Cedar Valley Innovation. The seed corn was harvested on September 25 and cereal rye was no-till drilled in 10-inch rows into appropriate strips the same day at a rate of 56 lb/ac.
Soil samples were collected to a depth of six inches from each strip on Nov. 6, 2014 and May 3, 2015. Samples were sent to Ward Laboratories in Kearney, Neb. to perform Haney Test evaluations. The Haney Test is a novel soil test that assesses soil microbial activity (soil health) as well as soil carbon and nitrogen pools (Ward Laboratories, 2015).
Cereal rye aboveground biomass was collected on Nov. 13, 2014 by clipping shoot material from randomly placed quadrats (one ft x one ft) in each strip. Spring regrowth of aboveground biomass was collected in the same manner on May 3, 2015. Samples were dried, weighed and analyzed for C and N concentration at the Soil and Plant Analysis Laboratory at Iowa State University in Ames.
Data were analyzed using JMP Pro 10 (SAS Institute Inc., Cary, NC) and yield comparisons employ least squares means for accuracy. Statistical significance is determined at P ≤ 0.05 level and means separations are reported using pre-determined orthogonal contrast statements: no-cover vs. (early aerial + late aerial + drill)/3; (early aerial + late aerial)/2 vs. drill; early aerial vs. late aerial.
Results and Discussion
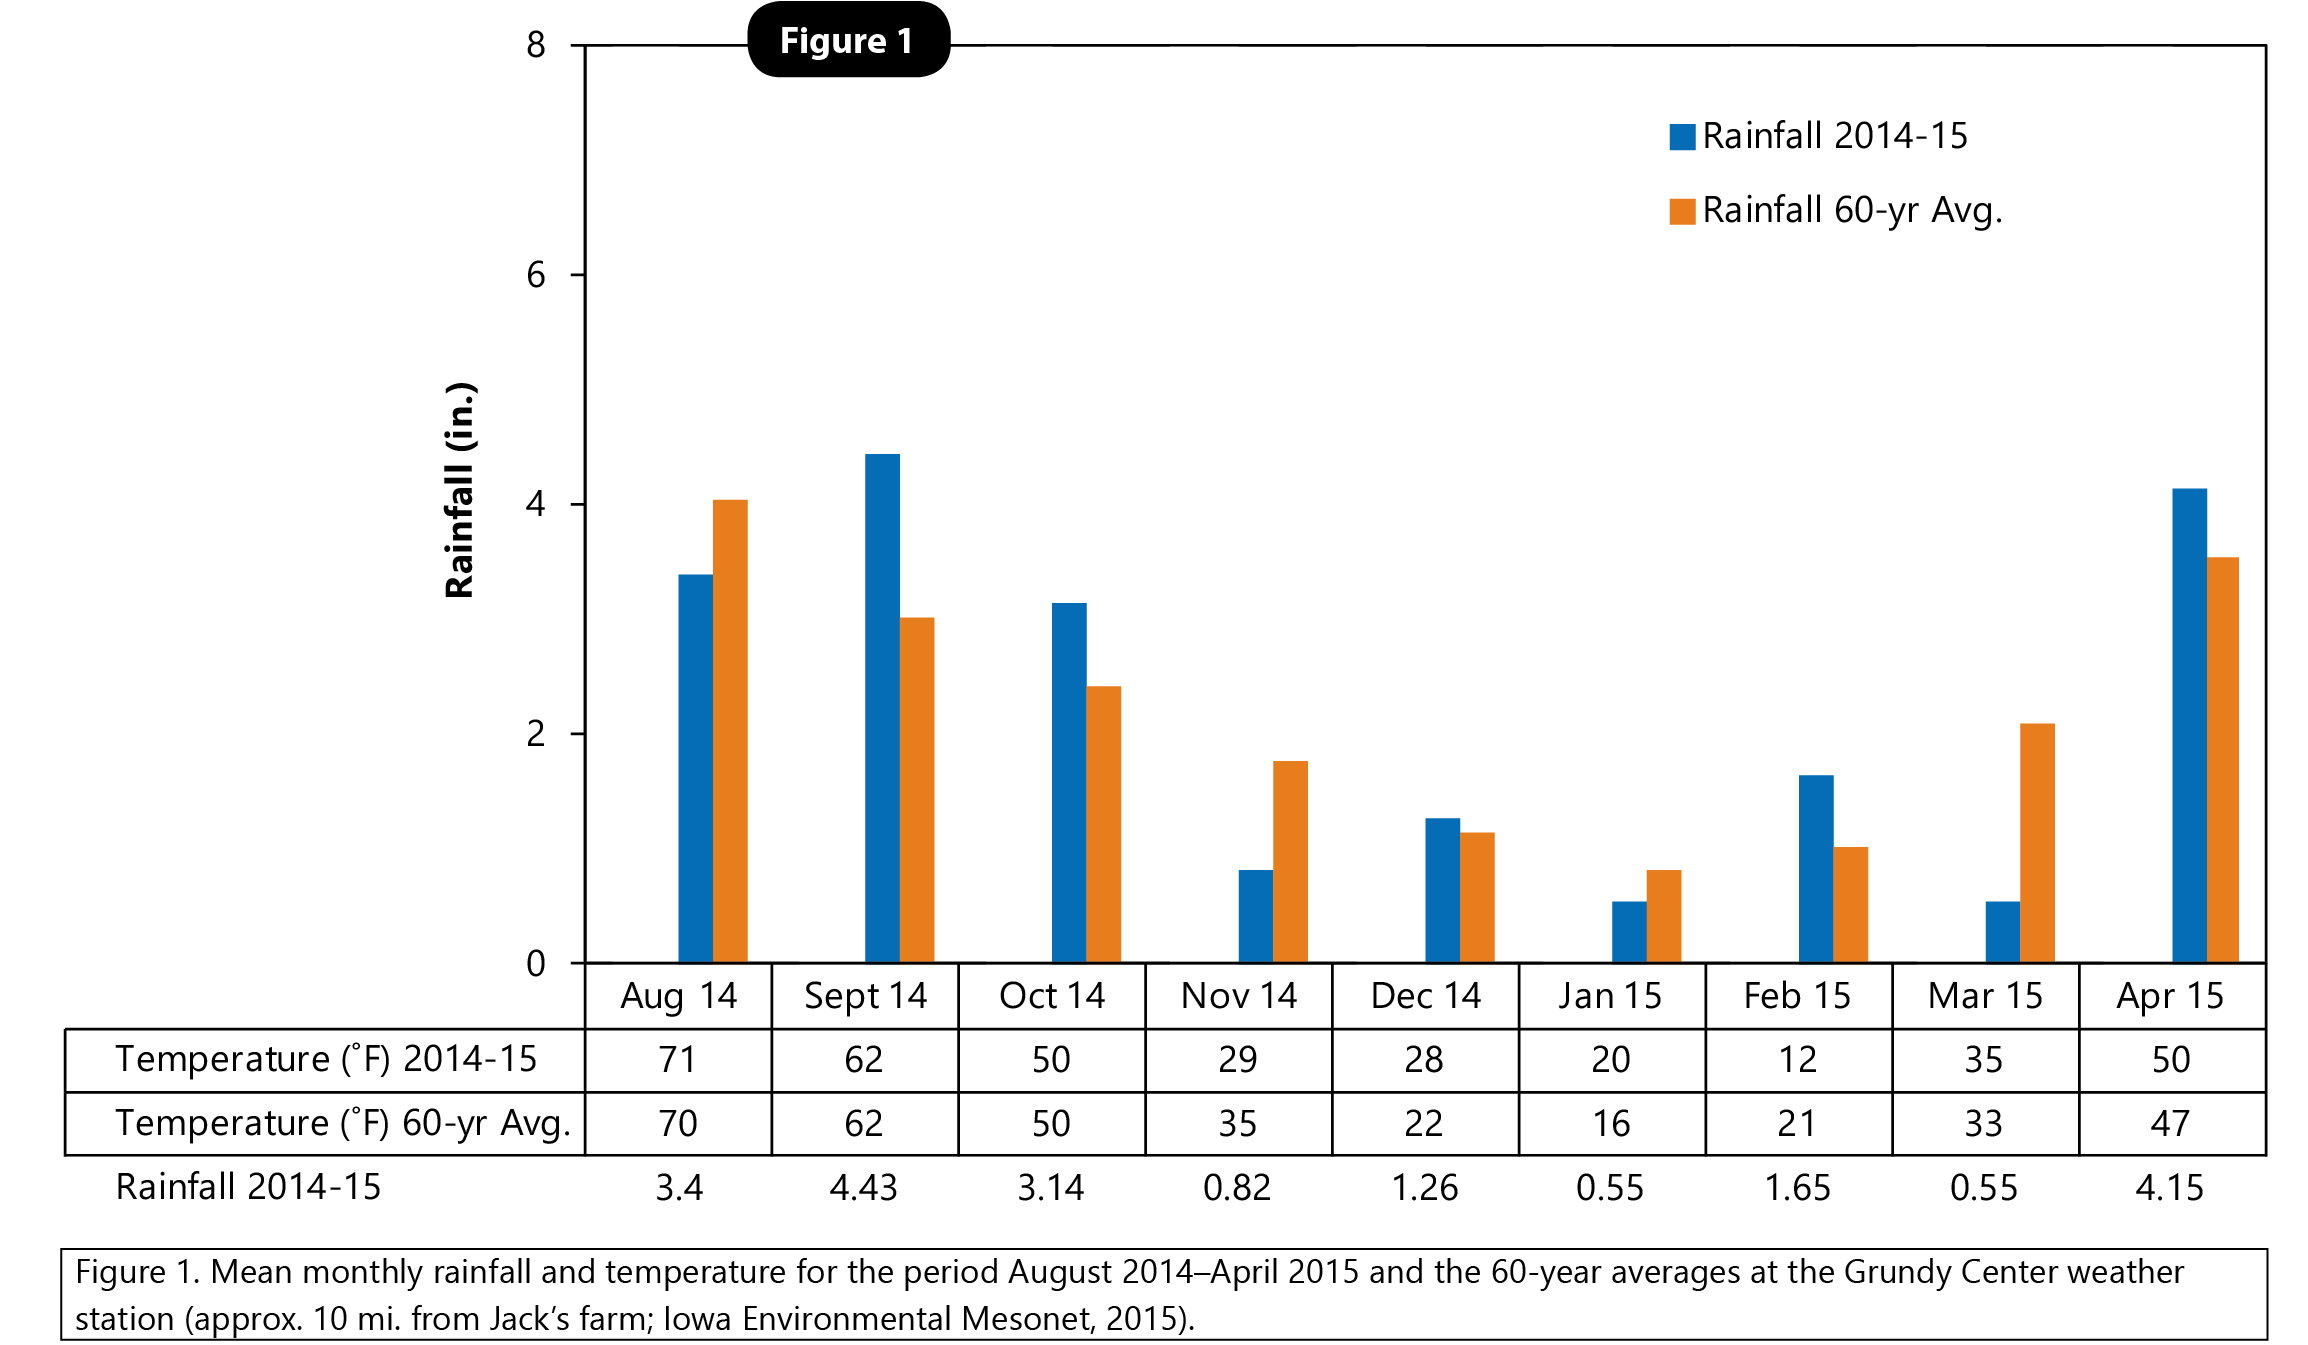
Mean monthly temperature and total monthly rainfall during August 1, 2014–May 1, 2015 near J Boyer Farms, Inc. compared to the long-term average is presented in Figure 1. September, October and April tended to be wetter than normal and provided good conditions for cover crop establishment, growth and persistence. A much colder than normal February 2015 did not appear to hinder cover crop regrowth in the spring.
Cover crop growth and performance
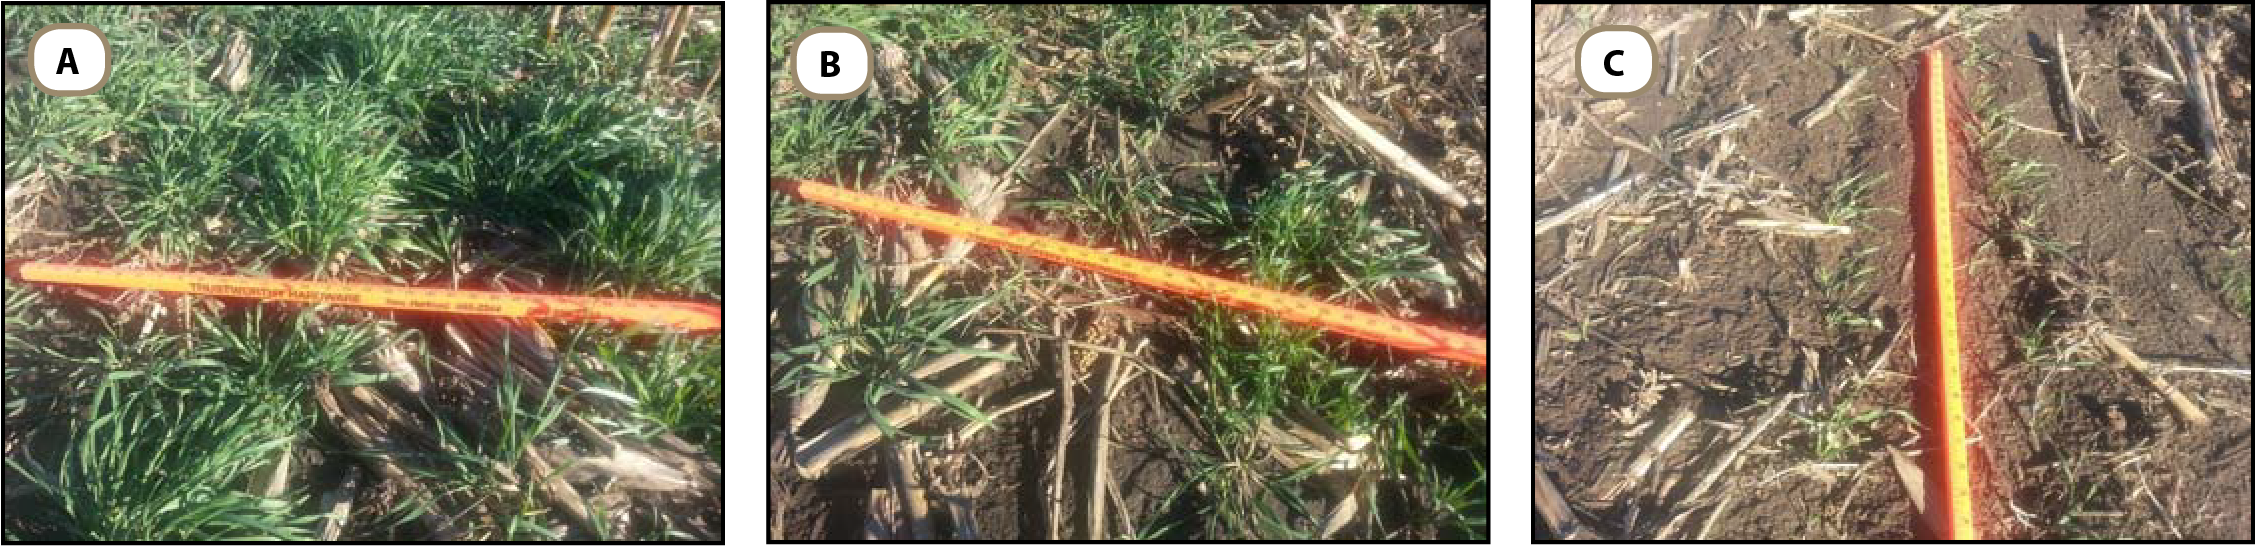
Fall and spring aboveground biomass production by the cereal rye cover crop in each treatment is presented in Figure 2. There was no difference in aboveground biomass between the two aerial seeding treatments in either the fall or the spring. Both aerial seeding treatments resulted in approximately 1,000 lb/ac more cereal rye aboveground biomass in the fall compared to the drill treatment. In the spring, the aerial seeding treatments resulted in close to 2,000 lb/ac more aboveground biomass than the drill treatment.
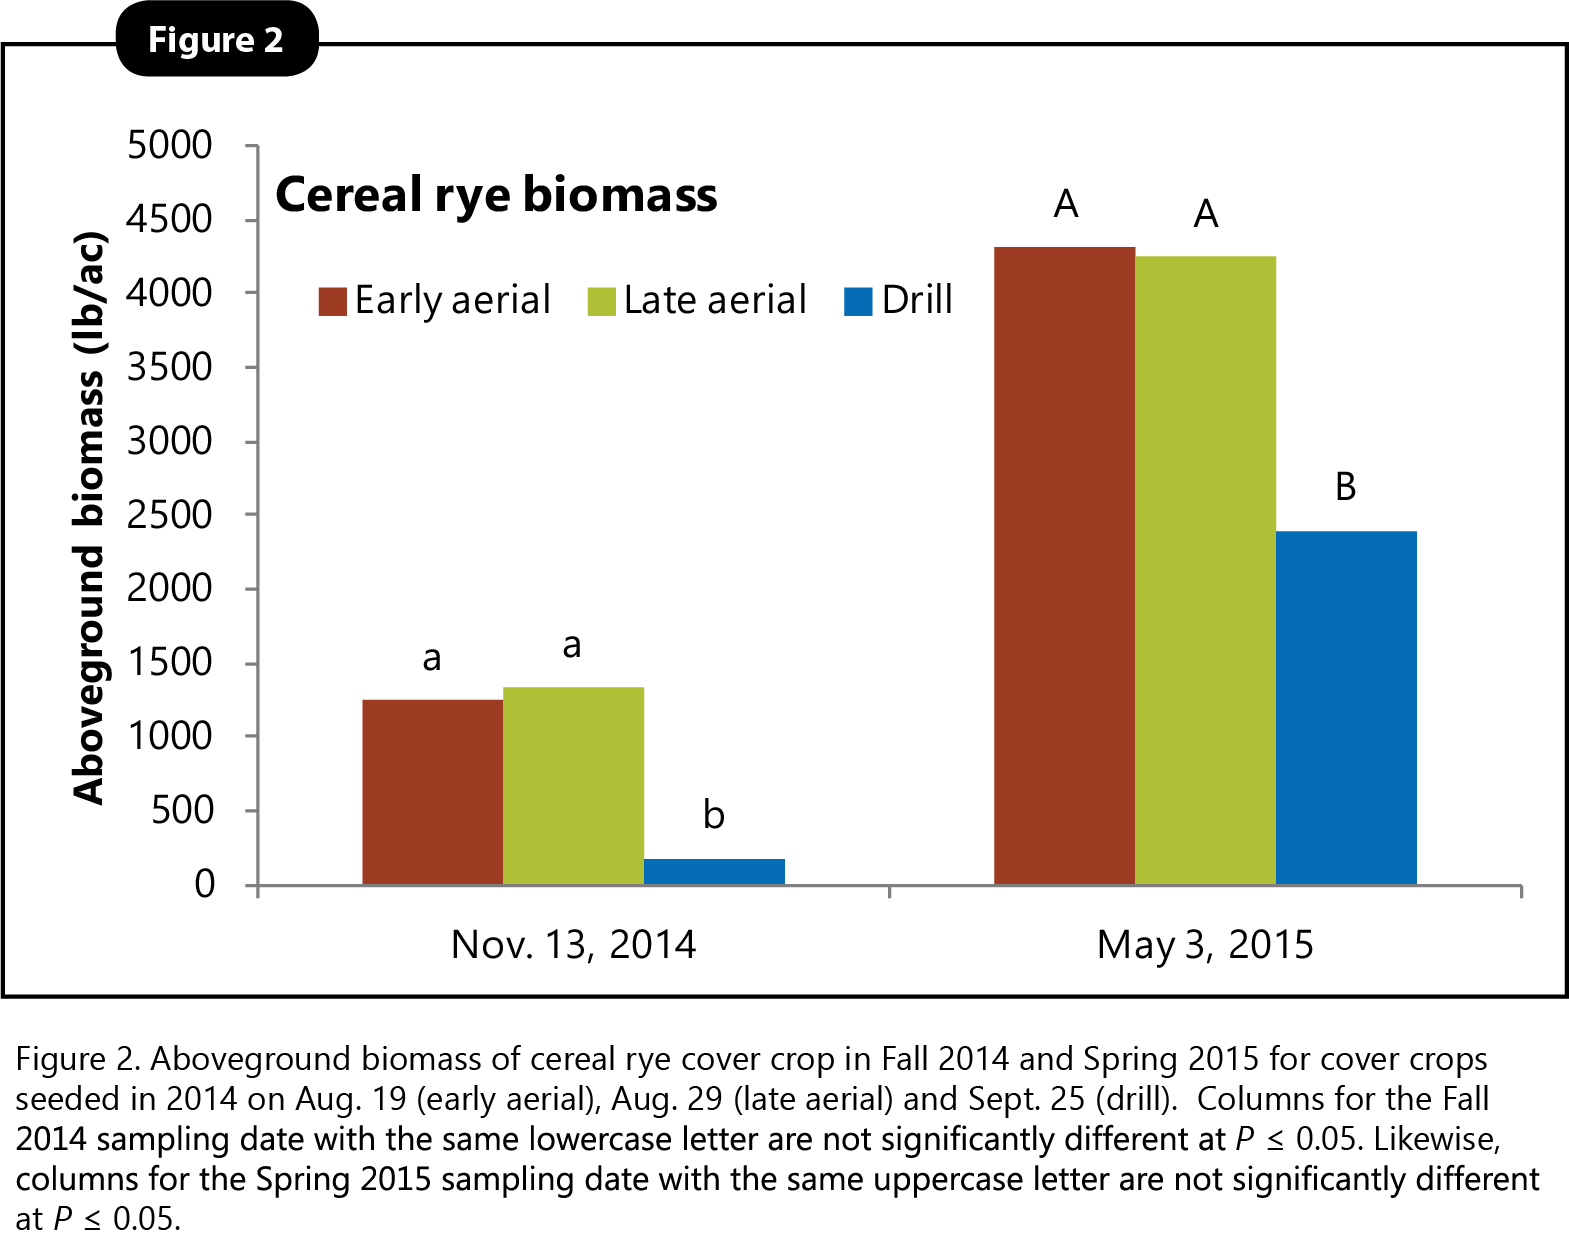 Aboveground biomass in all three treatments in the spring at Jack’s was generally much greater than what has been observed in previous Cooperators’ Program research (Carlson and Anderson, 2012; Dunn and Juchems, 2013; Carlson and Gailans, 2014; Gailans and Juchems, 2014; Gailans and Juchems, 2015). In these previous studies, cooperators have observed between 70 and 2,400 lb/ac of aboveground biomass in the spring when cereal rye was either aerially seeded or drilled in corn-soybean systems. It is likely that the cereal rye in the aerial seeding treatments at Jack’s received a greater amount of light penetrating through the canopy in his seed corn field (due to detasseling and destruction and removal of male rows) than what would typically be observed in corn or soybeans grown for grain. More light penetration than is normally expected may have been the cause for such a large amount of cereal rye growth in the fall in the aerial seeding treatments which translated to even more growth the following spring than what has often observed (Figure 2). Jack’s results also confirm those observed by researchers at Iowa State University who found increased cover crop growth in the spring the earlier the cover crop was seeded the previous fall (Anderson and Hartzler, 2014).
Cover crop biomass characteristics are presented in Table 1. Cover crop C and N content were calculated by multiplying aboveground biomass by C and N concentration, respectively. In the fall, the two aerial seeding treatments contained more C and N per acre than the drill seeding treatment owing to more cover crop aboveground biomass production.
In the spring, the two aerial seeding treatments once again resulted in more biomass than the drill seeding treatment. Not surprisingly, this also translated into more C and N in the aerially seeded cover crops.
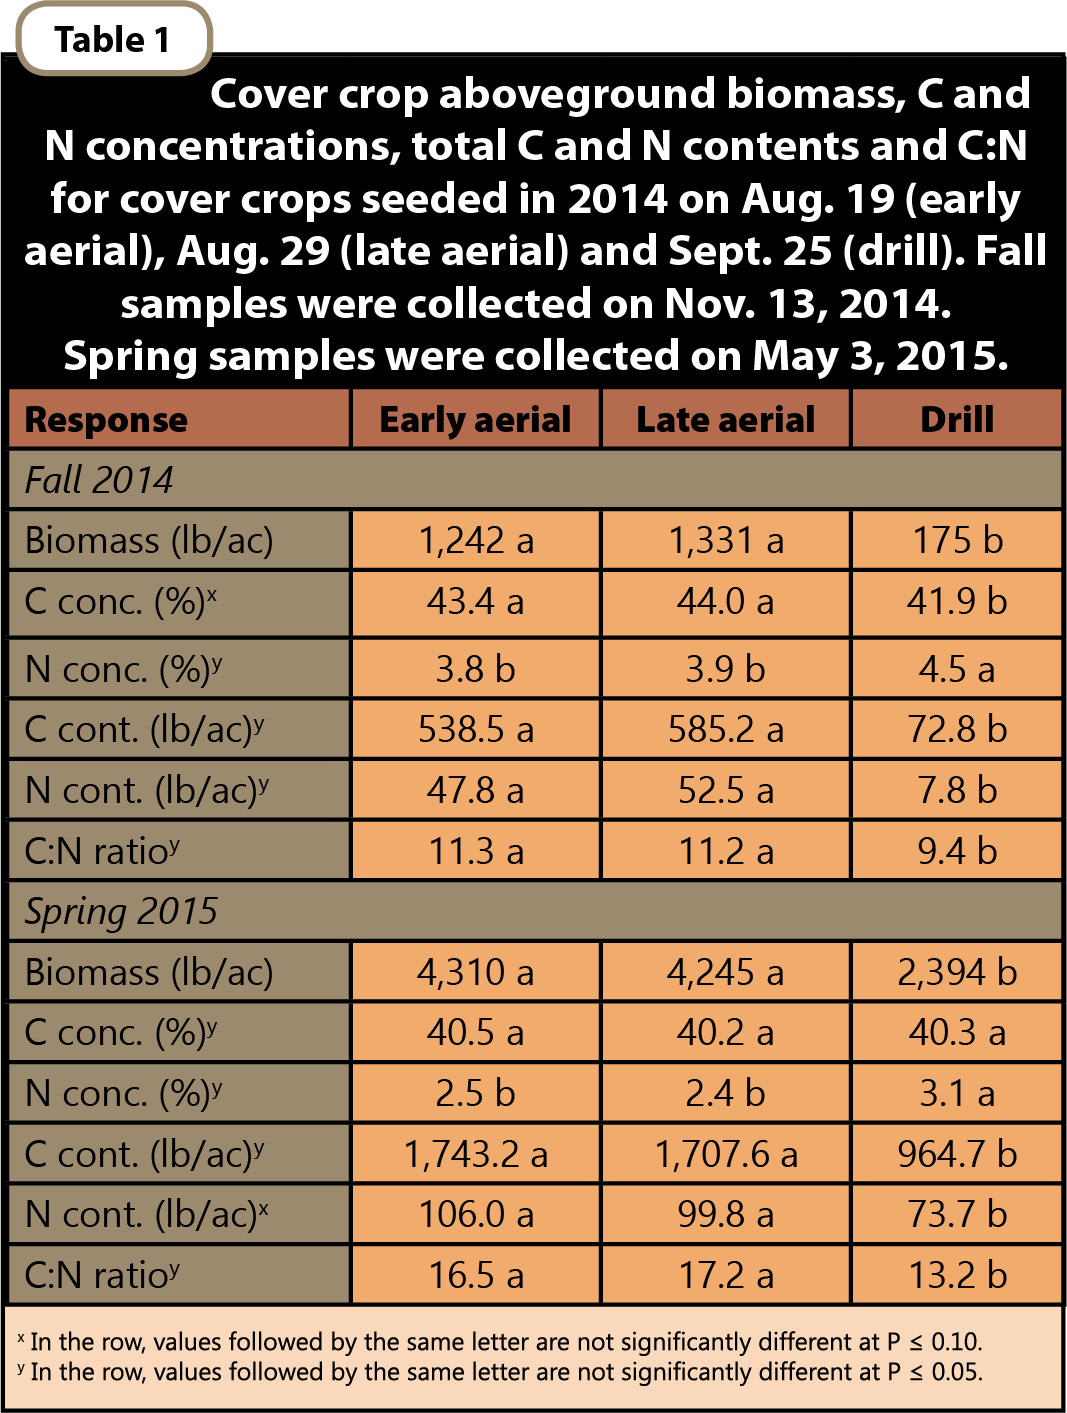 In both the fall and the spring, the drill seeding treatment resulted in the lowest C:N ratio. This would be expected as a less mature plant is less fibrous and has a lower C concentration and higher N concentration than a mature plant, which was observed in this case among the treatments (Table 1). The C:N ratios for all treatments in the spring are within the range (15–25) suitable for microbial decomposition and release of N to a succeeding cash crop given ideal conditions (Sullivan, 2003). Previous research in central Illinois observed cereal rye cover crop C:N ratios in the 27–35 range in early May and incomplete cover crop decomposition by mid-summer (Ruffo and Bollero, 2003). As perhaps a product of being further south and in warmer conditions, cover crop biomass in early May in these instances in Illinois was close to twice as much, and thus much more mature and fibrous, than what was observed at Jack’s farm in the present study. The cover crop biomass in all treatments at Jack’s would probably be expected to fully decompose by mid-summer 2015.
Soil chemical and health dynamics
Soil chemical and health characteristics for Fall 2014 and Spring 2015, as determined by the Haney Test, are presented in Table 2. When assessing available soil N, the Haney Test takes into account inorganic N pools (nitrate and ammonium), organic N pools, the organic C:organic N ratio and soil microbial activity. As C:N ratio rises, more N is tied up in soil microbial biomass and not immediately plant-available nor vulnerable to leaching. The Solvita method is used to measure soil microbial activity by quantifying the amount of CO2 released in 24 hours after the soil sample has been dried and rewetted (Ward Laboratories, 2015). The Soil Health Score is calculated as Solvita CO2-C ÷ Organic C:N + Organic C/100 + Organic N. This is an indication of the overall health of the soil with a larger value indicating a higher level of health (Ward Laboratories, 2015).
 In the fall, soil nitrate concentrations were lower and C:N ratios greater in the aerial seeding treatments compared to the drill seeding and no-cover treatments, but there were no differences among treatments in soil microbial activity or with respect to the Soil Health Score (Table 2). Along with lower soil nitrate concentrations, total available soil N was also least in the two aerial seeding treatments.
In the spring, the cover crop treatments resulted in a drastic reduction of soil nitrate, organic N and total available N compared to the no-cover treatment (Table 2). The C:N ratio was also greater in the cover crop treatments. More soil microbial activity was detected in the cover crop treatments compared to the no-cover treatment as determined by the Solvita method, but there was no difference, once again, in Soil Health Score among the treatments. Recall that the Soil Health Score is improved by both higher levels of soil microbial activity and higher concentrations of soil organic N. The cover crop treatments had high levels of soil microbial activity but low concentrations of soil organic N, while the no-cover treatment was opposite—low levels of soil microbial activity and high concentrations of soil organic N.
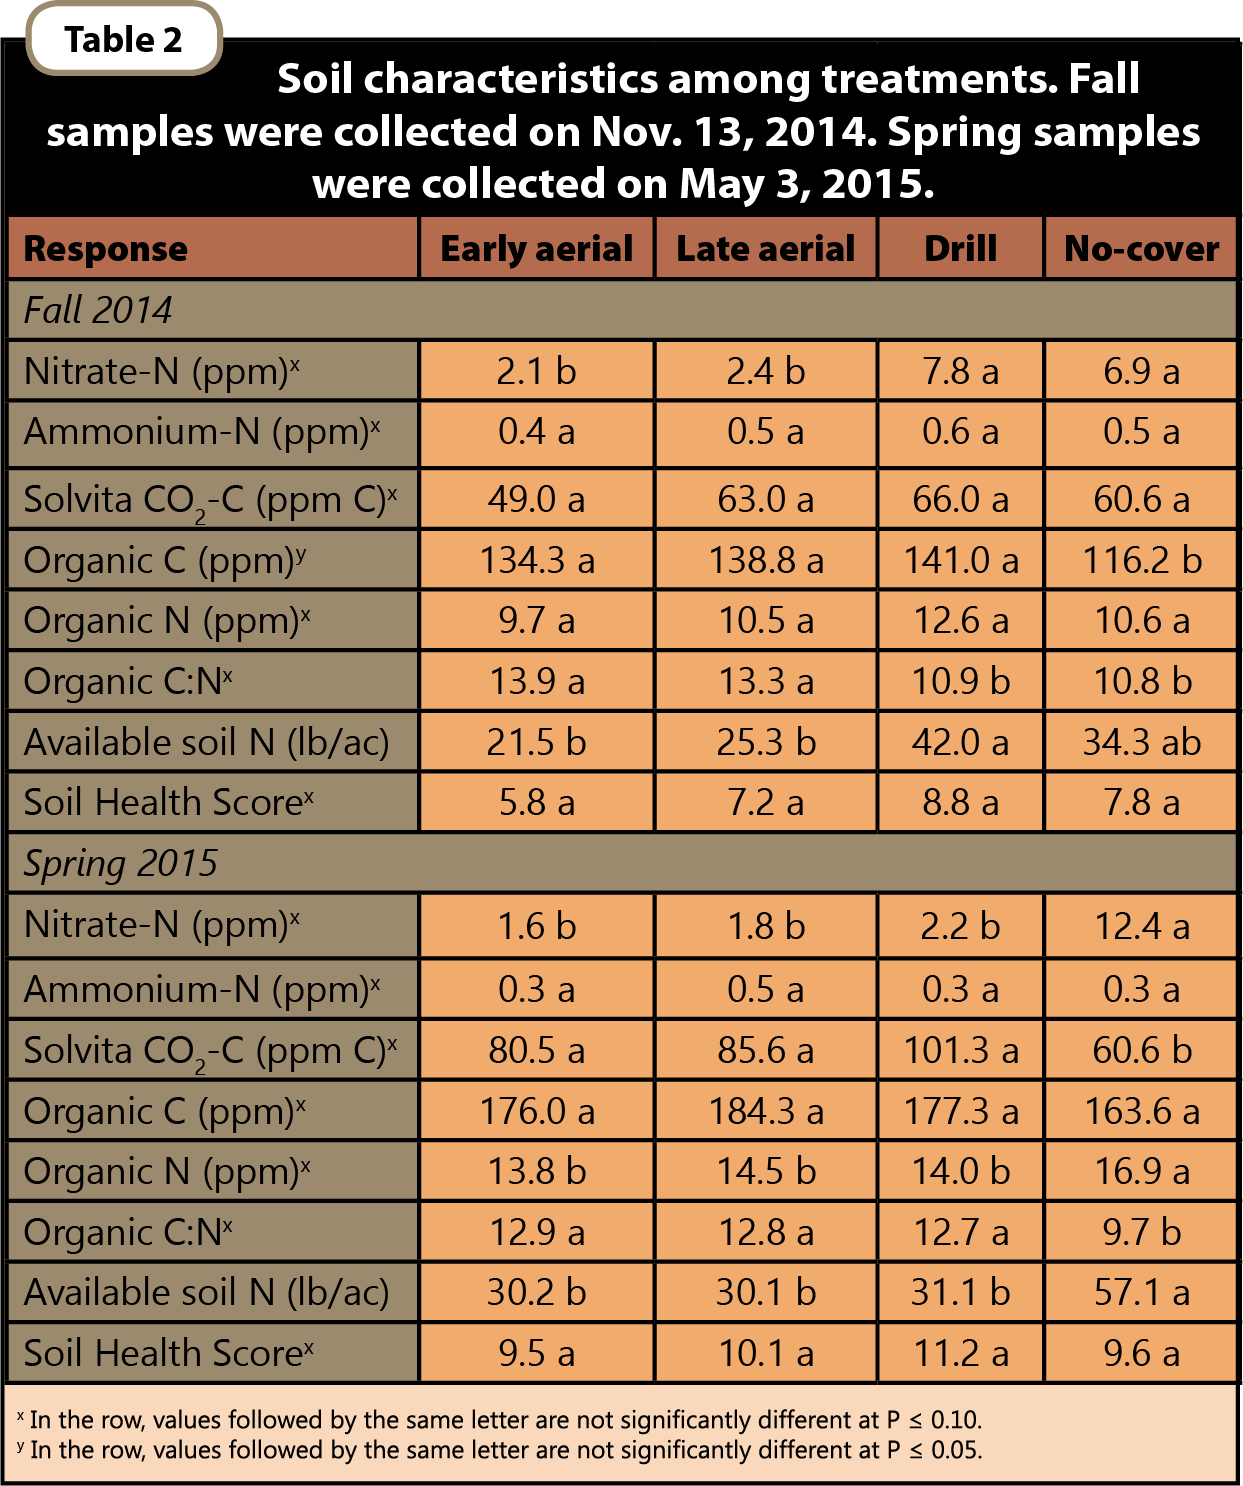
Aboveground biomass on Oct. 10, 2014 of cereal rye seeded on A) Aug. 19 [early aerial]; B) Aug. 29 [late aerial]; C) Sept. 25. [drill].
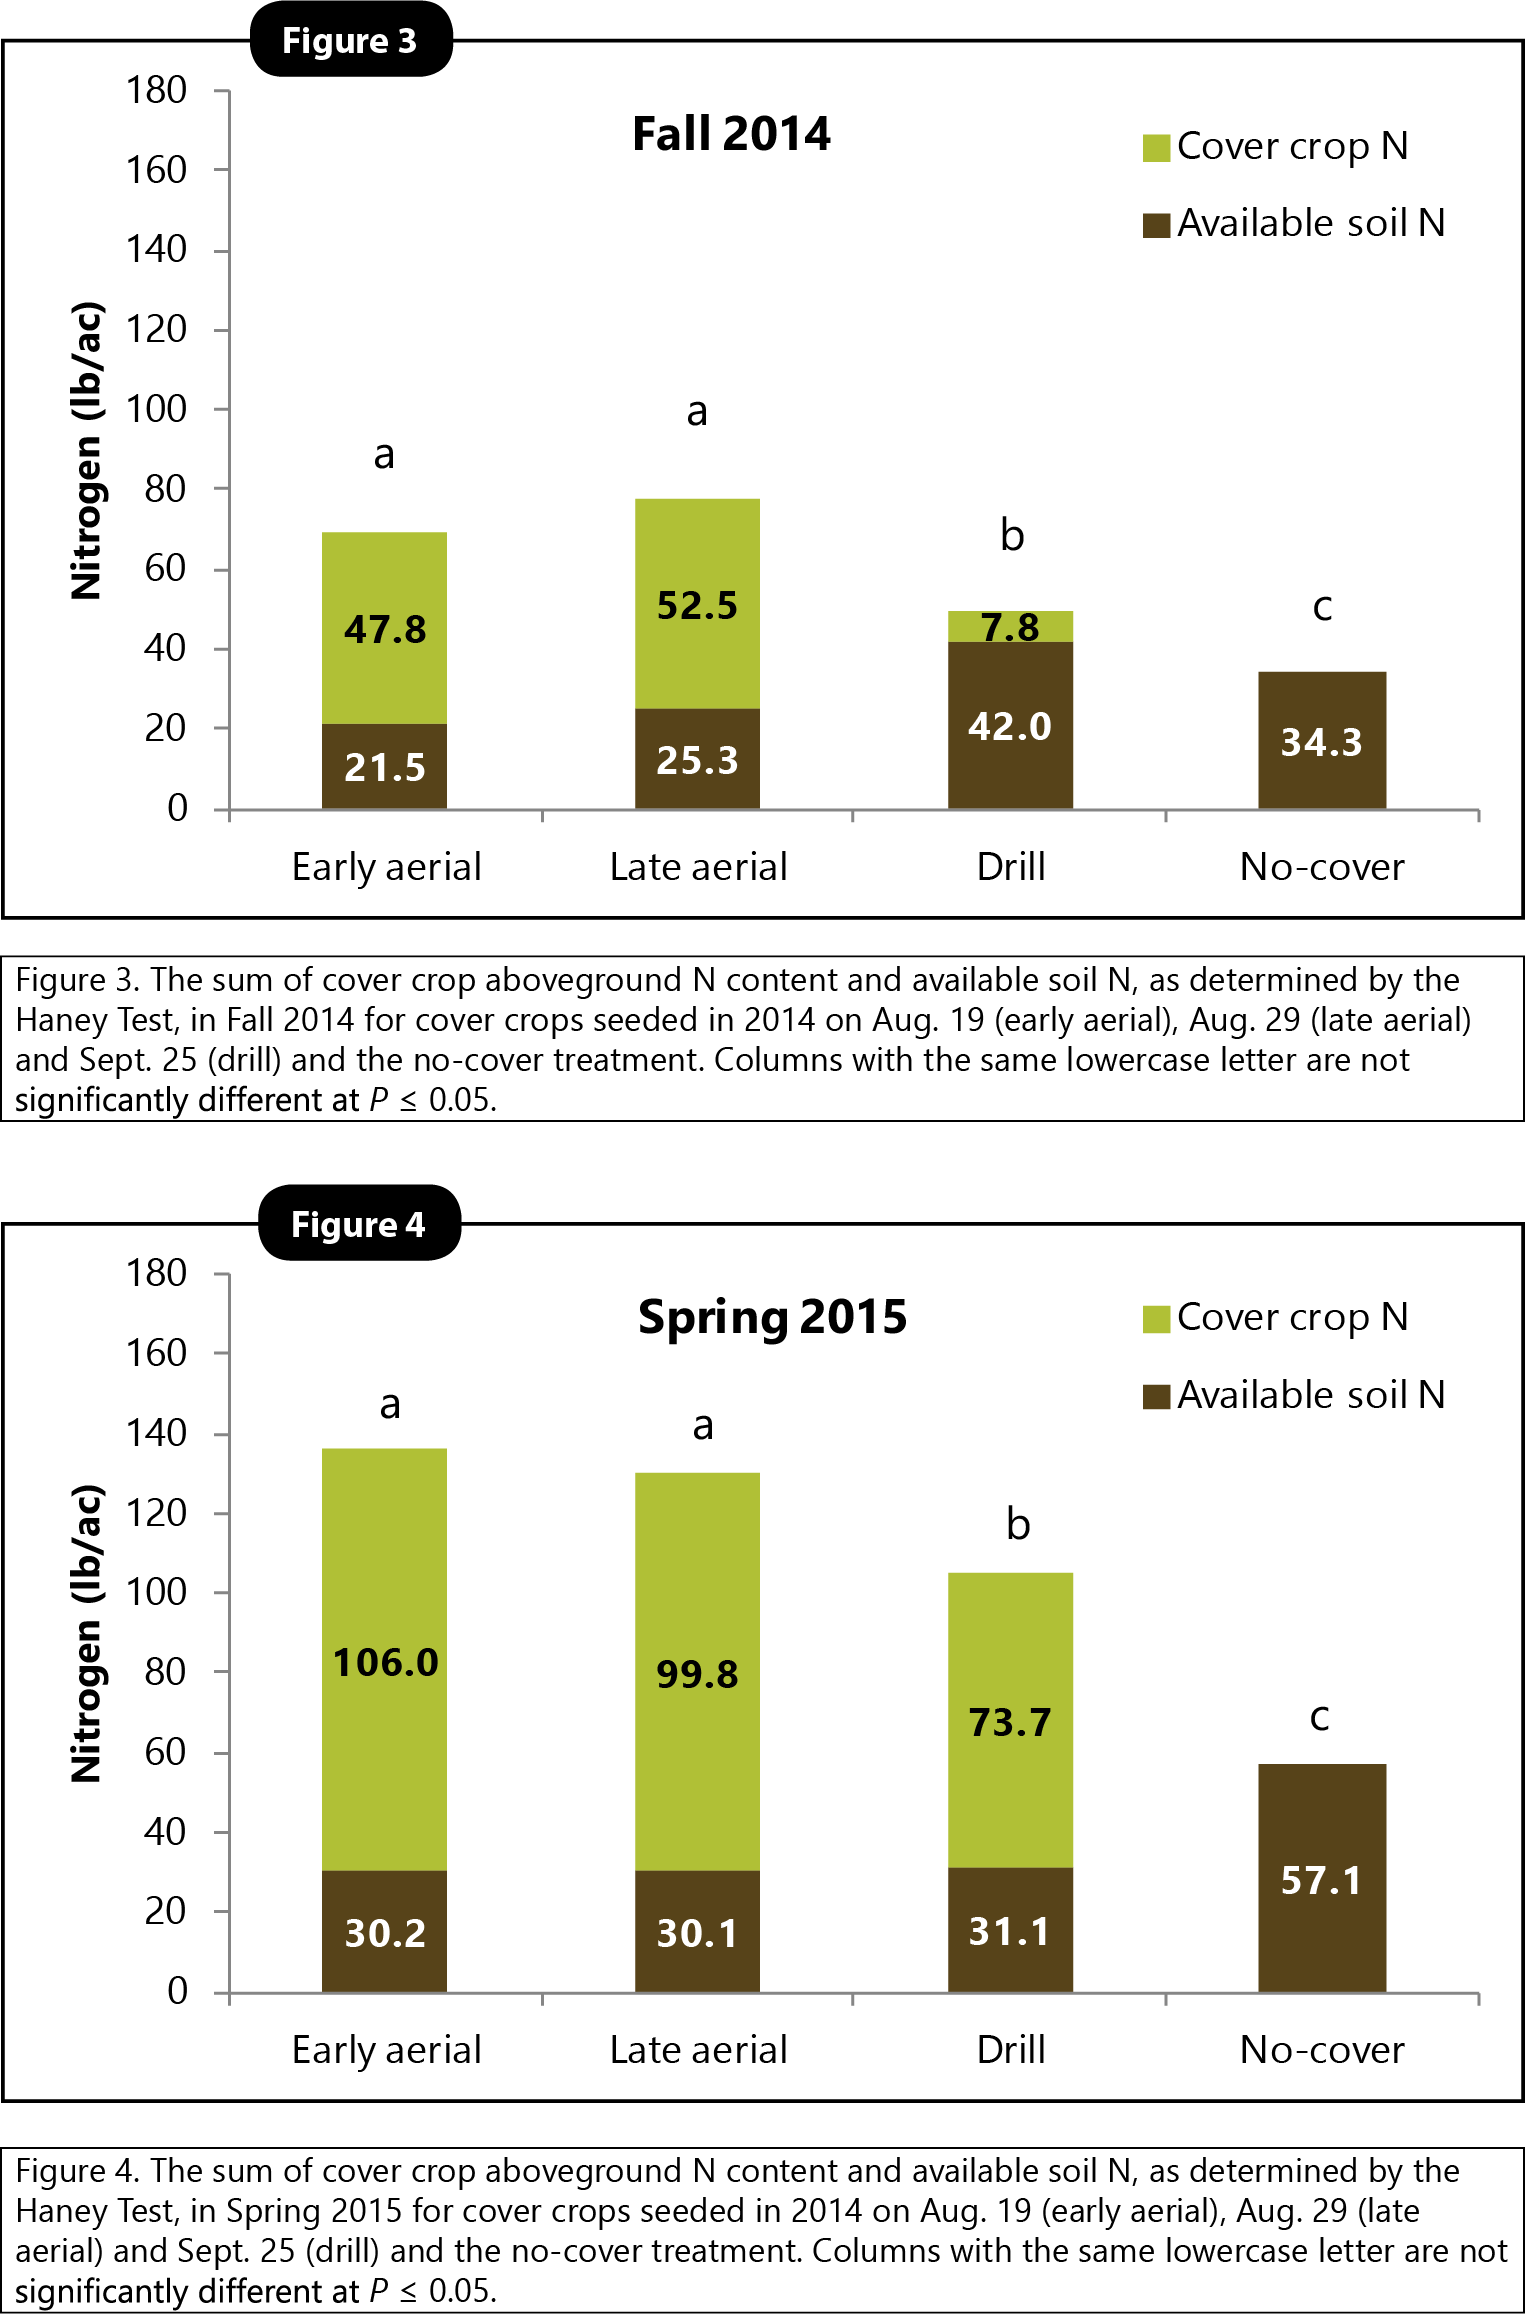 When considering both cover crop and available soil N, there was more N altogether in the cover crop treatments than the no-cover treatment in both the fall and spring (Figures 3 and 4). Available soil N is the sum of plant-available, inorganic N (nitrate and ammonium) and the fraction of organic N the Haney Test expects to become plant available. Except for in the drill seeding treatment in the fall, most of the N was in the cover crop biomass in both the fall and spring. This is important to note, as the N in the cover crop is in a stable form and less susceptible to loss via leaching than nitrate in the soil. The difference in N (cover crop N + available soil N) between the cover crop treatments and the no-cover treatment could be due to N loss from the no-cover treatment. Because there is no cover crop N uptake in the no-cover treatment, the soil N in that treatment has two fates: it either remains in the soil or is lost from the soil altogether. Assuming all treatments started with the same amount of N in the soil prior to cover crop growth, the lack of any plant N uptake in the no-cover treatment means that some N likely leached from the soil prior to sampling. Thus, the cover crop treatments kept more N in the field that will eventually become plant-available.
Studies across Iowa and southern Minnesota have shown that incorporating a cereal rye cover crop into corn-soybean production systems can reduce nitrate leaching (Strock et al., 2004; Kaspar et al., 2007; Qi and Helmers, 2010; Qi et al., 2011; Kaspar et al., 2012). These studies have noted significant reductions in nitrate concentration in drainage water during the spring due to the presence of a living cover crop compared to bare soil—actively growing plants (cover crop) intercept plant-available nitrate that would otherwise be lost from the system with drainage water. The average amount of spring cereal rye aboveground biomass observed in these studies was 1,165 lb/ac. Given Jack’s findings, it stands to reason that cover crops help to prevent N from leaching into and polluting surface waters by reducing nitrate concentration in the soil during the times of the year when cash crops are not actively growing.
Economic considerations
With the amount plant N uptake in the cover crop treatments, Jack began perceiving financial benefits of the cover crop. On average there was 66.5 lb N/ac more in the cover crop areas that can be available to the succeeding cash crop in the spring (Figure 4). C:N ratios of the cover crop biomass (Table 1) were such that it would be expected for the N to be released to the cash crop by mid-summer (Sullivan, 2003). Given some local prices of fertilizer N (anhydrous ammonia: $0.45/ lb N; UAN: $0.56/lb N), Jack was able to put a value of $29–$37/ac on the N contained in the cover crop. “This would pay for this cover crop,” Jack says when considering the costs incurred to purchase and seed the cover crop. “For me as a farmer, this was one of the most important observations.”
Conclusions and Next Steps
Jack Boyer tried three different cover crop seeding dates in August–September 2014 in his field of seed corn. The two August seeding dates resulted in more cover crop growth and contained more N in the biomass in both Fall 2014 and Spring 2015. The soil N dynamics observed on Jack’s farm in the fall and spring can be attributed to the cover crops. Farmers interested in reducing potential N loss in both the fall and spring will want to consider aerially seeding cover crops in late summer to get enough cover crop growth for active uptake of nitrate. Waiting to drill in the fall after cash crop harvest did not result in enough cover crop growth in the fall but did reduce the potential for N loss the following spring as the cover crop grows out of dormancy. Compared to the no-cover treatment, the cover crop treatments resulted in increased soil microbial activity in the spring as determined by the Solvita method in the Haney Test. Thus, Jack’s findings confirm the environmental benefits of previous cover crop research with respect to soil life and water quality. It remains to be known why exactly the cover crops did not improve the Soil Health Score – the aspect of the Haney Test that farmers are most interested in. In the cover crop treatments, the higher level of microbial activity was offset by a lower level of soil organic N compared to the no-cover treatment. Collecting the soil samples when the cover crop is not actively growing following termination and before the succeeding cash crop is at peak growth could possibly affect the Soil Health Score but this remains speculative. Jack remains patient about improving his soil, “It has been my experience and understanding that it takes three to five years to show significant growth in the soil health.”
 “The info generated by this study about soil nutrients and health gives background for the development of the soil and reduced nutrient loss,” Jack continues. When thinking about the value of how much N is in the aboveground biomass in the cover crop treatments, Jack is convinced, “This helps me understand how I can pay for it.”
Next, Jack plans to observe a soybean crop planted into these strips with two different cover crop termination dates—two weeks prior to planting and the day after planting. The ultimate goal is to determine any agronomic benefits of the cover crop to accompany the environmental benefits observed in this study.
References
- Anderson, M. and B. Hartzler. 2014. Will a cereal rye cover crop suppress your weeds? Iowa State University Extension and Outreach, Ames, IA. http://www.weeds.iastate.edu/mgmt/2014/ryesuppression.pdf (accessed June2, 2015).
- Carlson, S. and A. Anderson. 2012. Cover crops do double duty: cover and grain. Practical Farmers of Iowa Cooperators’ Program. Ames, IA. http://practicalfarmers.org/farmer-knowledge/research-reports/2012/cover-crops-double-duty-cover-and-small-grains/ (accessed June 10, 2015).
- Carlson, S. and S. Gailans. 2014. Cover crop variety trial 2013-2014. Practical Farmers of Iowa Cooperators’ Program. Ames, IA. http://practicalfarmers.org/farmer-knowledge/research-reports/2014/cover-crop-variety-trial-2013-2014/ (accessed June 10, 2015).
- Dunn, M. and L. Juchems. 2013. Winter rye cover crop effect on soil. Iowa Learning Farms and Practical Farmers of Iowa. Ames, IA. http://practicalfarmers.org/farmer-knowledge/research-reports/2013/winter-rye-cover-crop-effects-soil/ (accessed June 10, 2015).
- Gailans, S. and L. Juchems. 2014. Winter cereal rye cover crop effect on cash crop yield: Year 5. Iowa Learning Farms and Practical Farmers of Iowa. Ames, IA. http://practicalfarmers.org/farmer-knowledge/research-reports/2014/winter-cereal-rye-cover-crop-effect-cash-crop-yield/ (accessed June 10, 2015).
- Gailans, S. and L. Juchems. 2015. Winter cereal rye cover crop effect on cash crop yield: Year 6. Iowa Learning Farms and Practical Farmers of Iowa. Ames, IA. http://practicalfarmers.org/farmer-knowledge/research-reports/2015/winter-cereal-rye-cover-crop-effect-on-cash-crop-yield-year-6/ (accessed June 10, 2015).
- Iowa Department of Agriculture and Land Stewardship, Iowa Department of Natural Resources, and Iowa State University College of Agriculture and Life Sciences. 2012. Iowa nutrient reduction strategy. Iowa State University, Ames, IA. http://www.nutrientstrategy.iastate.edu/ (accessed Oct. 2, 2014).
- Iowa Environmental Mesonet. 2015. Climodat Reports. Iowa State University, Ames, IA. http://mesonet.agron.iastate.edu/climodat/ (accessed June 2, 2015).
- Kaspar, T., D. Jaynes, T. Parkin, and T. Moorman. 2007. Rye cover crop and gamagrass strip effects on NO3 concentration and load in tile drainage. J. Environ. Qual. 36:1503-1511.
- Kaspar, T., D. Jaynes, T. Parking, T. Moorman, and J. Singer. 2012. Effectiveness of oat and rye cover crops in reducing nitrate losses in drainage water. Agriculture and Water Management. 110:25-33.
- Qi, Z. and M. Helmers. 2010. Soil water dynamics under winter rye cover crop in central Iowa. Vadose Zone J. 9:53-60.
- Qi, Z., M. Helmers, R. Christianson, and C. Pederson. 2011. Nitrate-nitrogen losses through subsurface drainage under various agricultural land covers. J. Environ. Qual. 40:1578-1585.
- Ruffo, M. and G. Bollero. 2003. Modeling rye and hairy vetch decomposition as a function of degree-days and decomposition-days. Agron J. 95:900–907.
- Strock, J., P. Porter, and P. Russelle. 2004. Cover cropping to reduce nitrate loss through subsurface drainage in the northern U.S. Corn Belt. J. Environ. Qual. 33:1010-1016.
- Sullivan, P. 2003. Overview of cover crops and green manures. NCAT-ATTRA. Fayetteville, AR.
- Ward Laboratories. 2015. Haney/Soil Health Test Information. Ward Laboratories. Kearney, NE. http://www.wardlab.com/haney/haney_info.aspx (accessed 17 Apr. 2015).