In a Nutshell:
- Nineteen farmers performed 22 replicated strip trials testing their typical nitrogen (N) rate against that rate reduced by an amount of their choosing.
- Farmers chose to test N reductions ranging from 20-60 lb N/ac (reducing 12-50% of typical rate).
- Most farms routinely used cover crops in the past five years (15), while some used a diversified crop rotation (4), applied manure (5) or incorporated grazing (4). Farms were predominantly in no-till with some occasionally including strip-till.
Key Findings:
- All sites experienced warmer-than-average and drier-than-average growing seasons.
- Nineteen of the 22 trials potentially saved money when reducing their N rates.
Background
This newest round nitrogen fertilizer rate trials builds on trials conducted in Iowa in 2022 [1]. This year we expanded eligibility to the larger Midwest, and once again included farmers who self-identified as using soil health-promoting practices for at least five years. Using a replicated strip-trial design, farmers compared yields, finances and greenhouse gas emissions at their usual N rate with those observed at a reduced rate. Farmers chose their own reduction rates, while PFI staff encouraged farmers to be aggressive. One goal of the trial was to push farmers to explore N rates outside of their comfort zone. If farmers can maintain corn yields and/or save money at the reduced N rate, results might spark confidence to reduce (or at least question) fertilizer rates going forward. “If I can arrive at a lower baseline N rate without reducing total production on farm, that is a significant opportunity for increased margin,” said Keaton Krueger at the onset of the trial. If the reduced N rate lowers corn yields and loses money, farmers will still have gained valuable information: They can be more confident that their typical rate is the right rate for their farm, but maybe new long-term practices could help reduce it in the future. Additionally, while individual trials are immensely useful for farmers, aggregating many trial results can provide a more powerful dataset to help farmers evaluate their N rates. Or, as Ross McCaw said, “[This project] will help myself and others gain more information on what practices are most profitable and better for the land.”
Methods
DesignCooperating farms in 2023 were located across Iowa (17) and Wisconsin (2). All farmers used two treatments:
- Typical - Their typical N fertilizer rate applied to a corn crop.
- Reduced - An N fertilizer rate less than the typical rate.
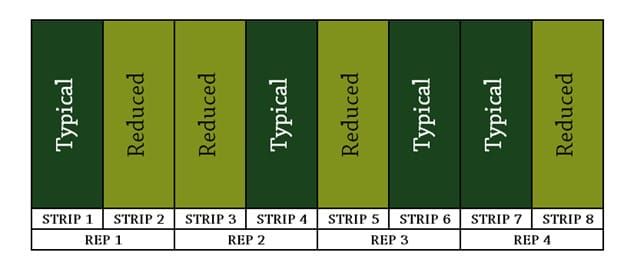
All treatments were replicated at least four times, resulting in a total of at least eight plots in each farmer’s trial (Figure 1).
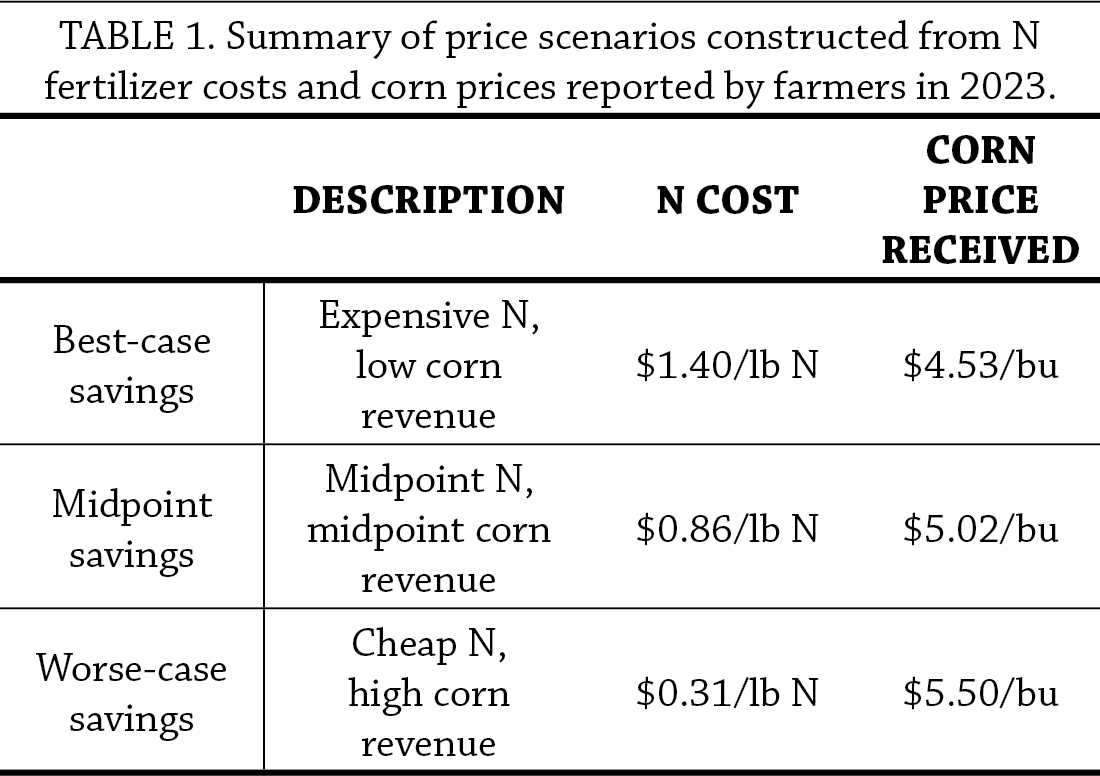 A partial budget using a given price scenario was performed for each treatment. Costs were estimated as the amount of N applied in that treatment multiplied by the assumed N cost, which depended on the scenario (Table 1). If the yields of each treatment were statistically different, each treatment’s yields were used for corn revenue calculations. If there was no statistical difference in treatment yields, the overall mean yield for the trial was used for corn revenue calculations. Partial net revenue for each treatment was calculated by subtracting the costs (N applied multiplied by N cost) from the revenue (yield multiplied by corn price). The difference between partial net revenues for the ‘reduced’ and ‘typical’ treatments were calculated and reported. A positive value therefore represents financial savings at the reduced N rate. This process was done separately for the three price scenarios.
Greenhouse gas emissions
When a farmer reduces the amount of chemical N fertilizer applied to a field, two sources of greenhouse gas (GHG) emissions associated with crop production are avoided: the GHGs (expressed as carbon dioxide equivalents, CO2e) released during fertilizer manufacturing processes, and the nitrous oxide (N2O) released from the soil due to biological processes driven by N application. To convert N2O to CO2e, a 100-year time horizon was assumed based on Intergovernmental Panel on Climate Change (IPCC) recommendations [2]. Over the period of 100-years, one pound of N2O will have a forcing potential equal to 298 pounds of CO2e [2].
The CO2e released during fertilizer manufacturing was estimated using two values: (1) energy used to manufacture nitrogen fertilizers as reported from the 2022 GREET® (Greenhouse gases, Regulated Emissions, and Energy use in Technologies) model, developed by the Department of Energy’s Argonne National Laboratory (58 MJ/kg N) [3], and (2) the amount of CO2e released per MJ of energy used as reported by the Environmental Protection Agency [4]. The avoided N2O as a result of decreased N application was estimated using the IPCC methodologies for both direct and indirect agricultural N2O emissions [5]. All above calculations can be simplified to a constant conversion factor: the pounds of N reduced per acre from the typical rate can be multiplied by 7.82 to get pounds of CO2e avoided per acre.
The acres needed to reduce a given amount of N application to equate to the emissions generated by a single United States (US) vehicle were calculated using the EPA’s estimates for vehicle emissions [6]. The EPA uses statistics to represent an average US gasoline vehicle (22 miles per gallon, driven 11,500 miles per year), and estimates the emissions from one vehicle using those values (estimated to be 10,141 lb CO2e/year) [6].
Results and Discussion
Treatments
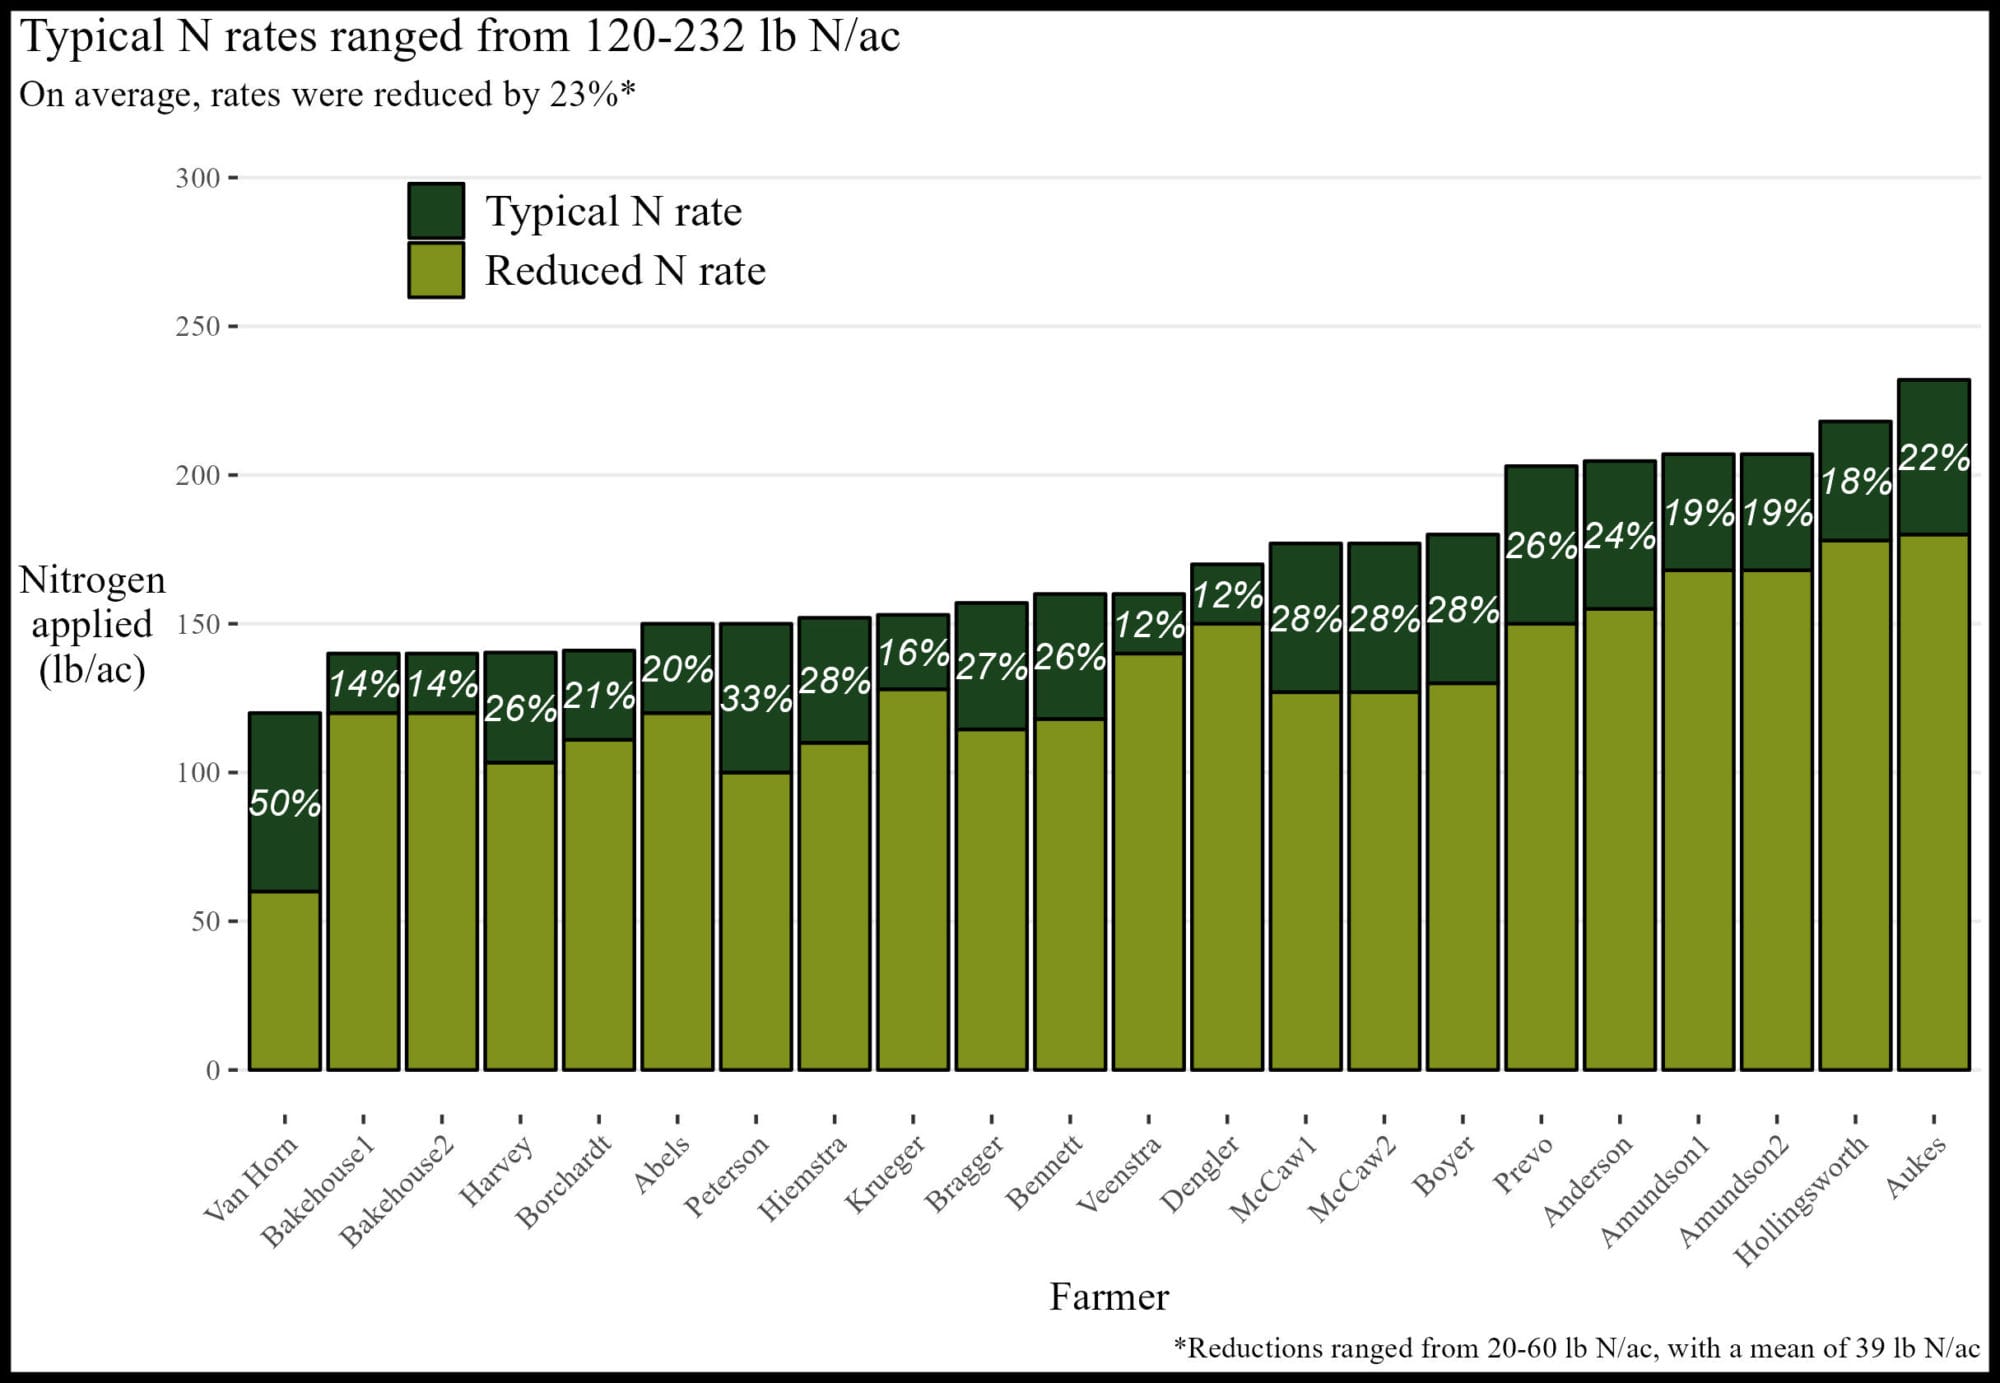
Nineteen farmers conducted a total of 22 independent N trials. The chosen treatments reflected the diversity in farming systems, with typical N rates ranging from 120-232 lb N/ac and reduced N rates ranging from 60-180 lb N/ac (Figure 2). When averaged over all trials, typical and reduced N rate treatments were 170 lb N/ac and 131 lb N/ac, respectively, for an average reduction of 39 lb N/ac.
A partial budget using a given price scenario was performed for each treatment. Costs were estimated as the amount of N applied in that treatment multiplied by the assumed N cost, which depended on the scenario (Table 1). If the yields of each treatment were statistically different, each treatment’s yields were used for corn revenue calculations. If there was no statistical difference in treatment yields, the overall mean yield for the trial was used for corn revenue calculations. Partial net revenue for each treatment was calculated by subtracting the costs (N applied multiplied by N cost) from the revenue (yield multiplied by corn price). The difference between partial net revenues for the ‘reduced’ and ‘typical’ treatments were calculated and reported. A positive value therefore represents financial savings at the reduced N rate. This process was done separately for the three price scenarios.
Greenhouse gas emissions
When a farmer reduces the amount of chemical N fertilizer applied to a field, two sources of greenhouse gas (GHG) emissions associated with crop production are avoided: the GHGs (expressed as carbon dioxide equivalents, CO2e) released during fertilizer manufacturing processes, and the nitrous oxide (N2O) released from the soil due to biological processes driven by N application. To convert N2O to CO2e, a 100-year time horizon was assumed based on Intergovernmental Panel on Climate Change (IPCC) recommendations [2]. Over the period of 100-years, one pound of N2O will have a forcing potential equal to 298 pounds of CO2e [2].
The CO2e released during fertilizer manufacturing was estimated using two values: (1) energy used to manufacture nitrogen fertilizers as reported from the 2022 GREET® (Greenhouse gases, Regulated Emissions, and Energy use in Technologies) model, developed by the Department of Energy’s Argonne National Laboratory (58 MJ/kg N) [3], and (2) the amount of CO2e released per MJ of energy used as reported by the Environmental Protection Agency [4]. The avoided N2O as a result of decreased N application was estimated using the IPCC methodologies for both direct and indirect agricultural N2O emissions [5]. All above calculations can be simplified to a constant conversion factor: the pounds of N reduced per acre from the typical rate can be multiplied by 7.82 to get pounds of CO2e avoided per acre.
The acres needed to reduce a given amount of N application to equate to the emissions generated by a single United States (US) vehicle were calculated using the EPA’s estimates for vehicle emissions [6]. The EPA uses statistics to represent an average US gasoline vehicle (22 miles per gallon, driven 11,500 miles per year), and estimates the emissions from one vehicle using those values (estimated to be 10,141 lb CO2e/year) [6].
Results and Discussion
Treatments
Nineteen farmers conducted a total of 22 independent N trials. The chosen treatments reflected the diversity in farming systems, with typical N rates ranging from 120-232 lb N/ac and reduced N rates ranging from 60-180 lb N/ac (Figure 2). When averaged over all trials, typical and reduced N rate treatments were 170 lb N/ac and 131 lb N/ac, respectively, for an average reduction of 39 lb N/ac.
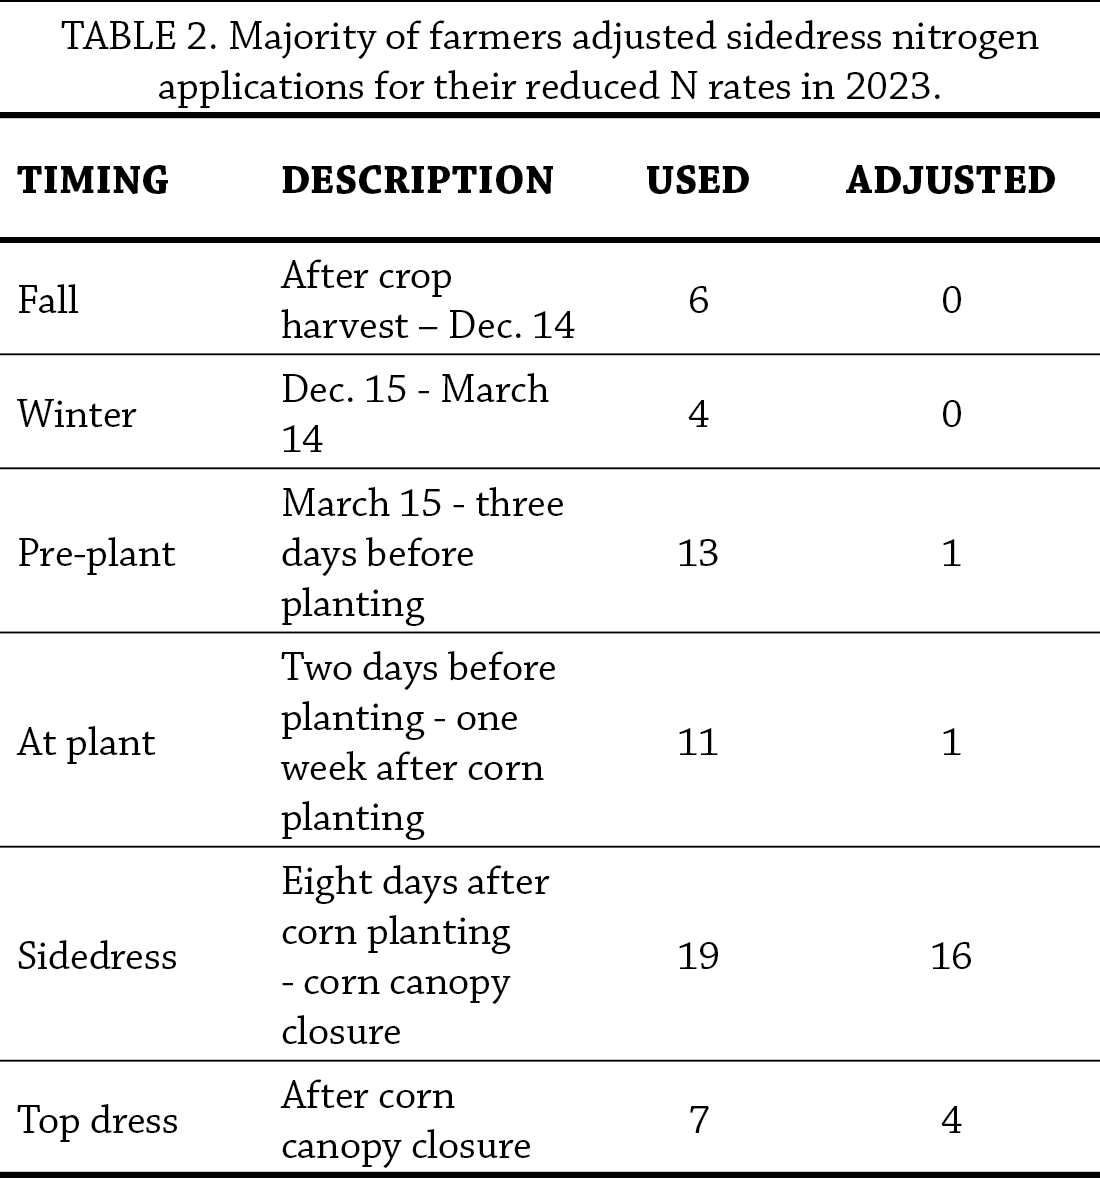 Farmers used a variety of N application timings in their production systems, with most using sidedressing. For the reduced N treatment, 16 of the 22 trials chose to reduce N rates during sidedressing, while holding other applications constant (Table 2).
Weather
All 22 trial locations saw progressively warmer- and drier-than-average growing seasons (Figure 3).
Farmers used a variety of N application timings in their production systems, with most using sidedressing. For the reduced N treatment, 16 of the 22 trials chose to reduce N rates during sidedressing, while holding other applications constant (Table 2).
Weather
All 22 trial locations saw progressively warmer- and drier-than-average growing seasons (Figure 3).
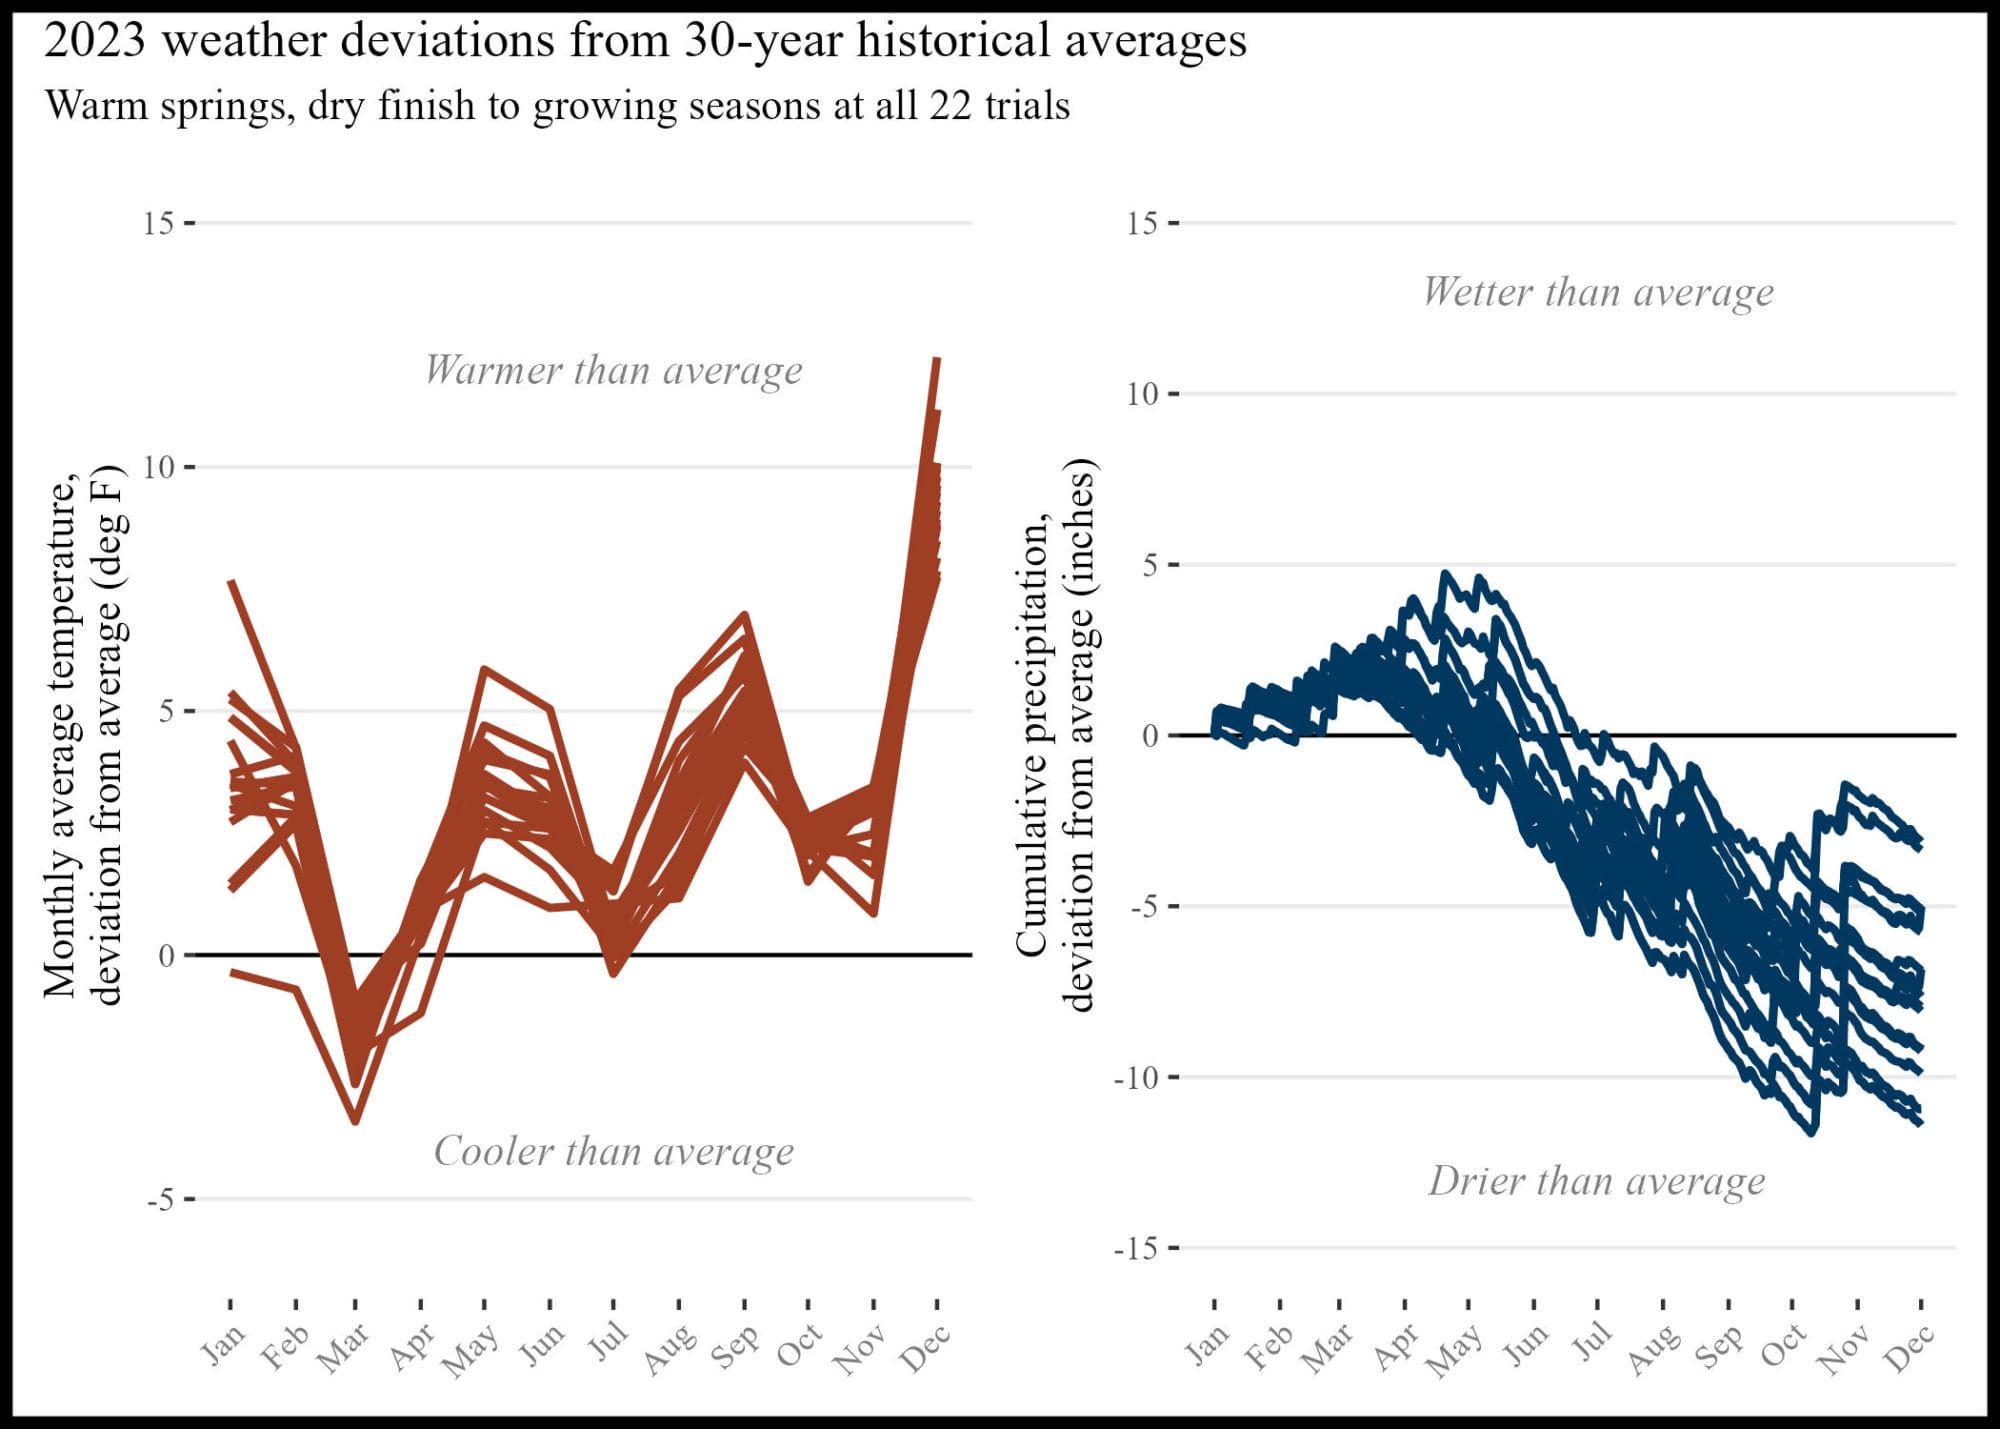
Overall, although all sites experienced a hot and dry growing season, the diversity in N application amounts, sources, methods, and timing as well as cropping system history contributed to varied outcomes for each cooperator. Click to enlarge.
Conclusions and Next Steps
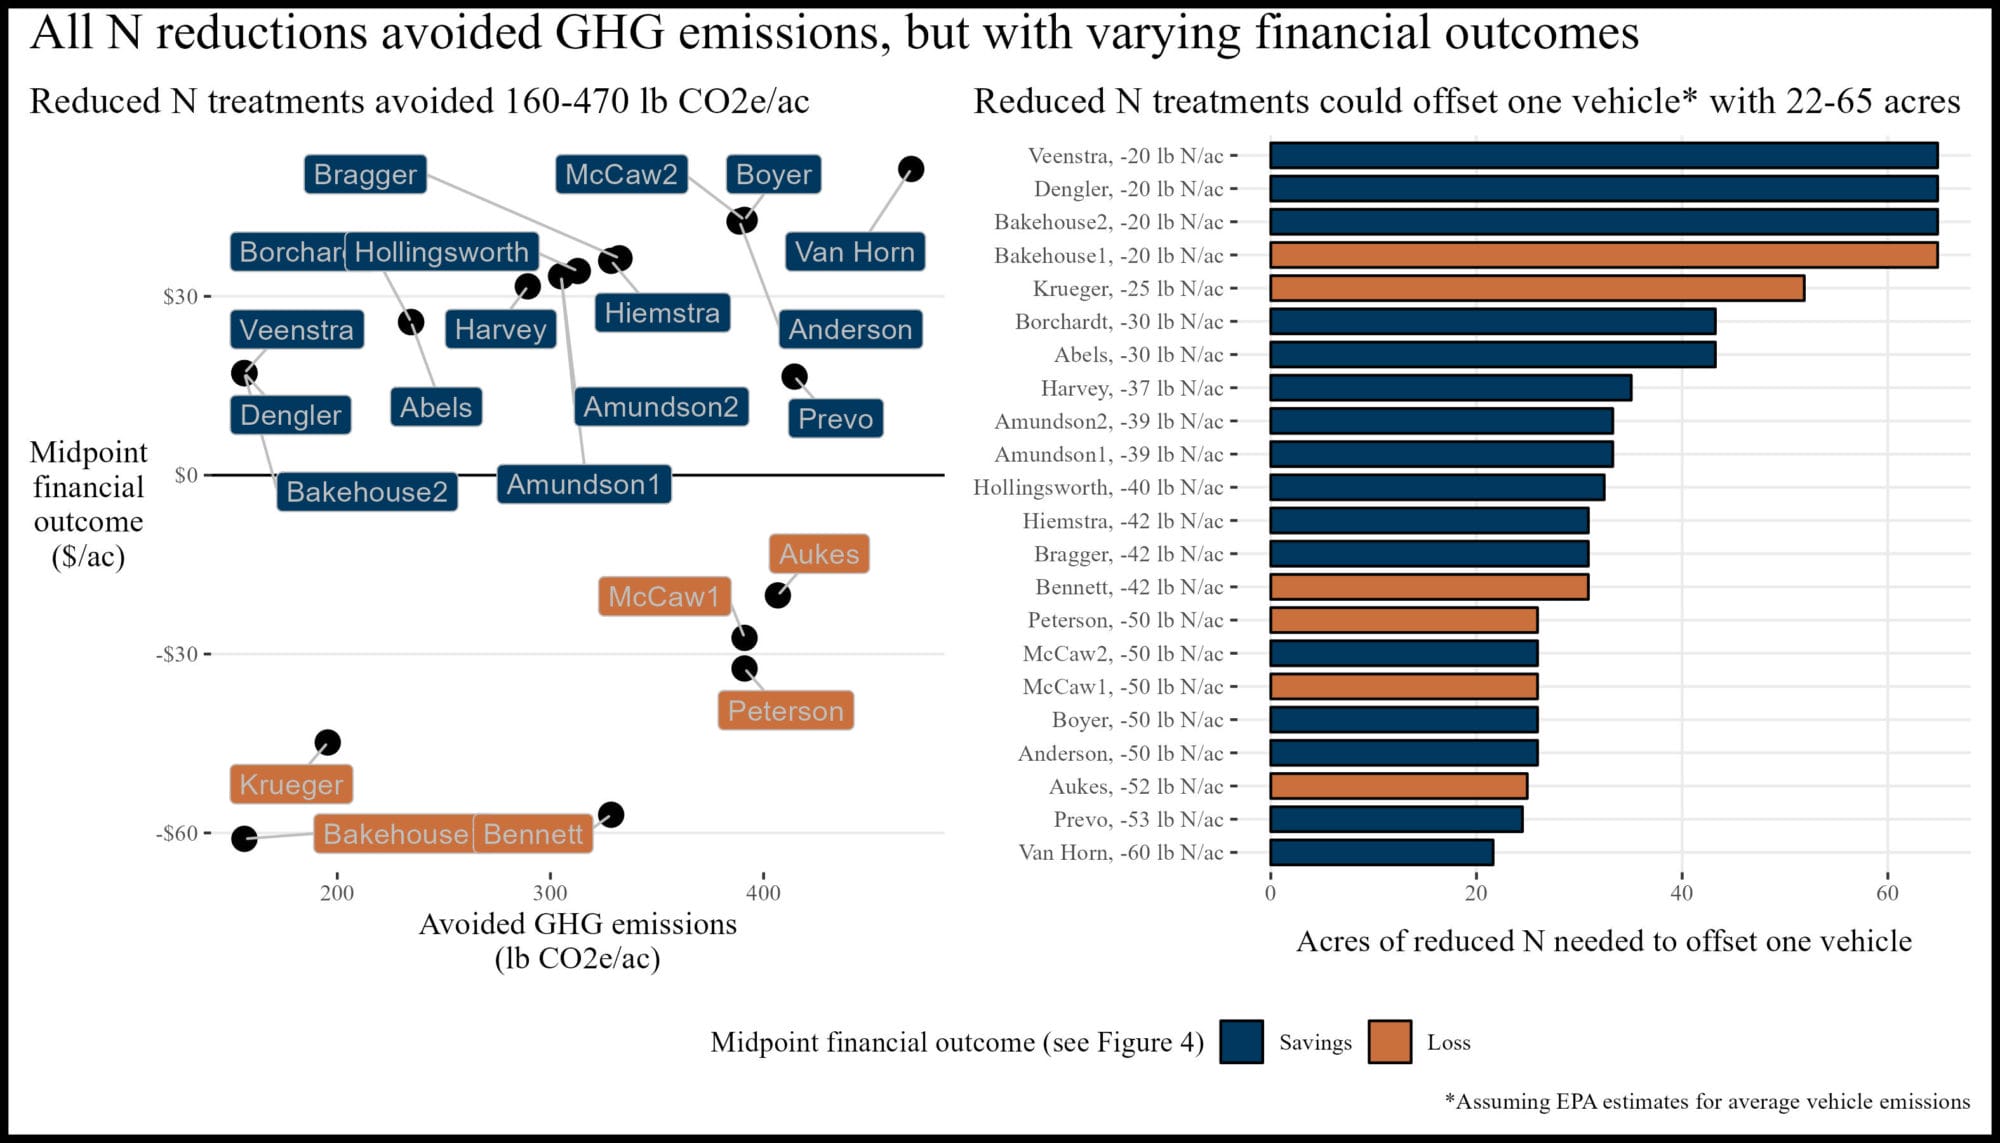
Of the 22 trials conducted, nineteen potentially saved money in the reduced N treatment (any part of bars above the zero line in the right panel of Figure 4). More specifically, 15 trials saved money under all three price scenarios; one trial saved money in two of the price scenarios; and three trials saved money only under the best-case price scenario. Three trials likely lost money in the reduced N treatment under all price scenarios. All trials avoided GHG emissions by reducing N fertilizer and 16 of the 22 trials could do so while also saving money under the mid-point price scenario (left panel of Figure 5). To offset the emissions of a single vehicle, those farmers would have to apply their reduced N rate to only 22–65 acres on their farms. That is a climate-smart win-win for farming and the environment. Most of the participating farmers remain motivated to continue conducting these trials to, as Alec Amundson put it, “continue to fine tune N rates.” The project has also gained the attention of other farmers who wish to join the effort in coming years. All signs point to more farmers putting their soils to the test by reducing N fertilizer applications in the interest of improved finances and environmental quality.
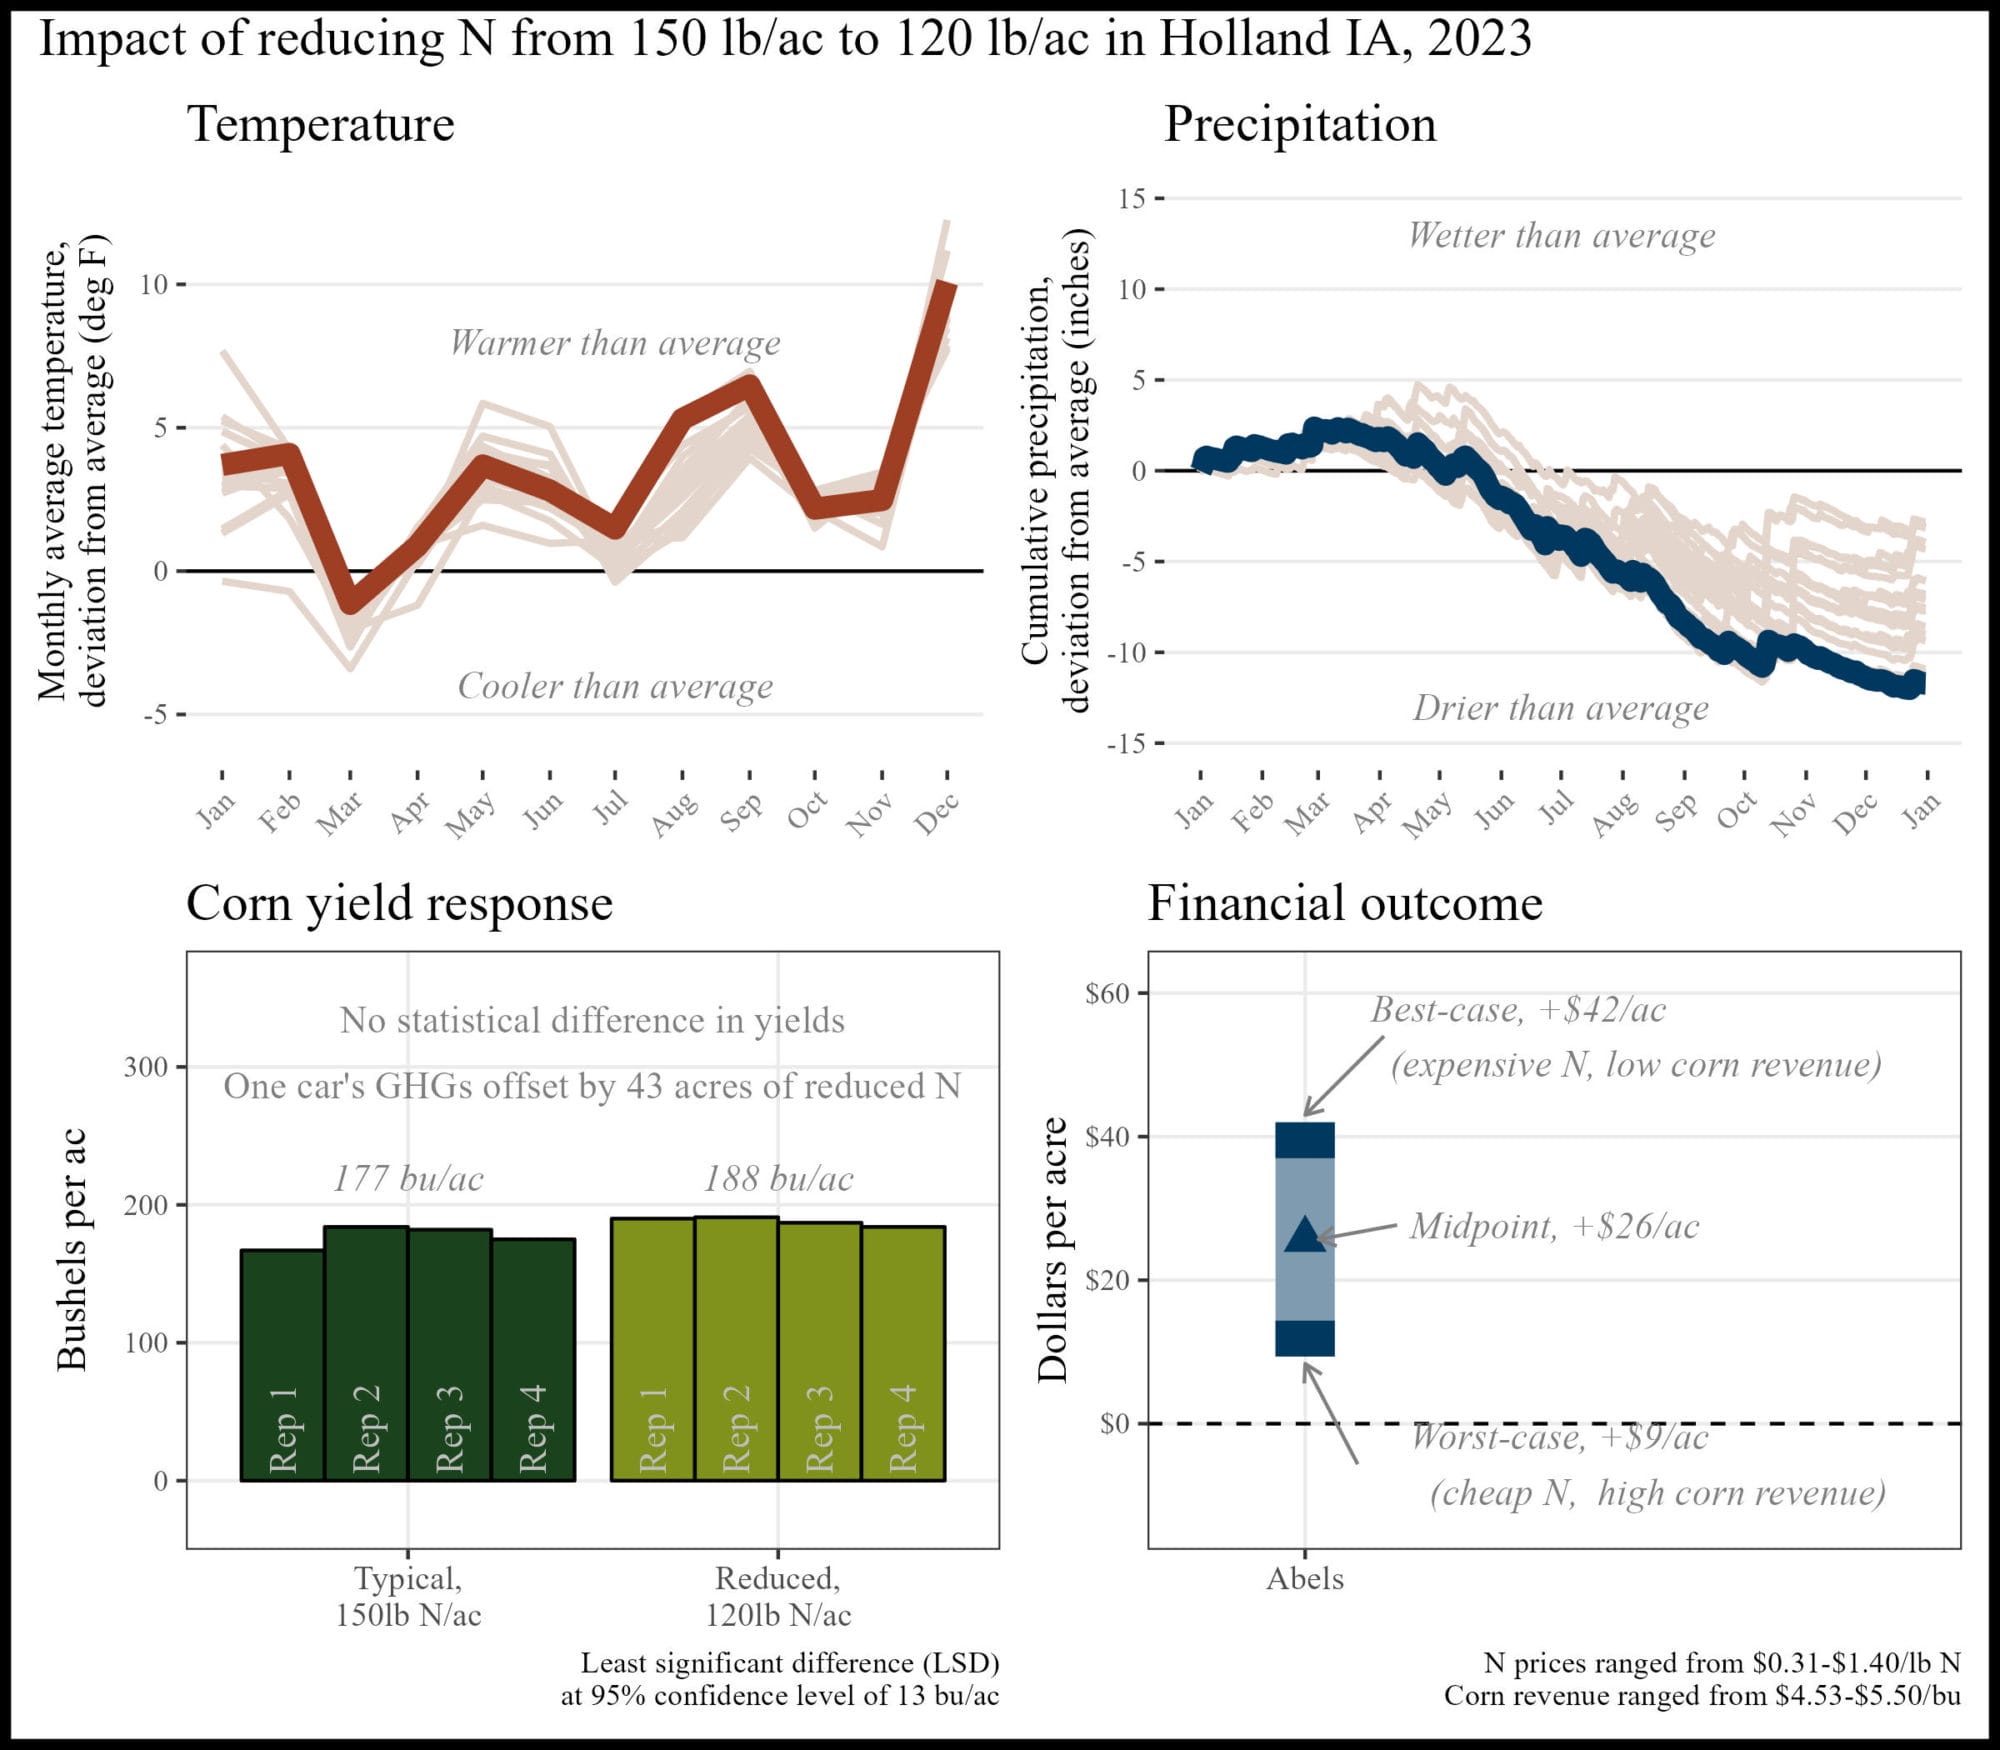
Appendix A. Fred Abels; Holland, IA
The financial outcome at the reduced N rate was likely a financial savings compared to the typical N rate. A 30 lb N/ac reduction saved money this year, and, when applied to at least 43 acres, could offset the average annual GHGs of one vehicle.
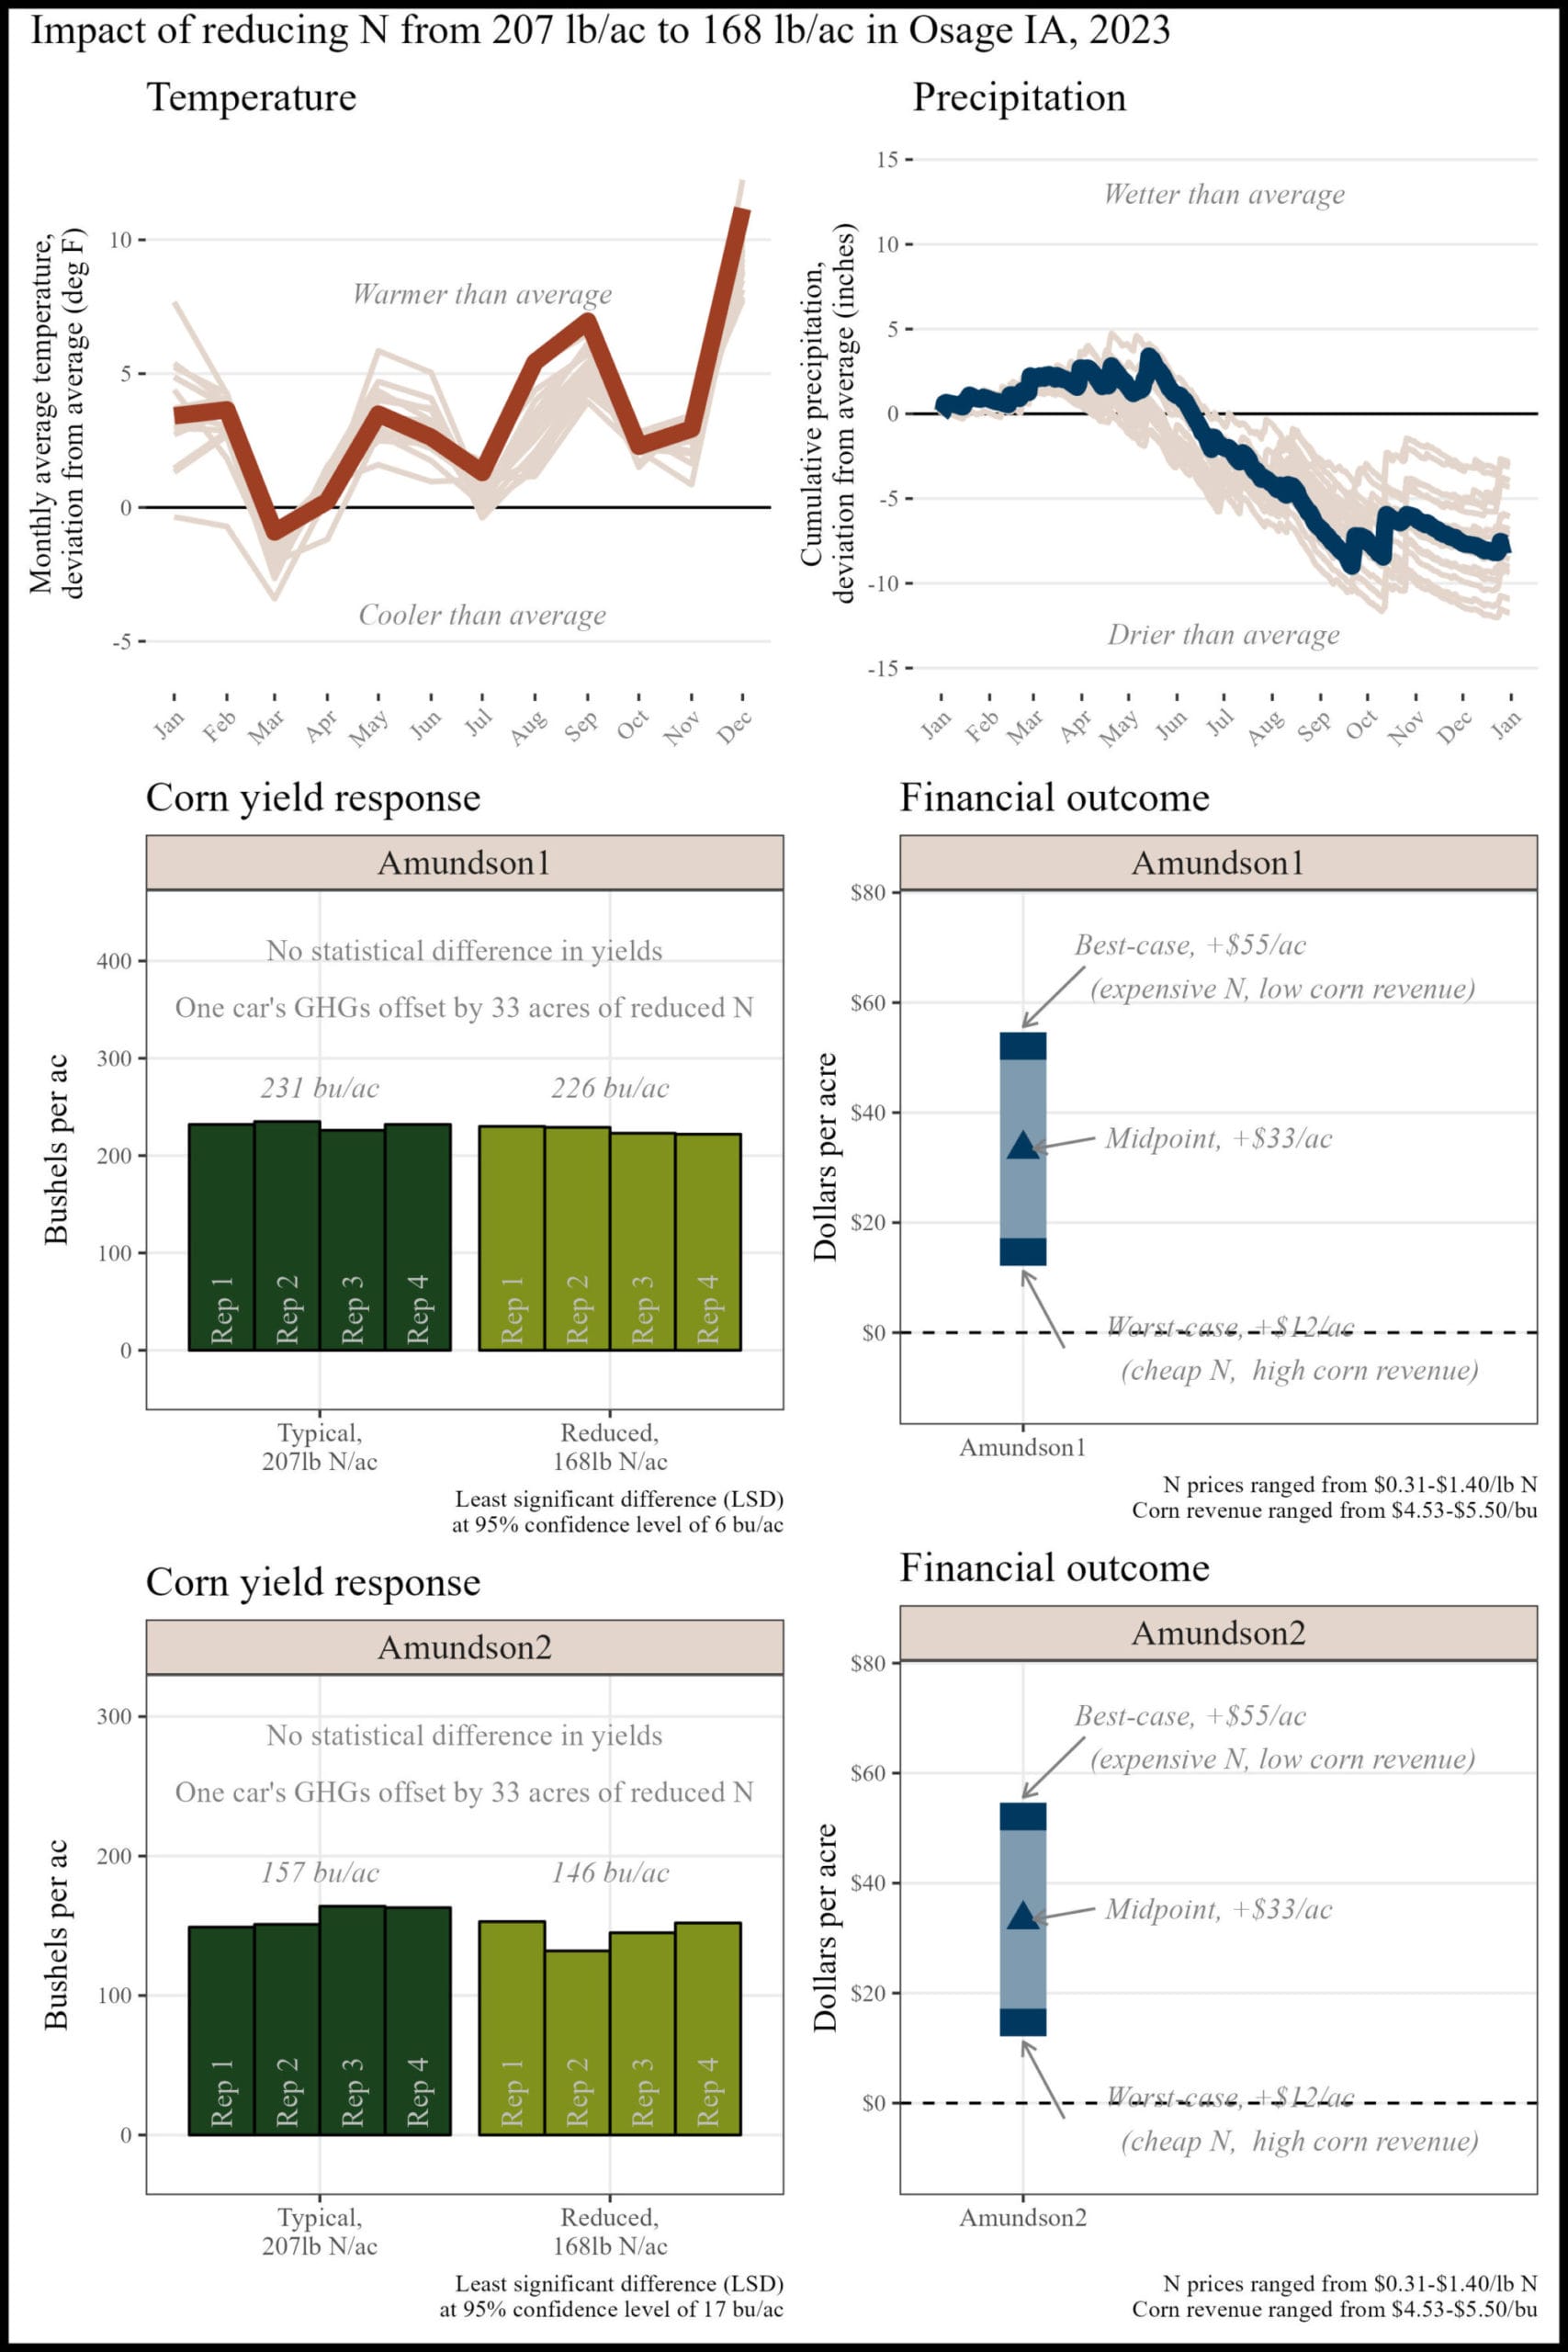
Appendix B. Alec and Rachel Amundson; Osage, IA
“We continue to look at crop rotation and the benefits of small grains and legume covers.”
The financial outcome at the reduced N rate in both fields was likely a financial savings compared to the typical N rate. A 39 lb N/ac reduction saved money this year, and, when applied to at least 33 acres, could offset the average annual GHGs of one vehicle.
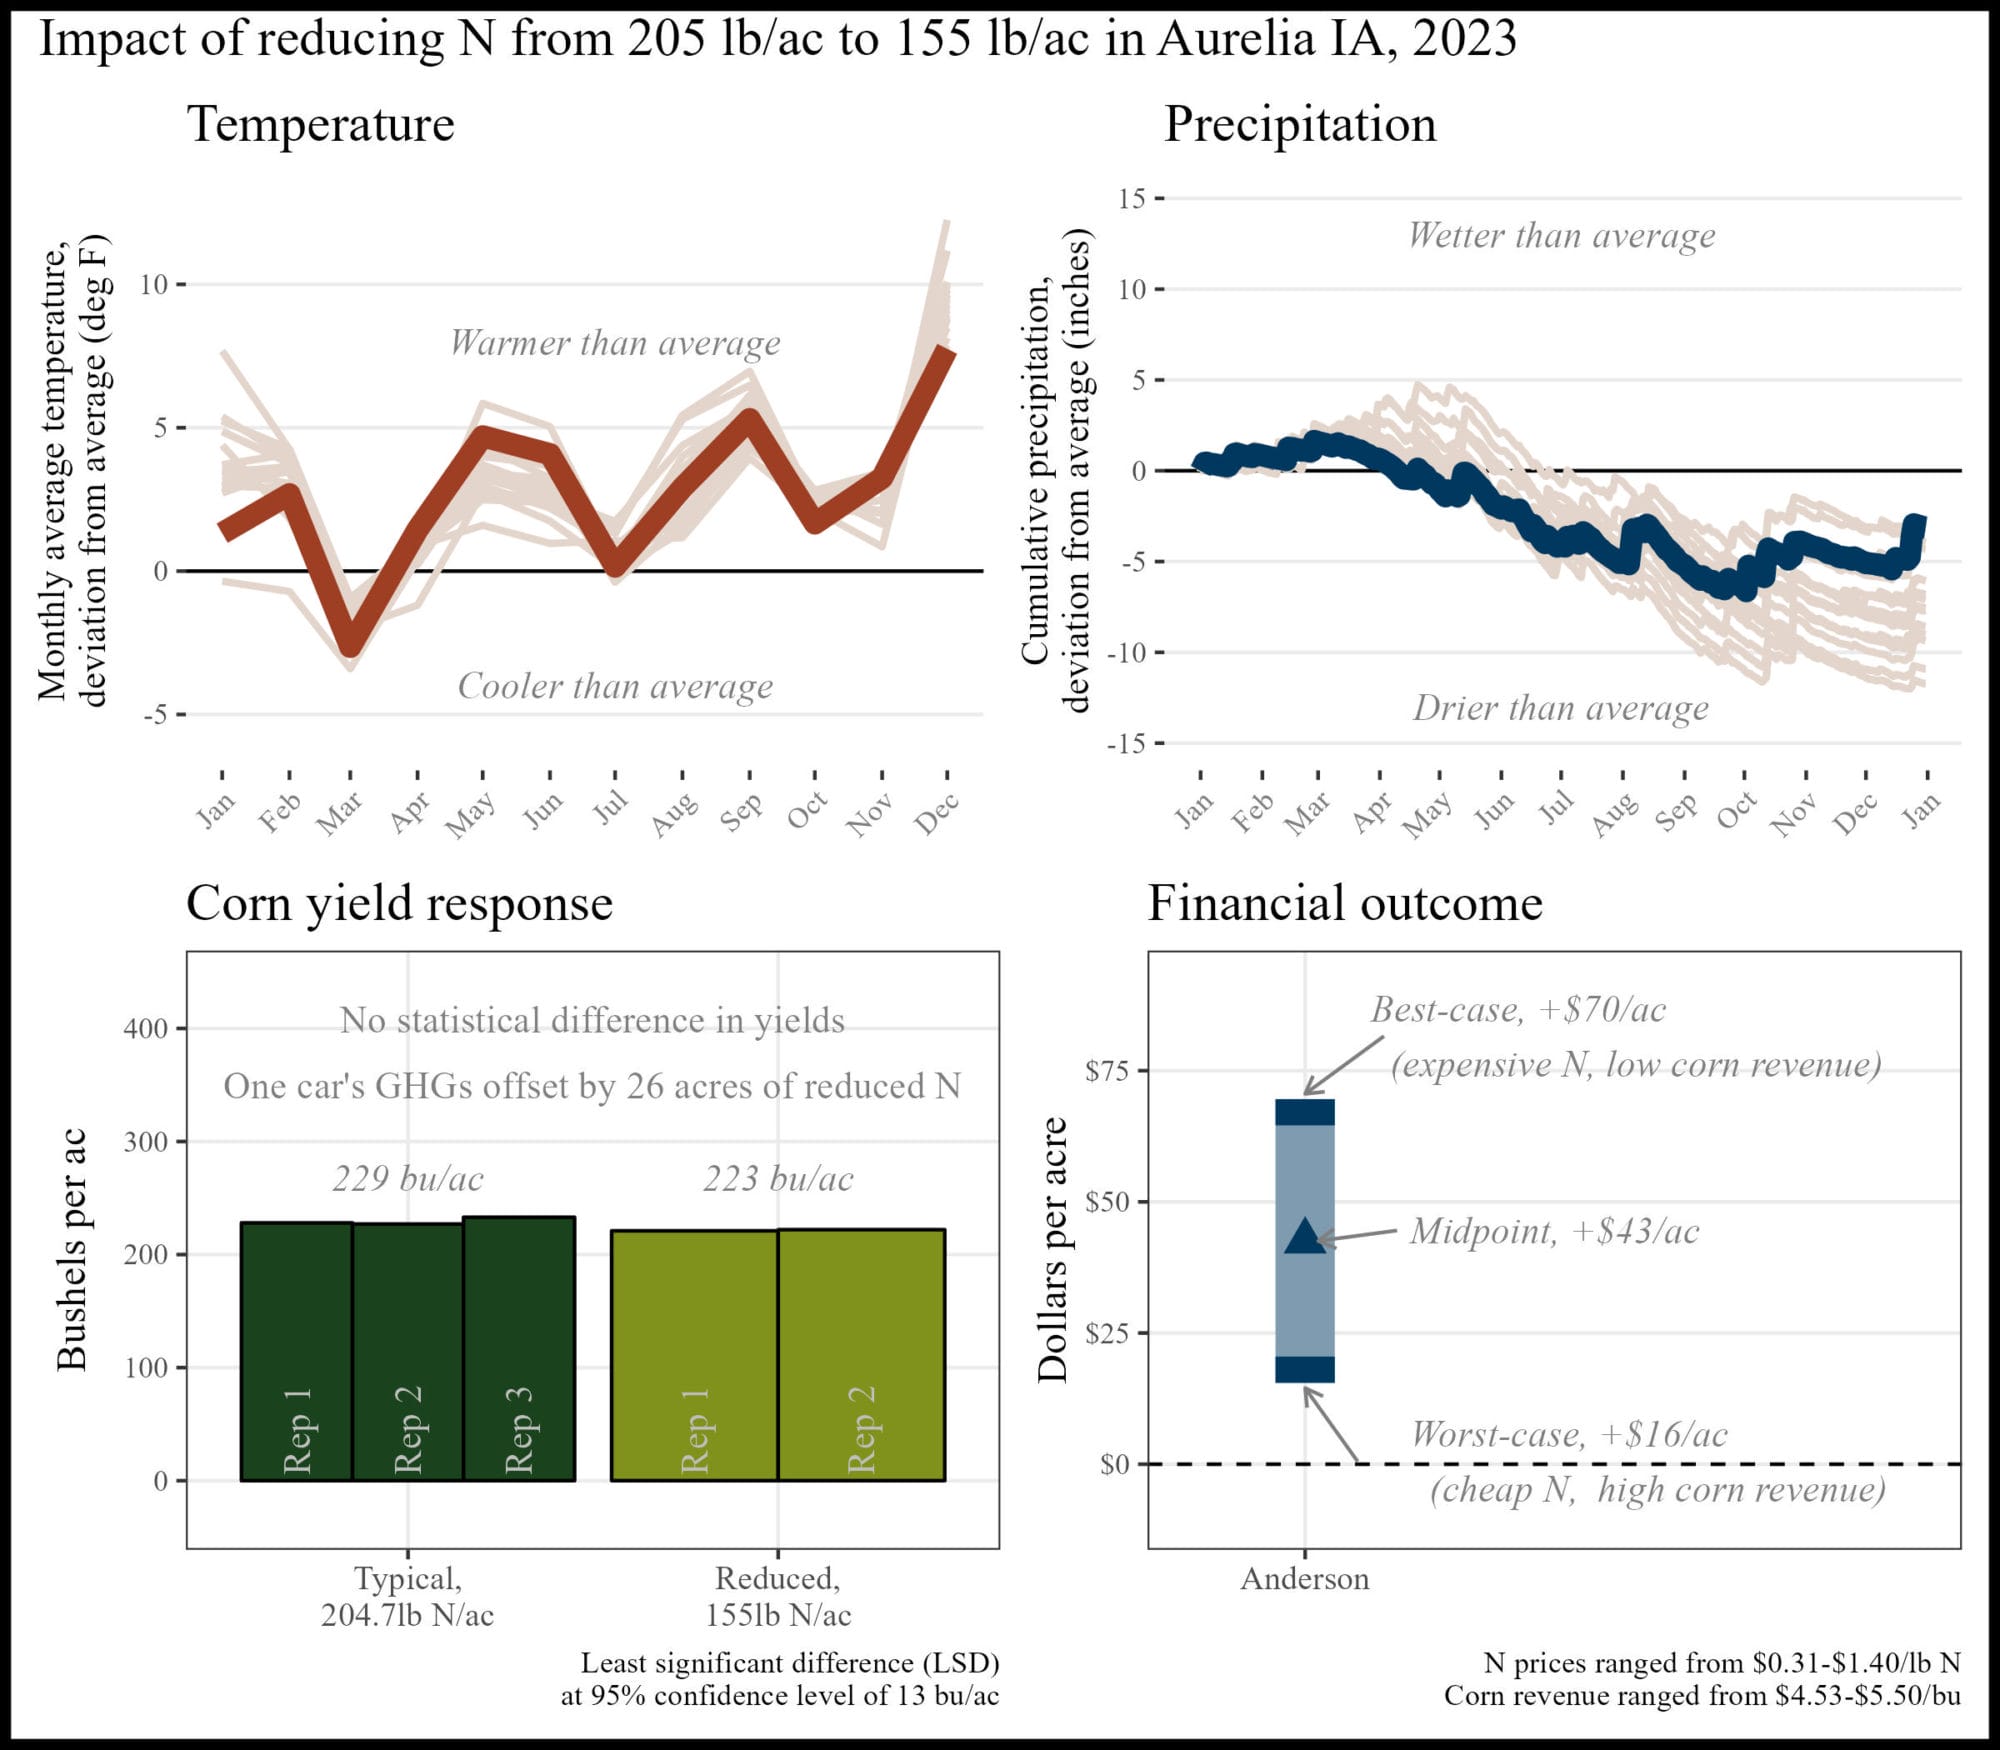
Appendix C. Nathan Anderson; Aurelia, IA
“Dry conditions + above average N costs = negative return on investment for additional N applied.”
The financial outcome at the reduced N rate was likely a financial savings compared to the typical N rate. A 50 lb N/ac reduction saved money this year, and, when applied to at least 26 acres, could offset the average annual GHGs of one vehicle.
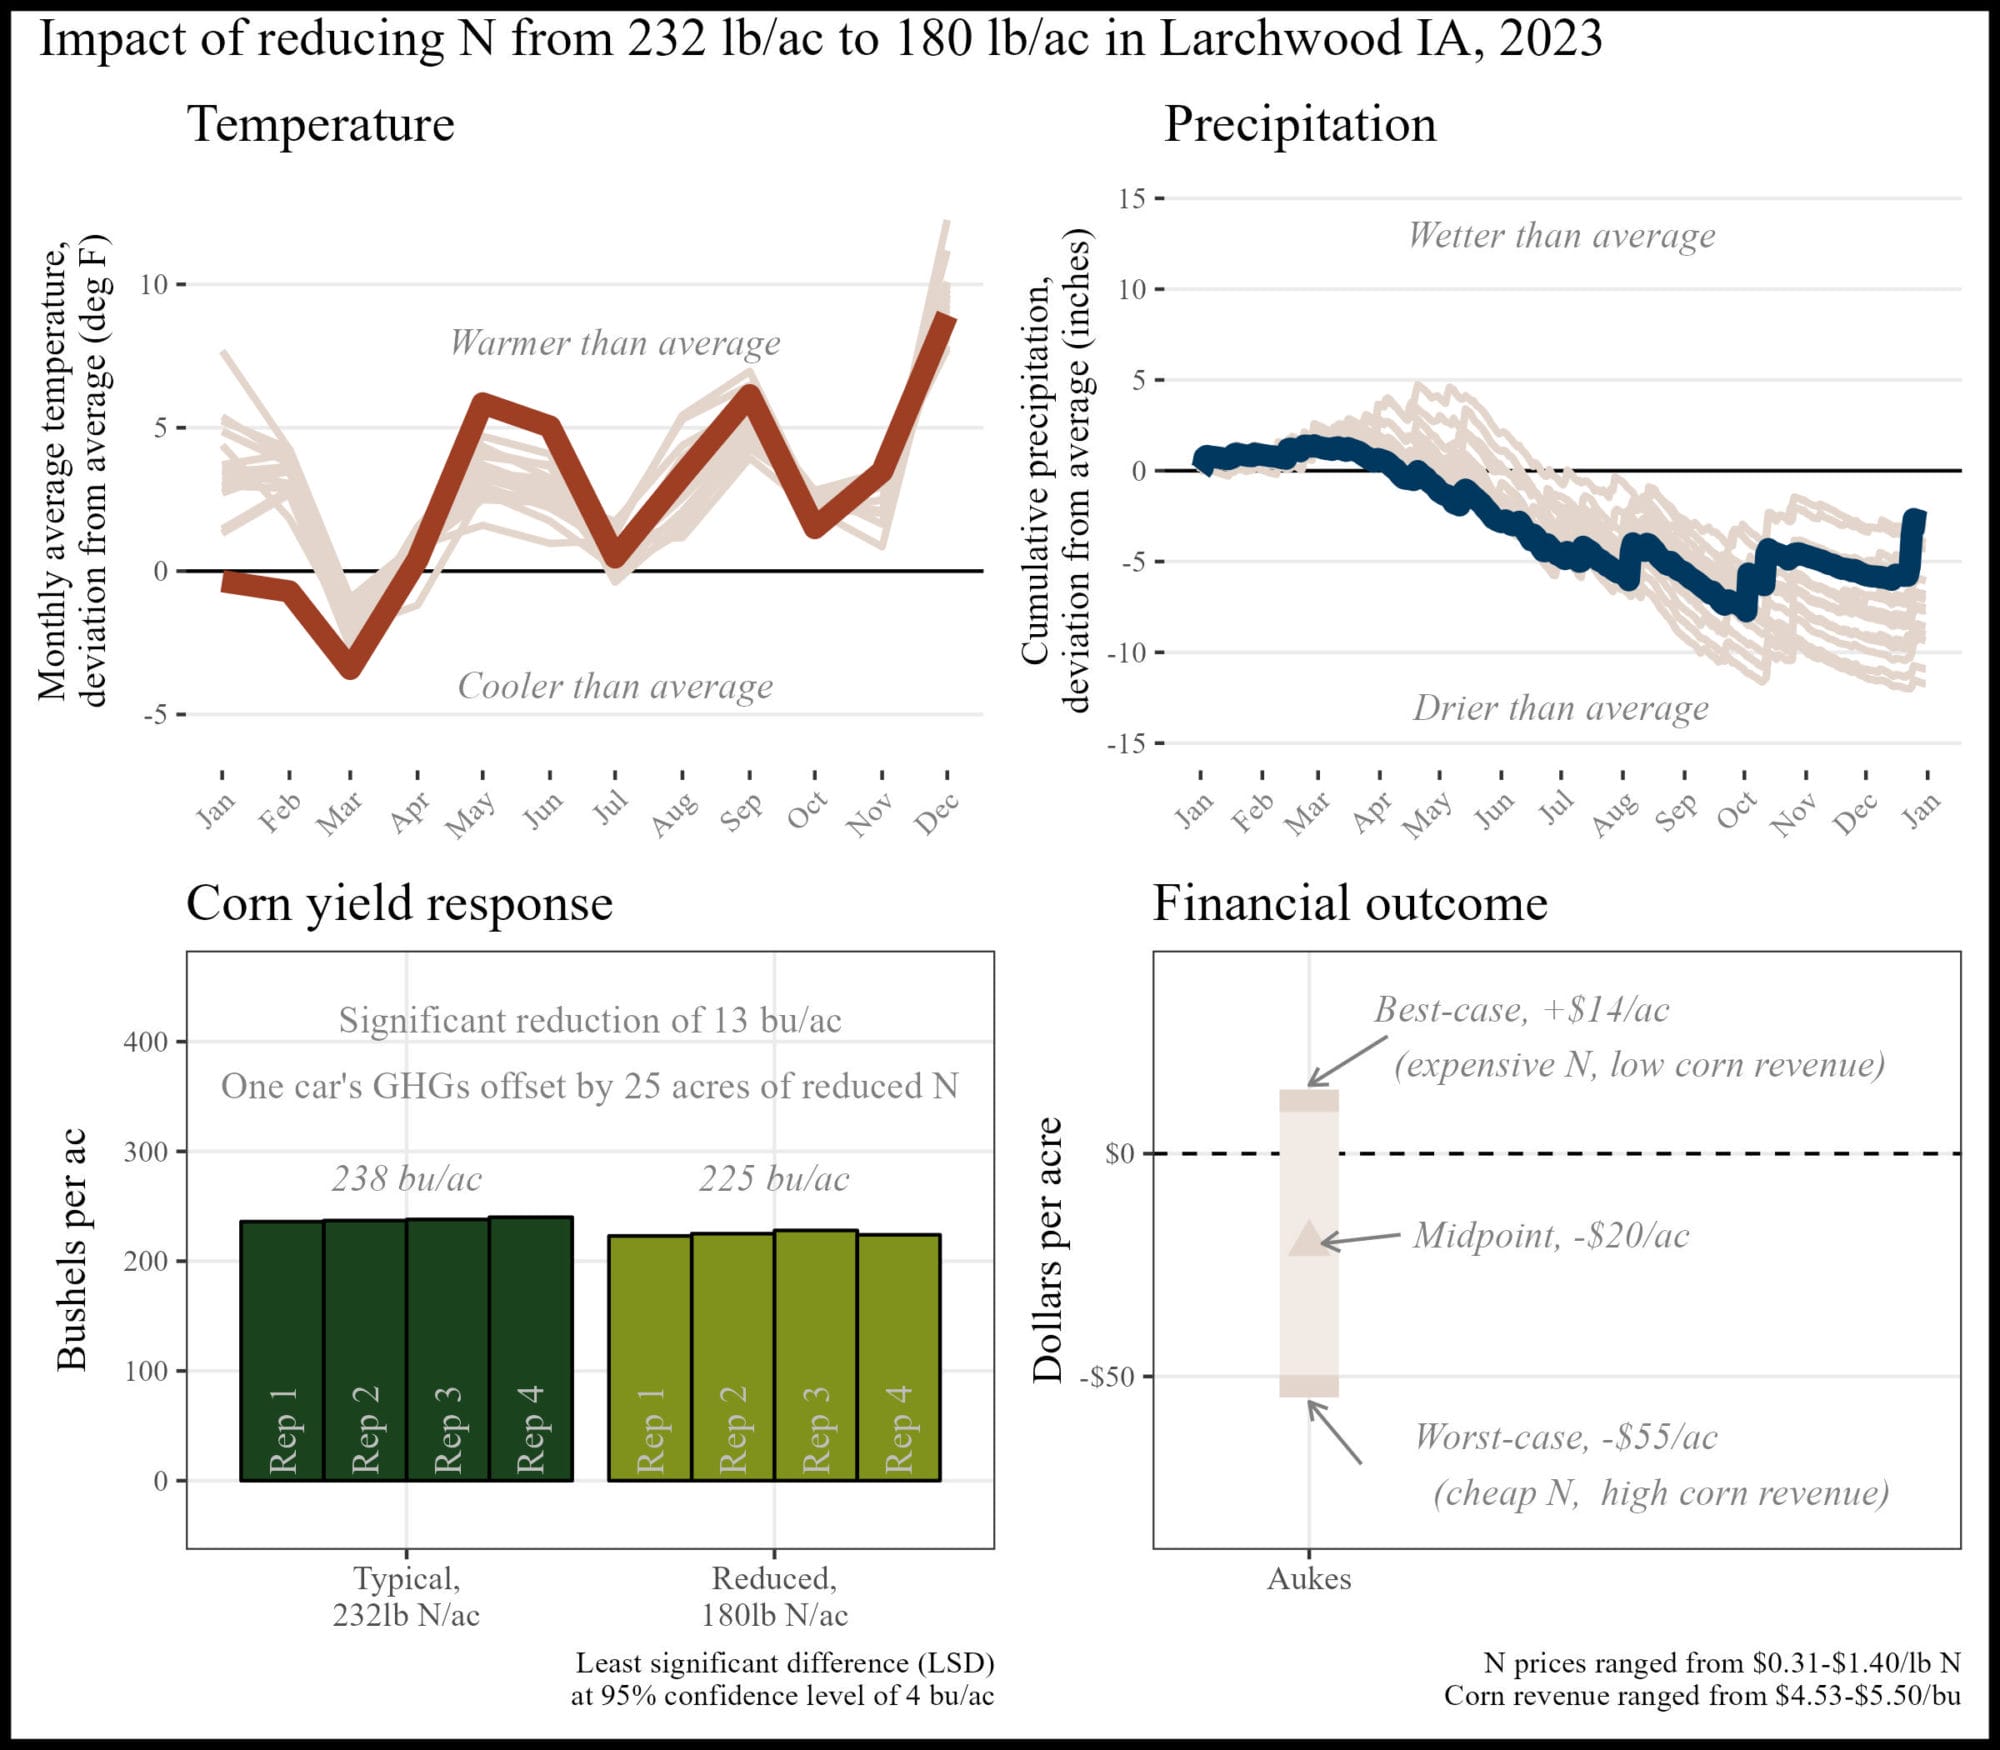
Appendix D. Terry Aukes; Larchwood, IA
The financial outcome at the reduced N rate was likely a financial loss compared to the typical N rate. A 52 lb N/ac reduction was likely too large this year, but there may be potential for financial savings with a smaller N reduction.
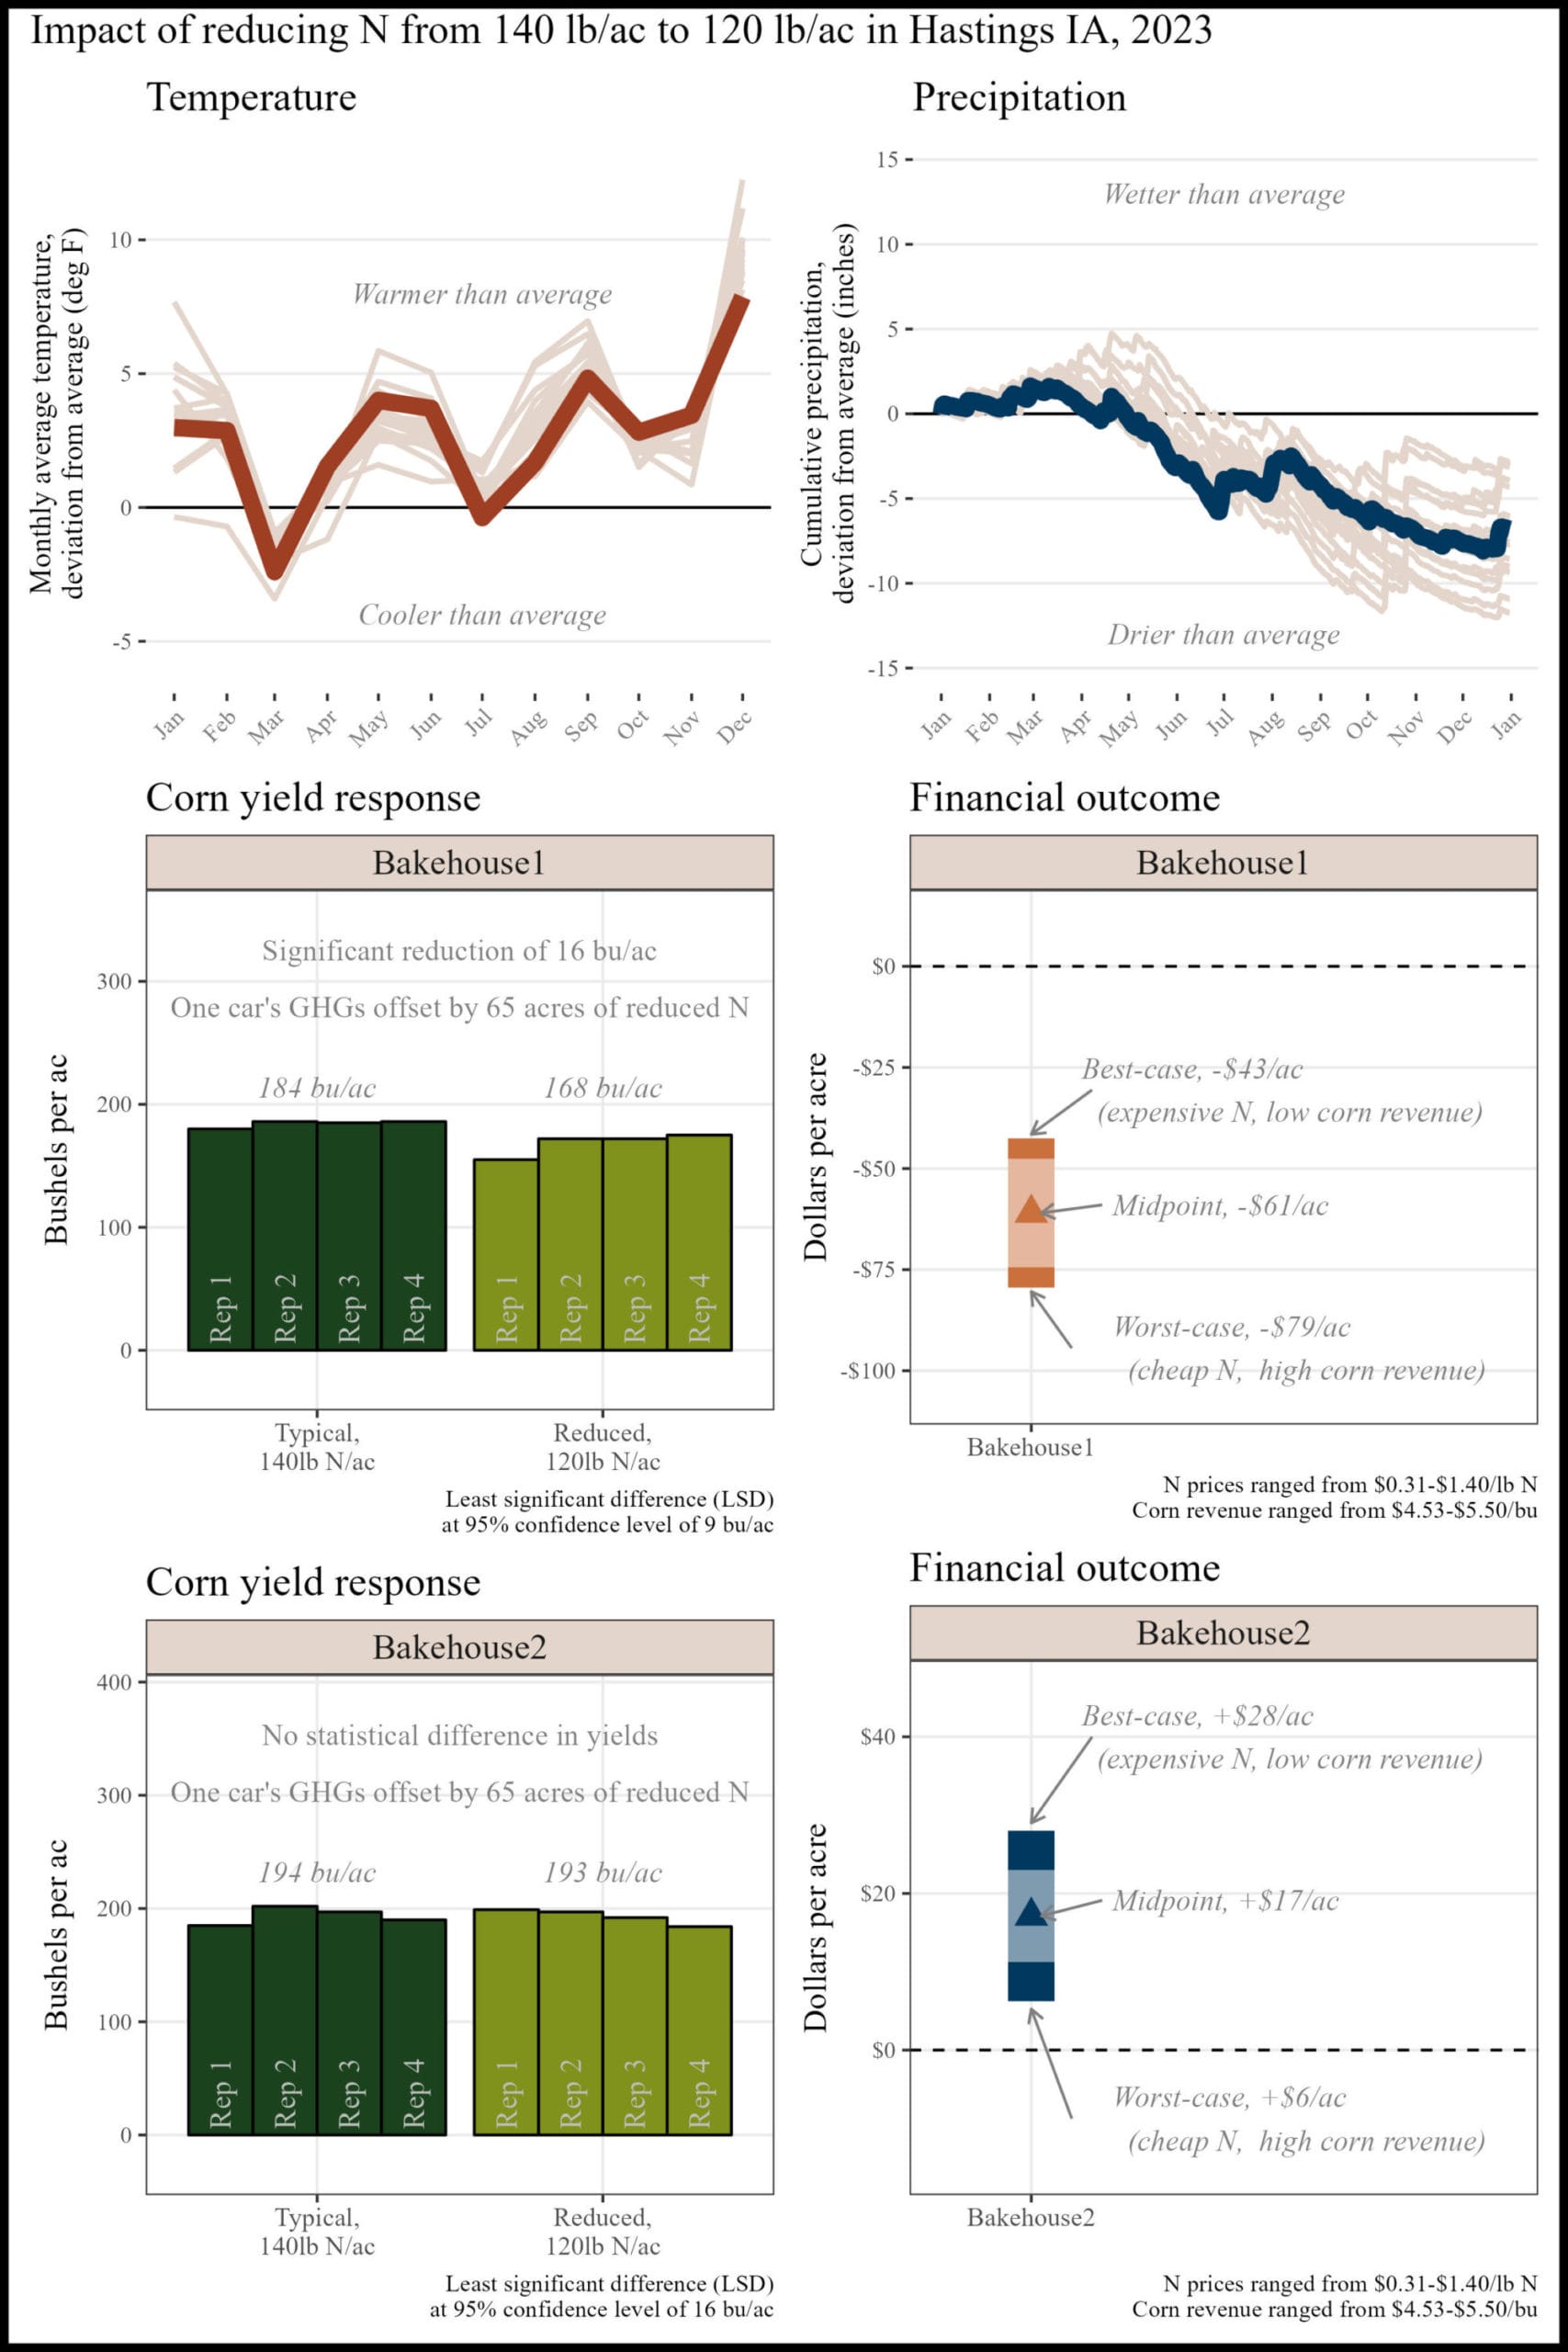
Appendix E. Jon Bakehouse; Hastings, IA
“Analyzing two sections of the same field separately really shed light on how N can make a larger difference in tougher soils. Also, good grief, 193 bu/ac on 120 lbs of applied N? Wow.”
In field 1, the financial outcome at the reduced N rate was likely a financial loss.
In field 2, the financial outcome at the reduced N rate was likely a financial savings compared to the typical N rate. A 20 lb N/ac reduction saved money this year, and, when applied to at least 65 acres, could offset the average annual GHGs of one vehicle.
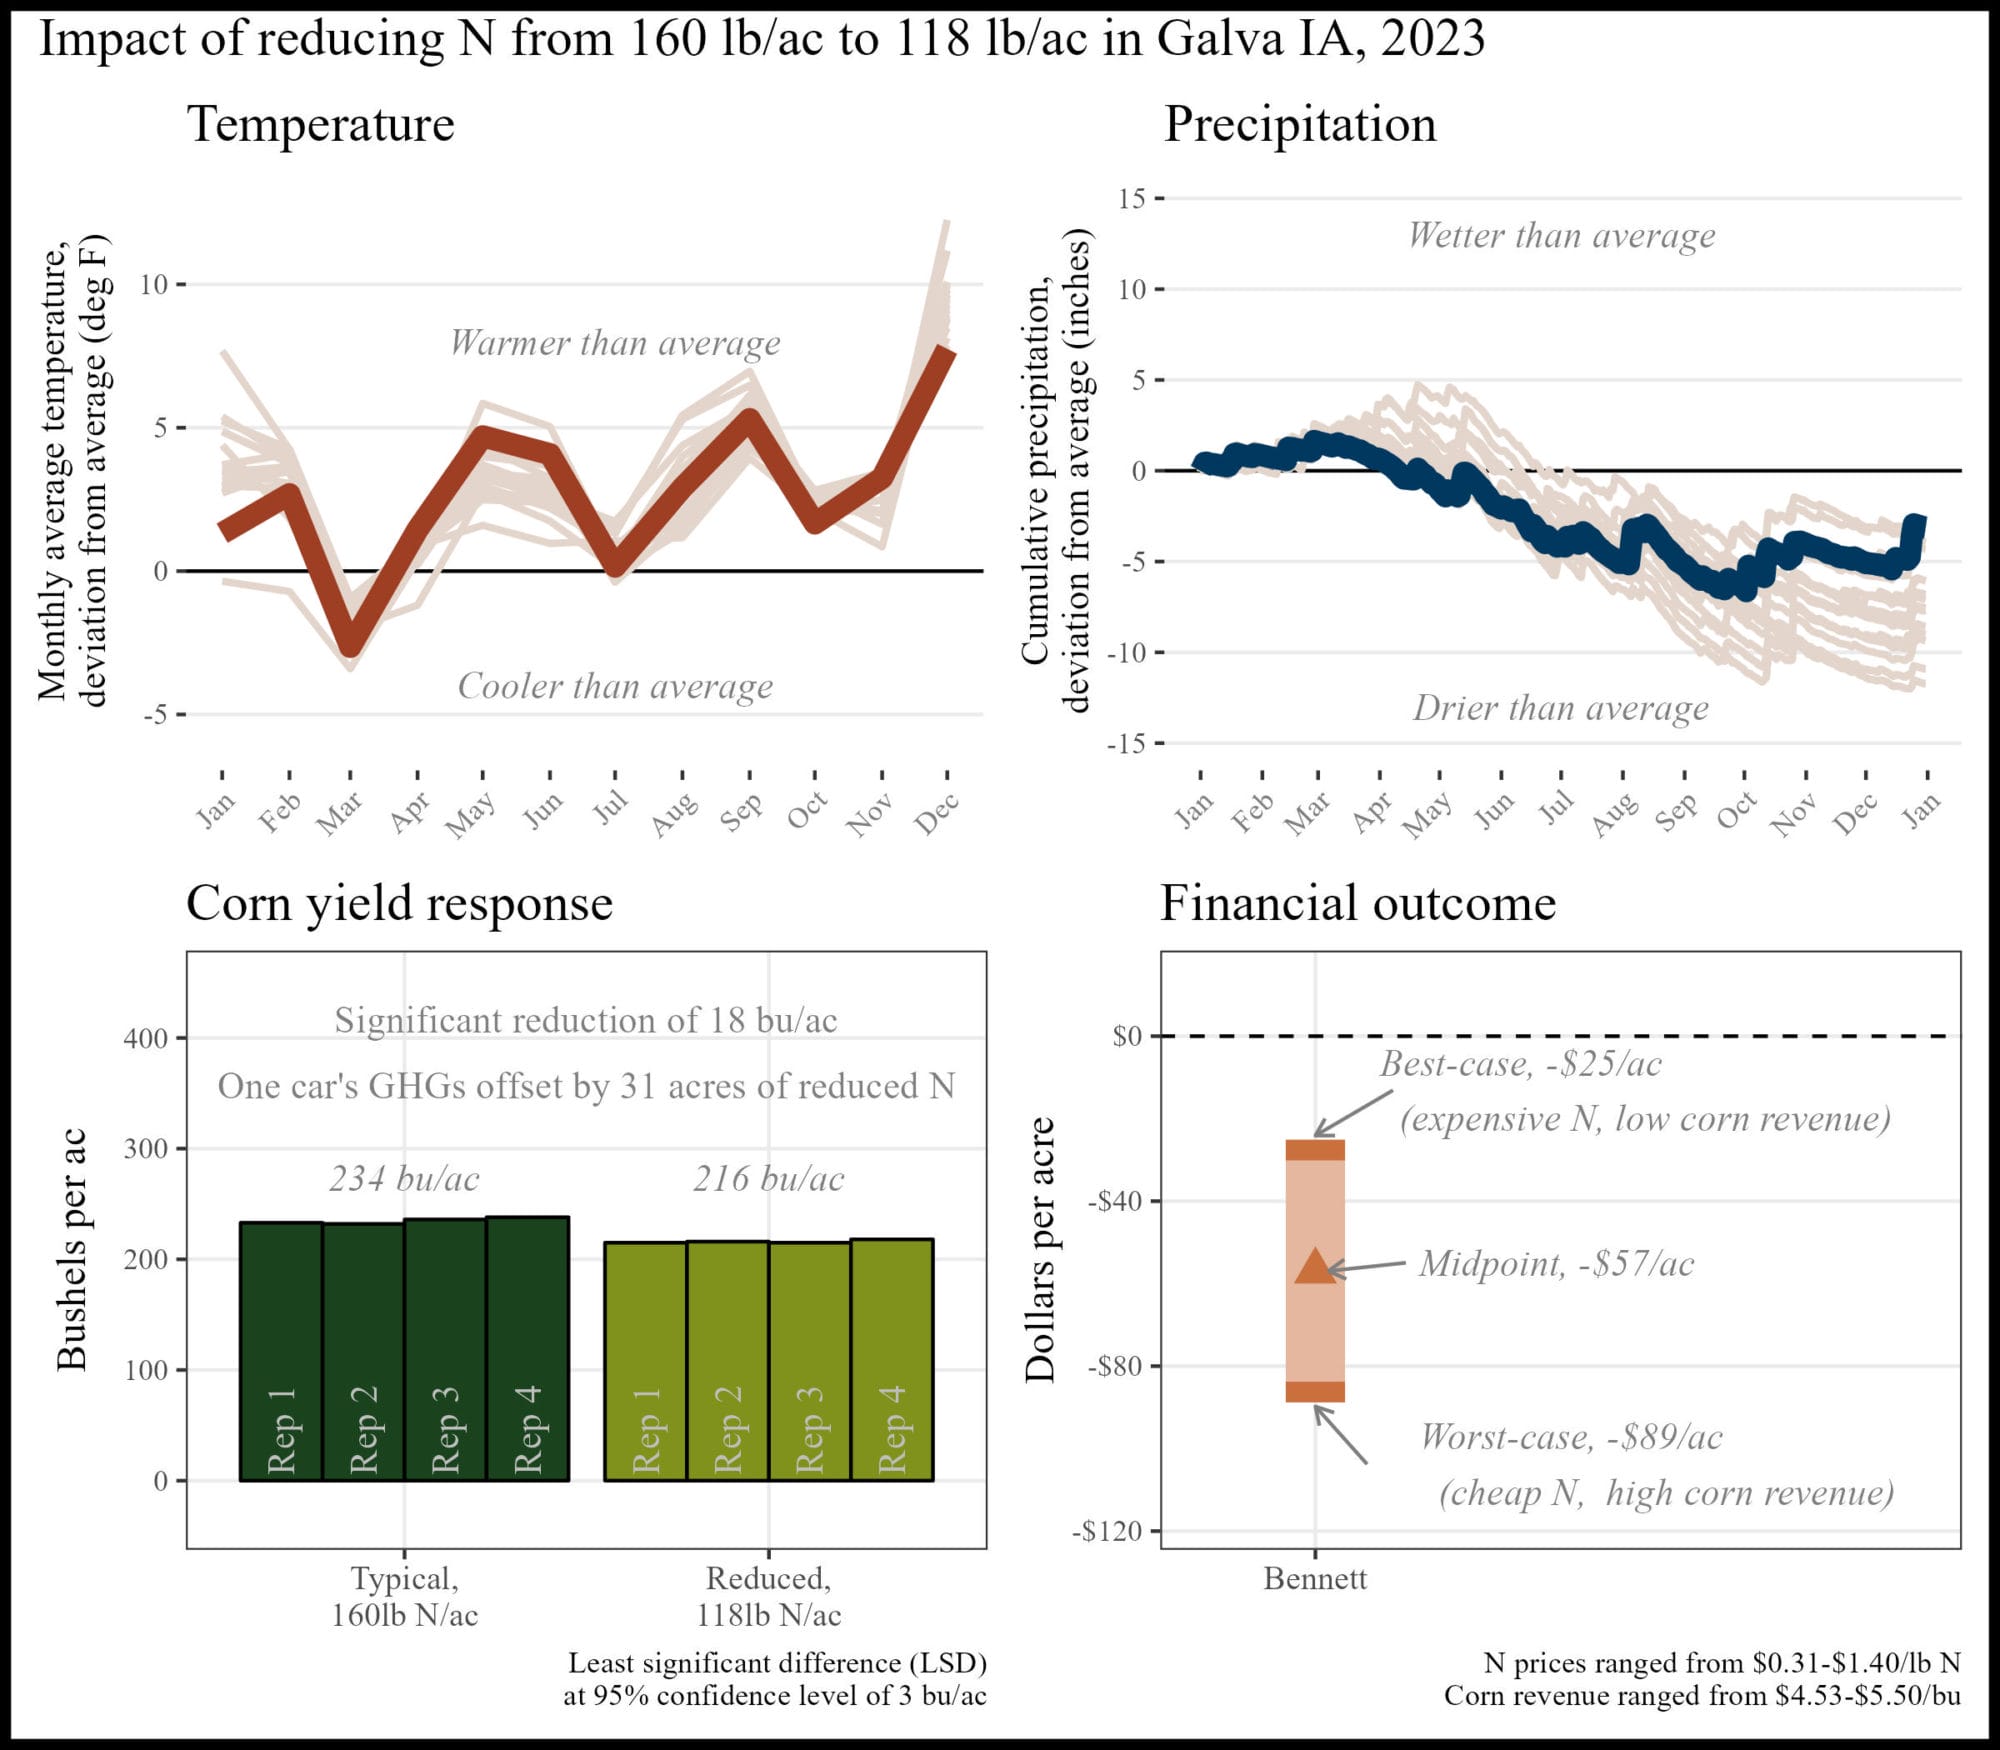
Appendix F. Sam Bennett; Galva, IA
“Opposite results from last year’s trial, so made it clear that we need multiple years of data to dial in a better rate.”
The financial outcome at the reduced N rate was likely a financial loss compared to the typical N rate. A 42 lb N/ac reduction was likely too large this year.
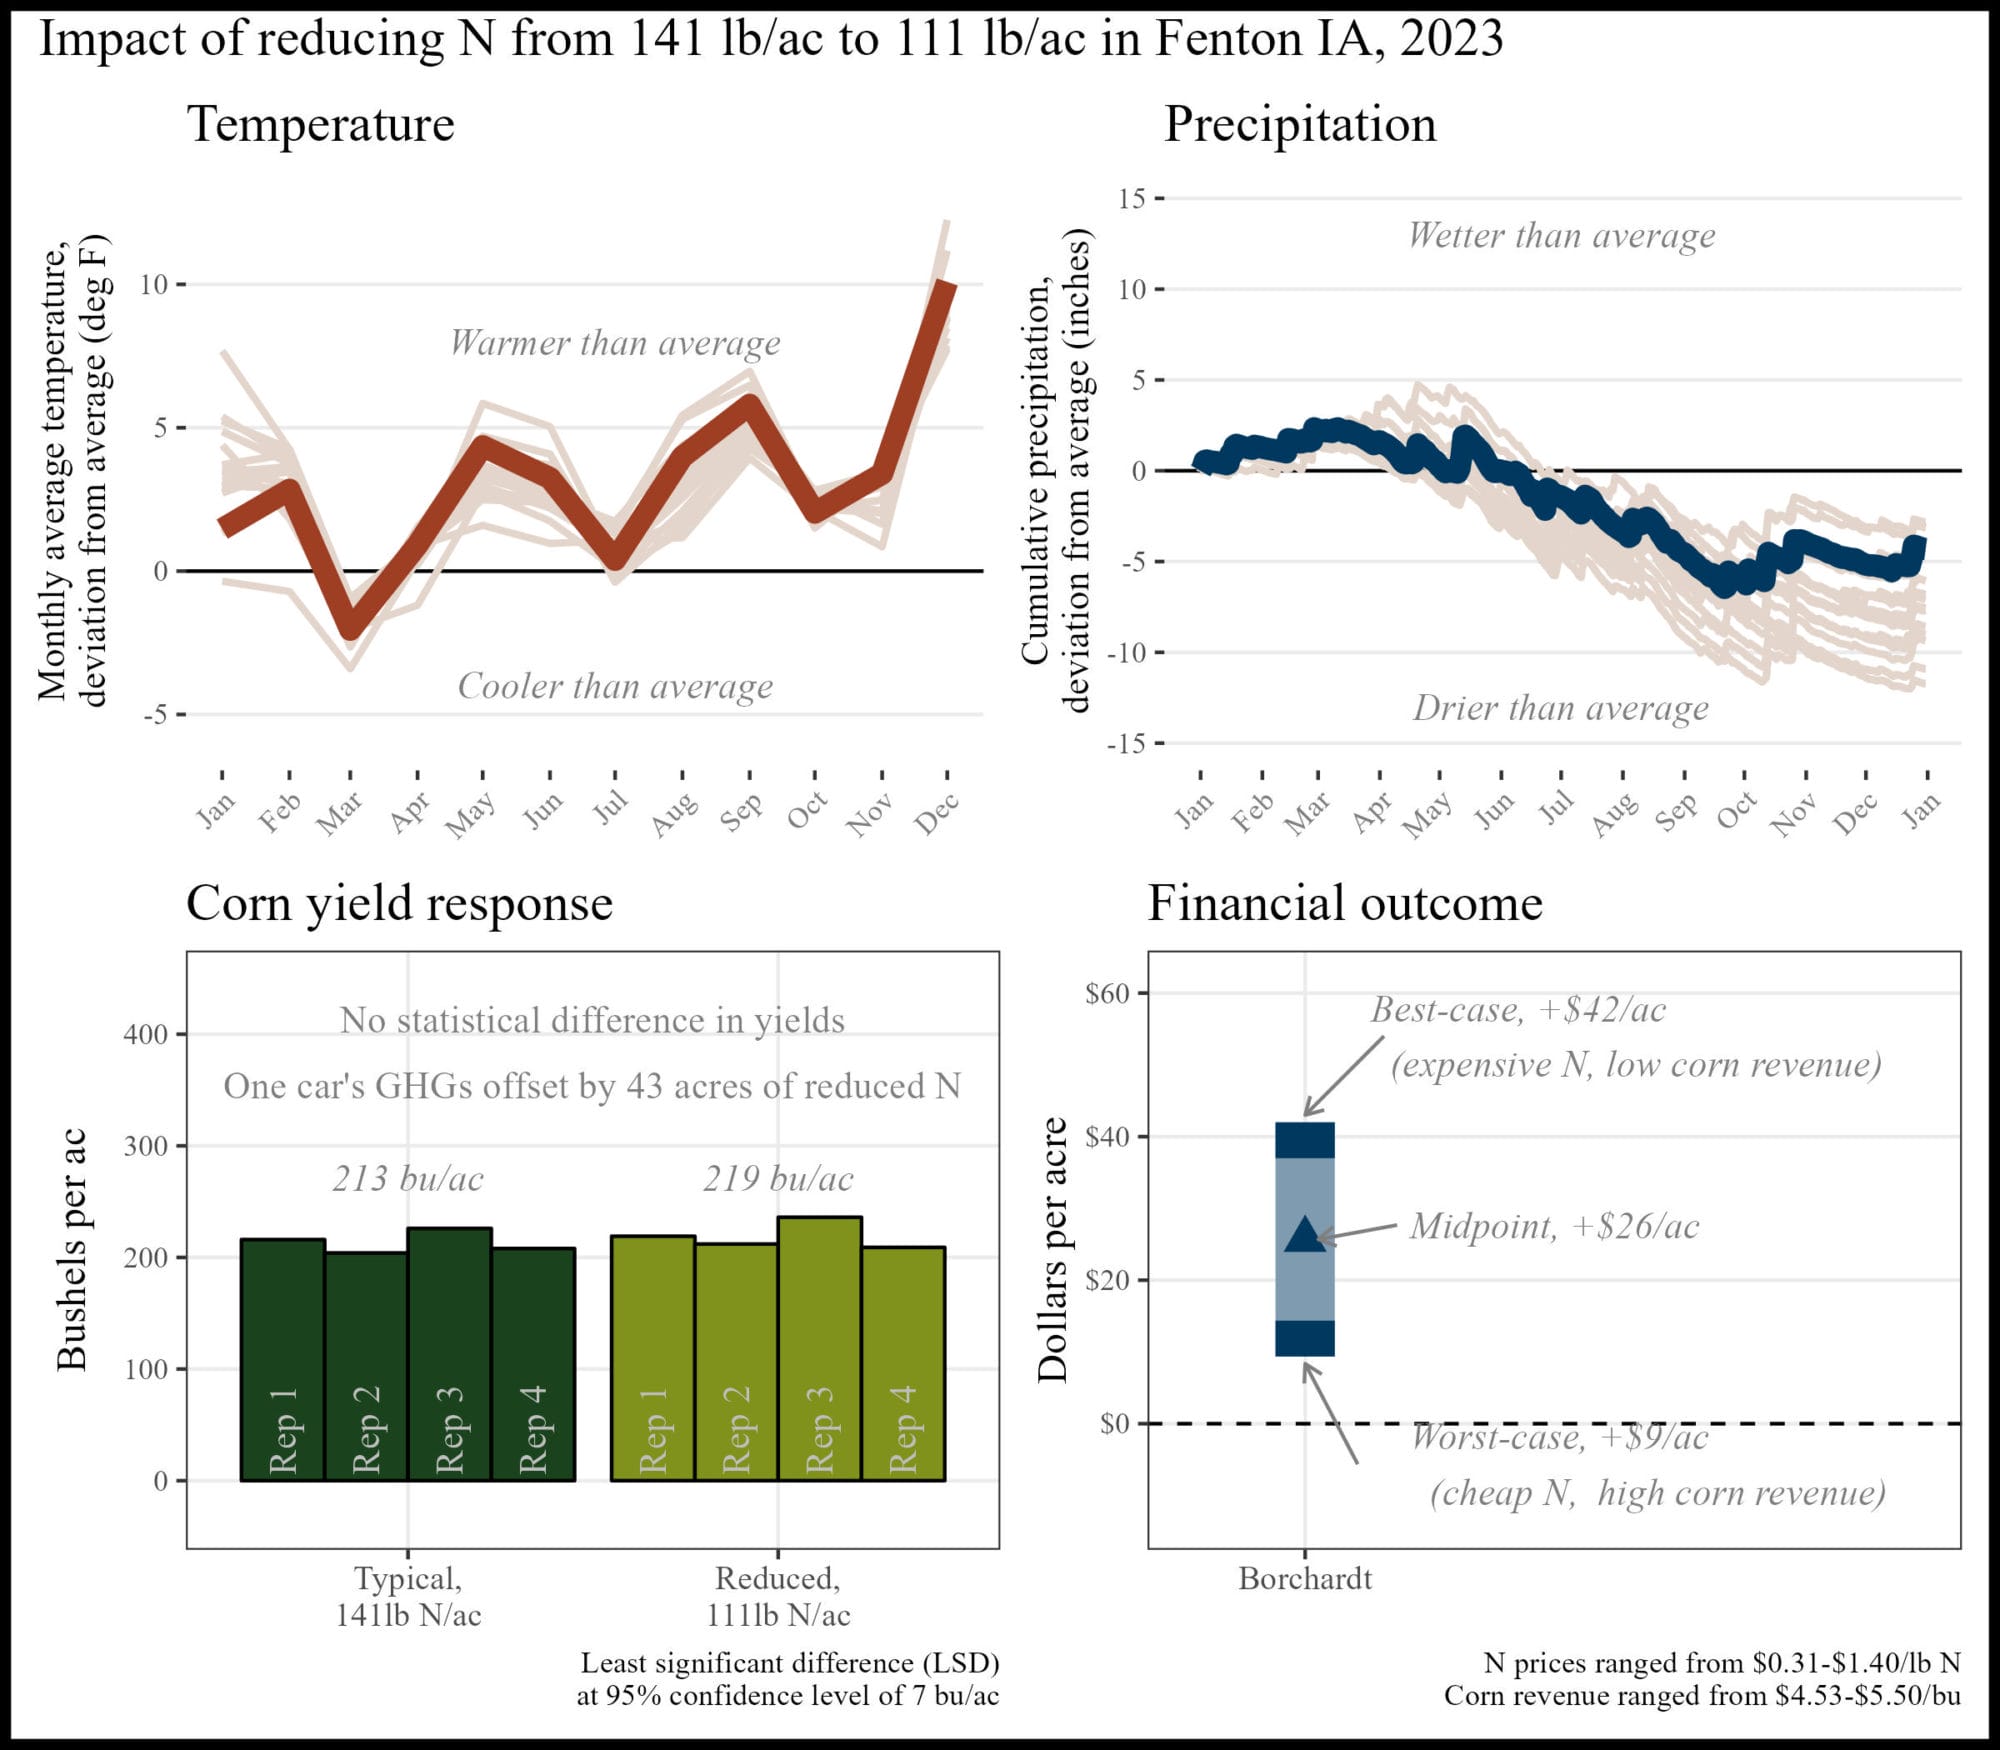
Appendix G. Vaughn Borchardt; Fenton, IA
“Will not go above 140 lb N/ac but not comfortable with less than 100 lb N/ac.”
The financial outcome at the reduced N rate was likely a financial savings compared to the typical N rate. A 30 lb N/ac reduction saved money this year, and, when applied to at least 43 acres, could offset the average annual GHGs of one vehicle.
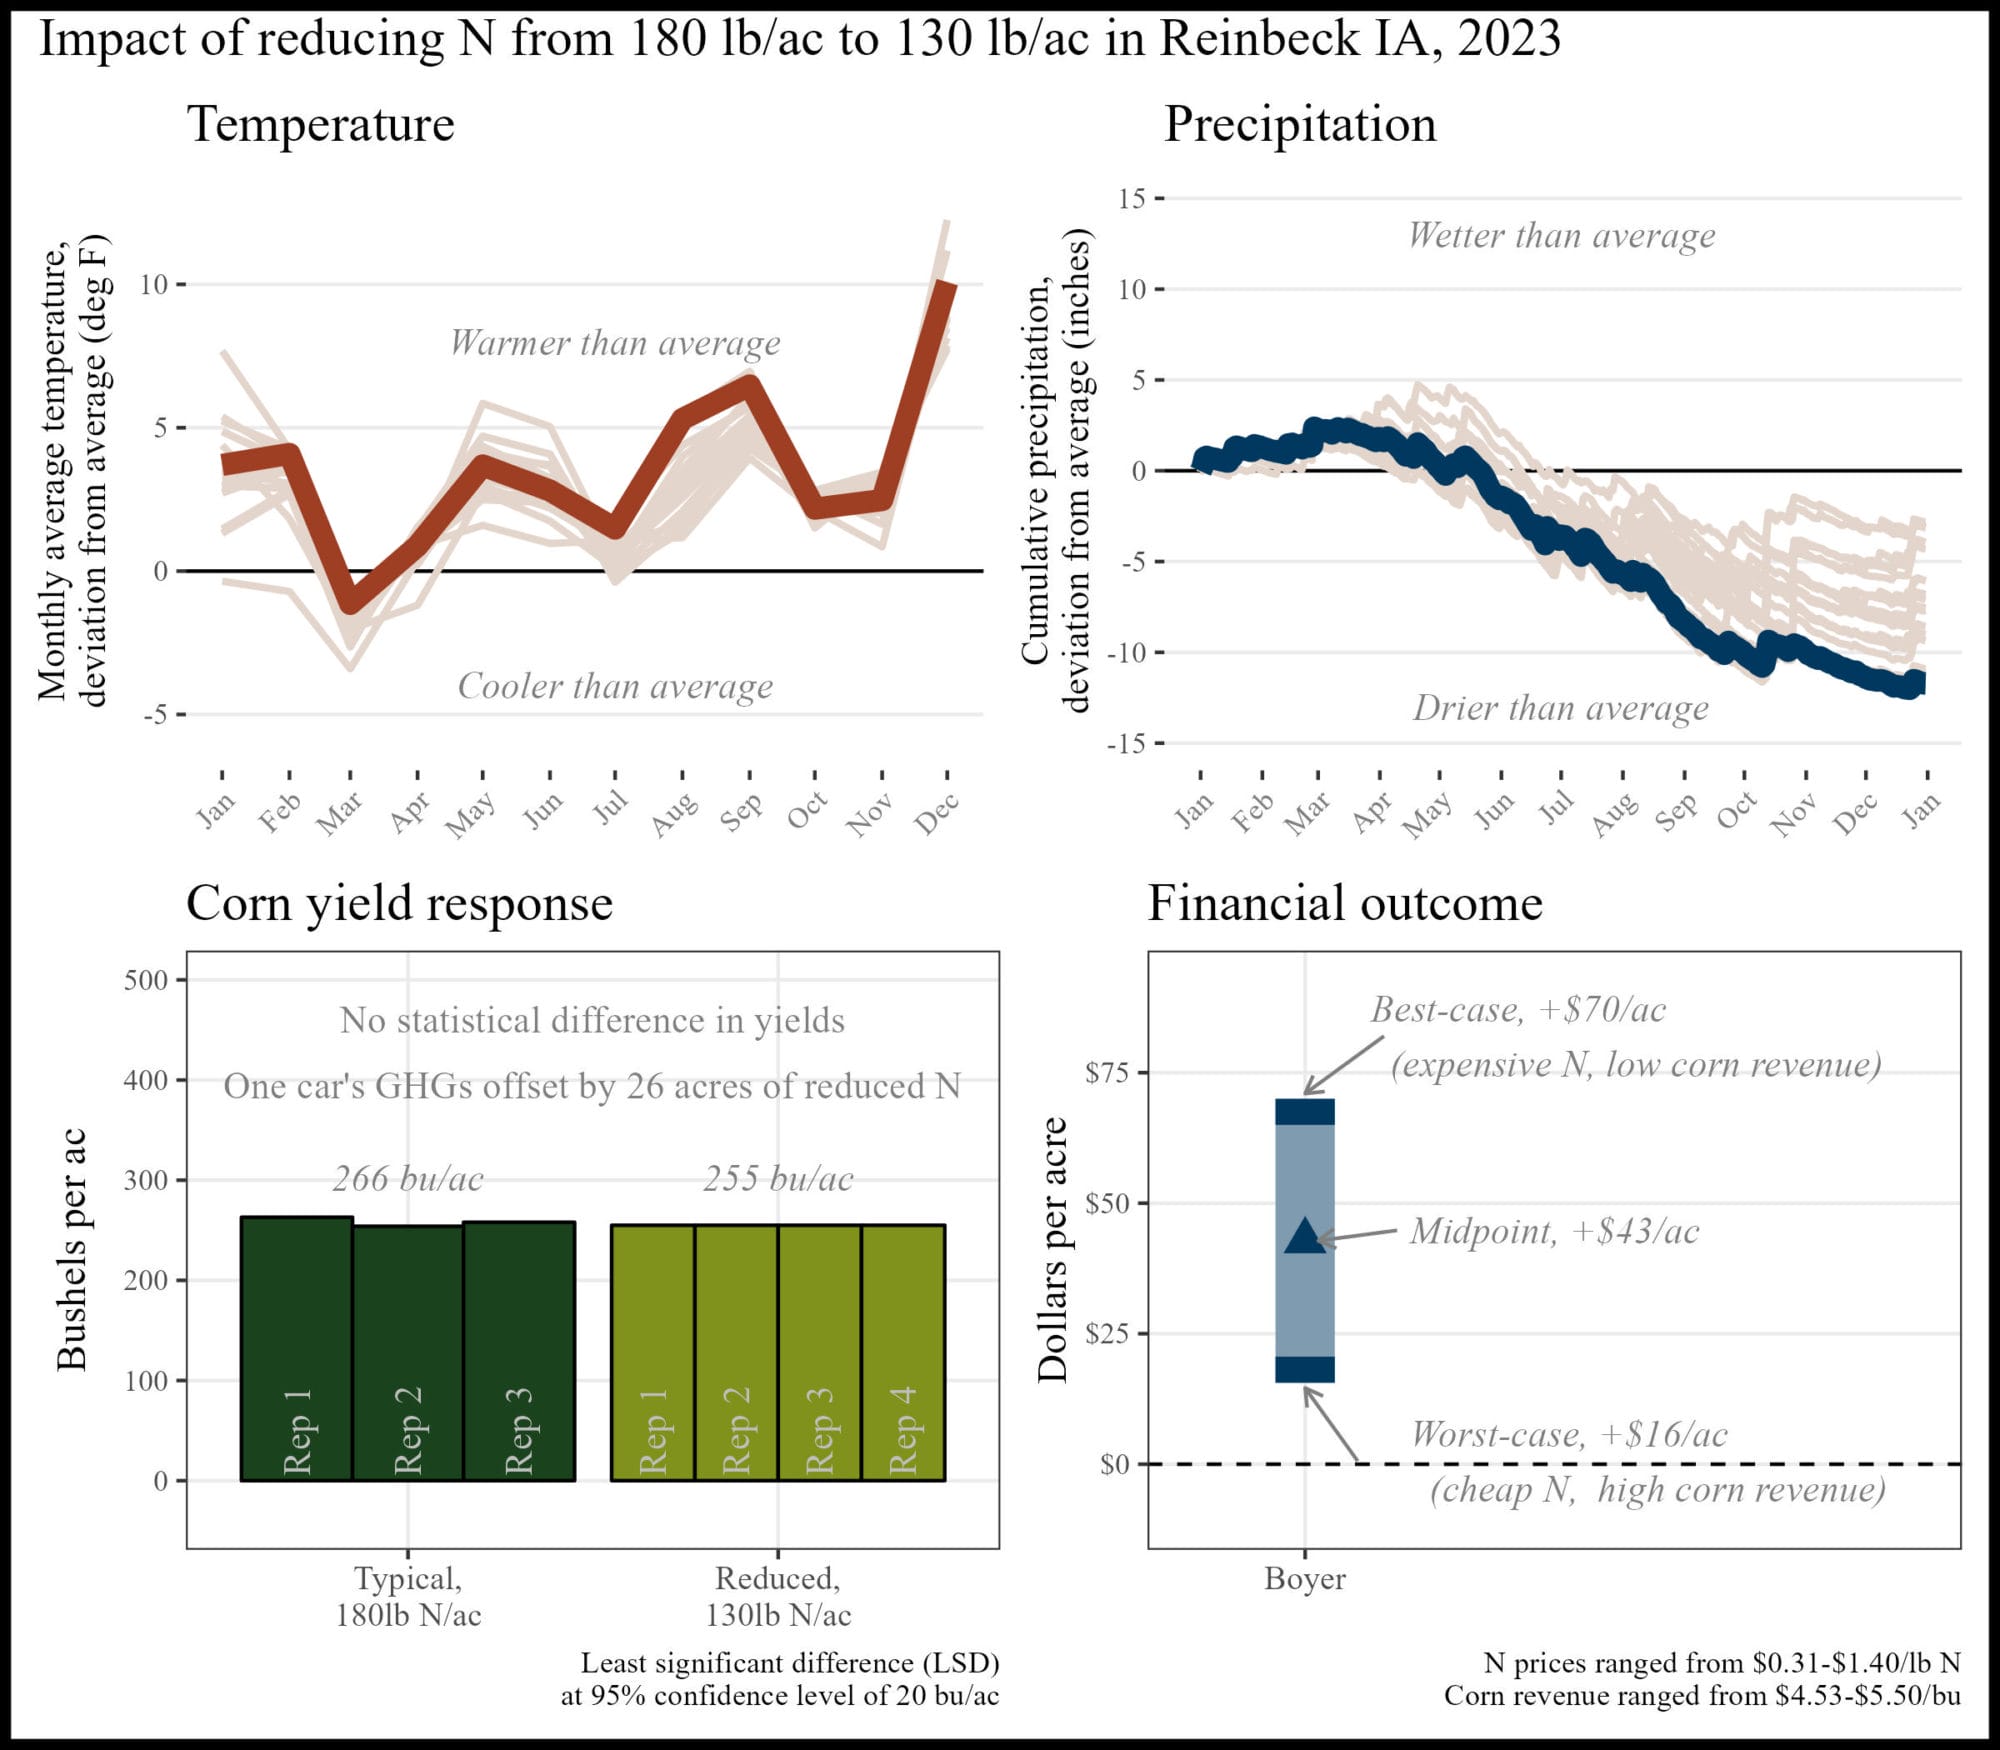
Appendix H. Jack Boyer; Reinbeck, IA
“I will continue with methods to further reduce my N input.”
The financial outcome at the reduced N rate was likely a financial savings compared to the typical N rate. A 50 lb N/ac reduction saved money this year, and, when applied to at least 26 acres, could offset the average annual GHGs of one vehicle.
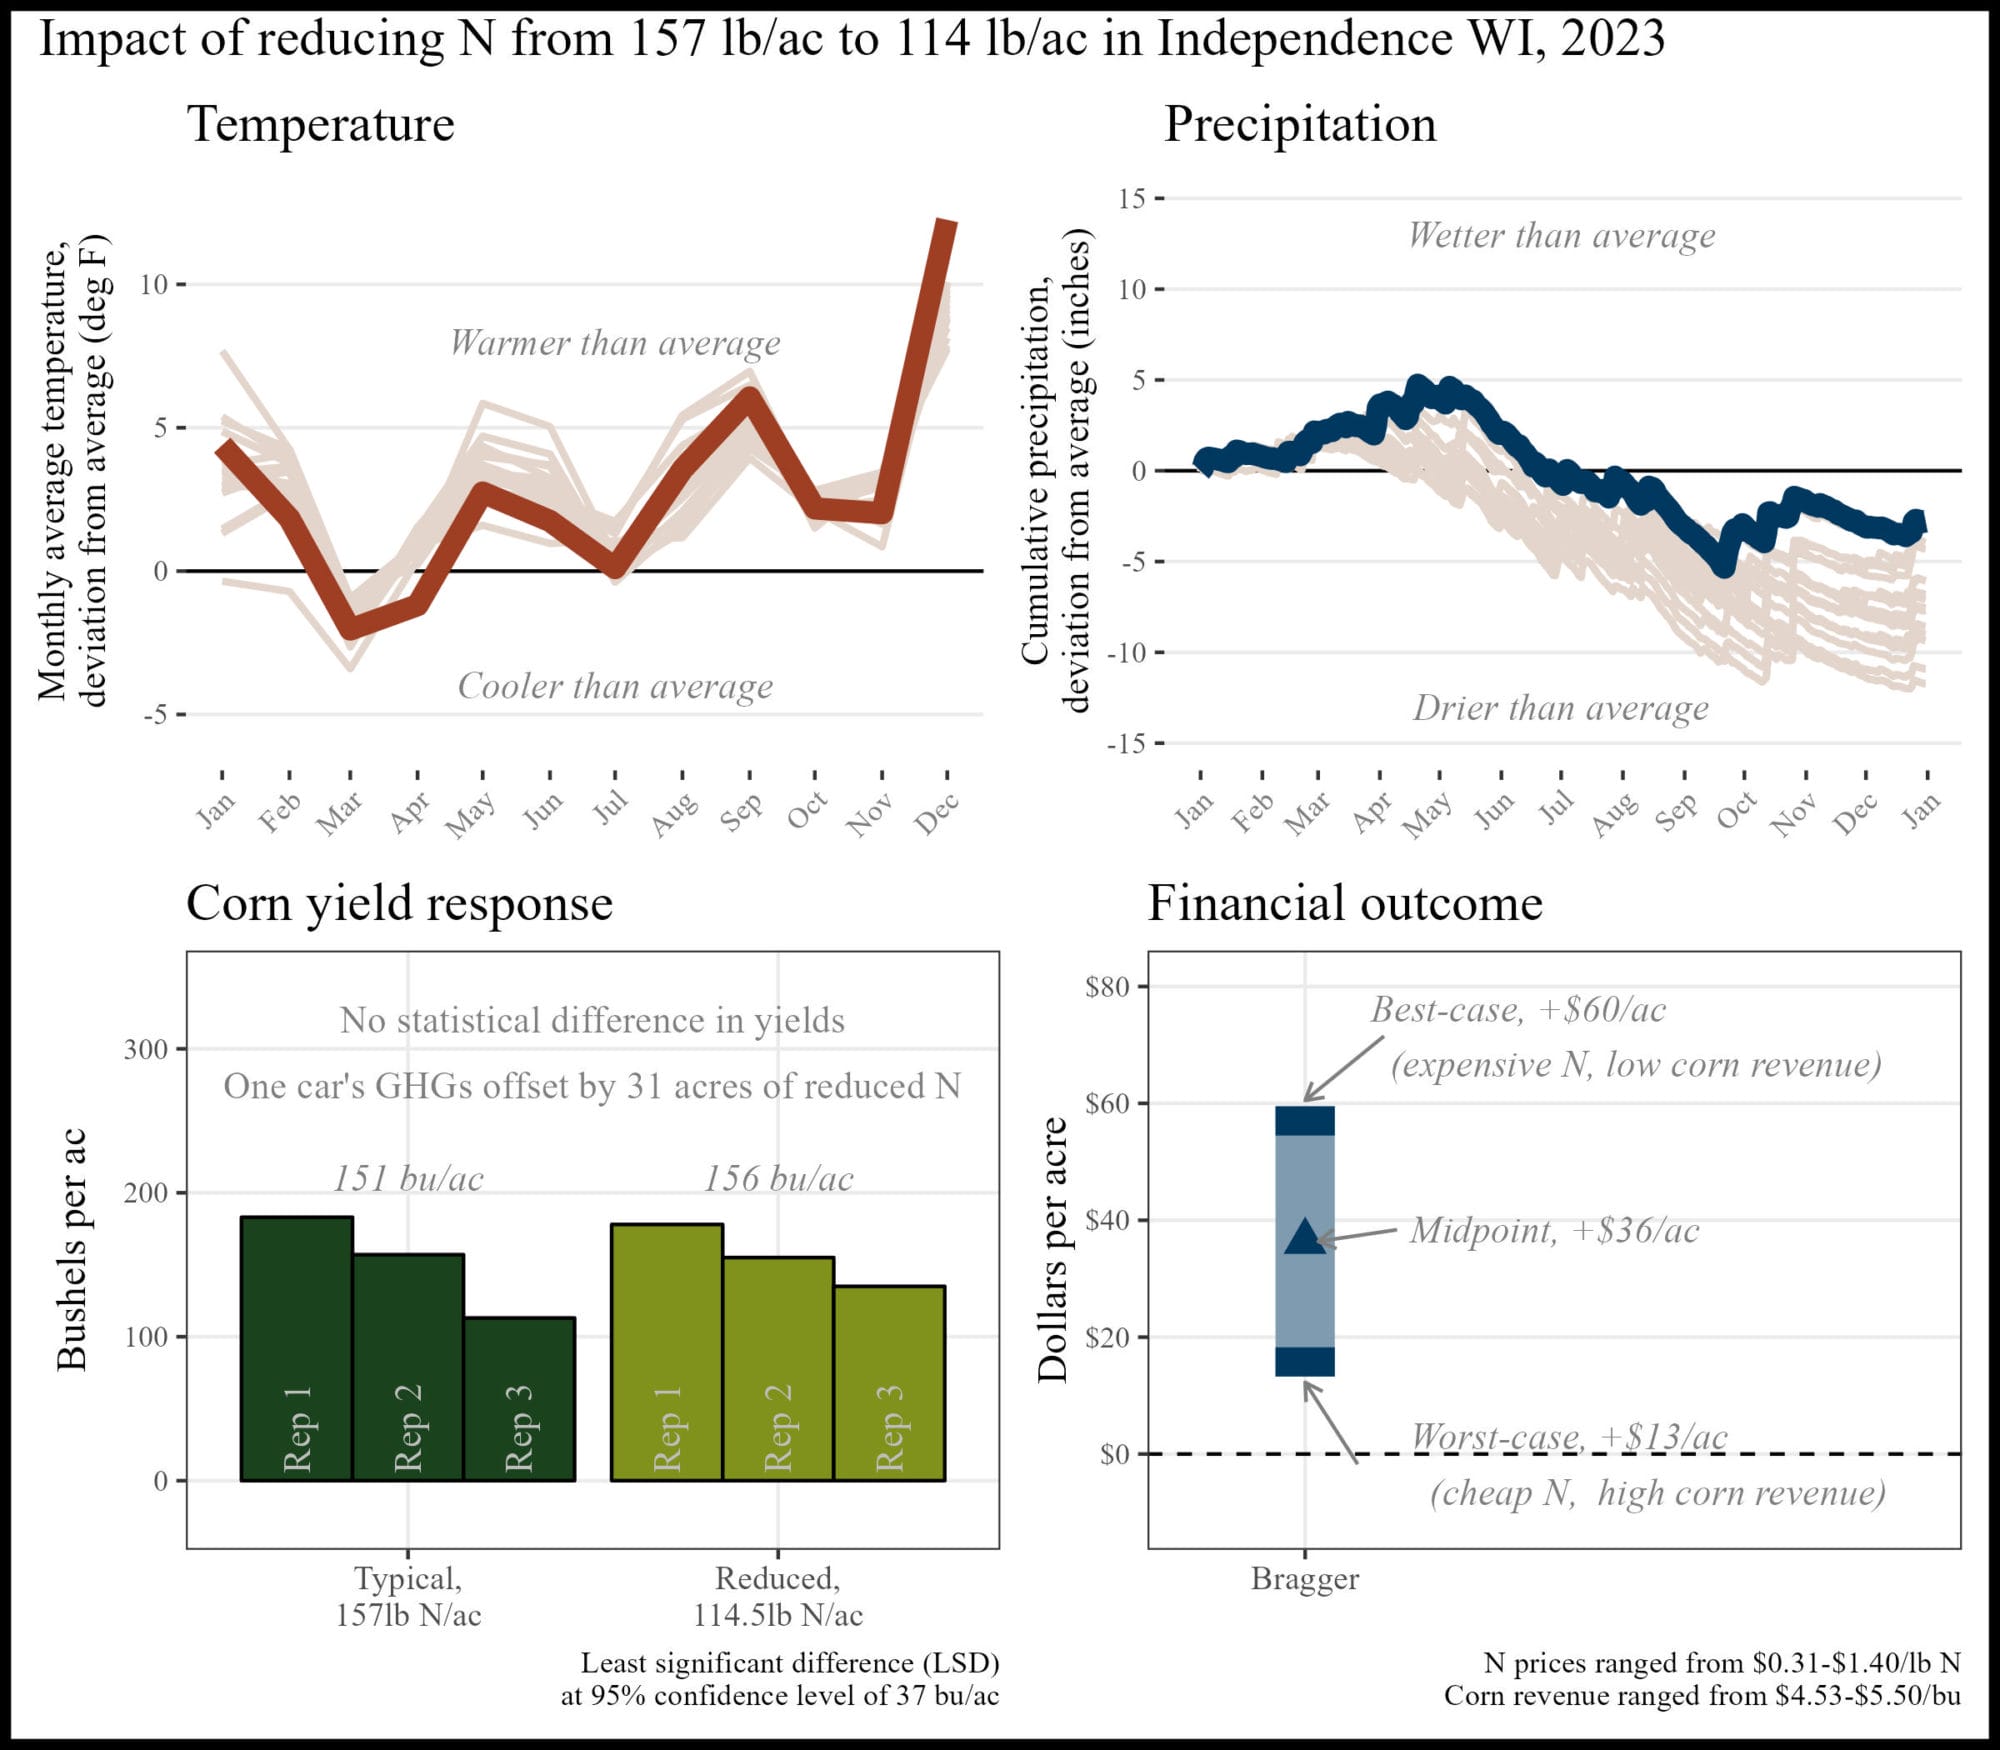
Appendix I. Joe Bragger; Independence, WI
The financial outcome at the reduced N rate was likely a financial savings compared to the typical N rate. A 43 lb N/ac reduction saved money this year, and, when applied to at least 31 acres, could offset the average annual GHGs of one vehicle.
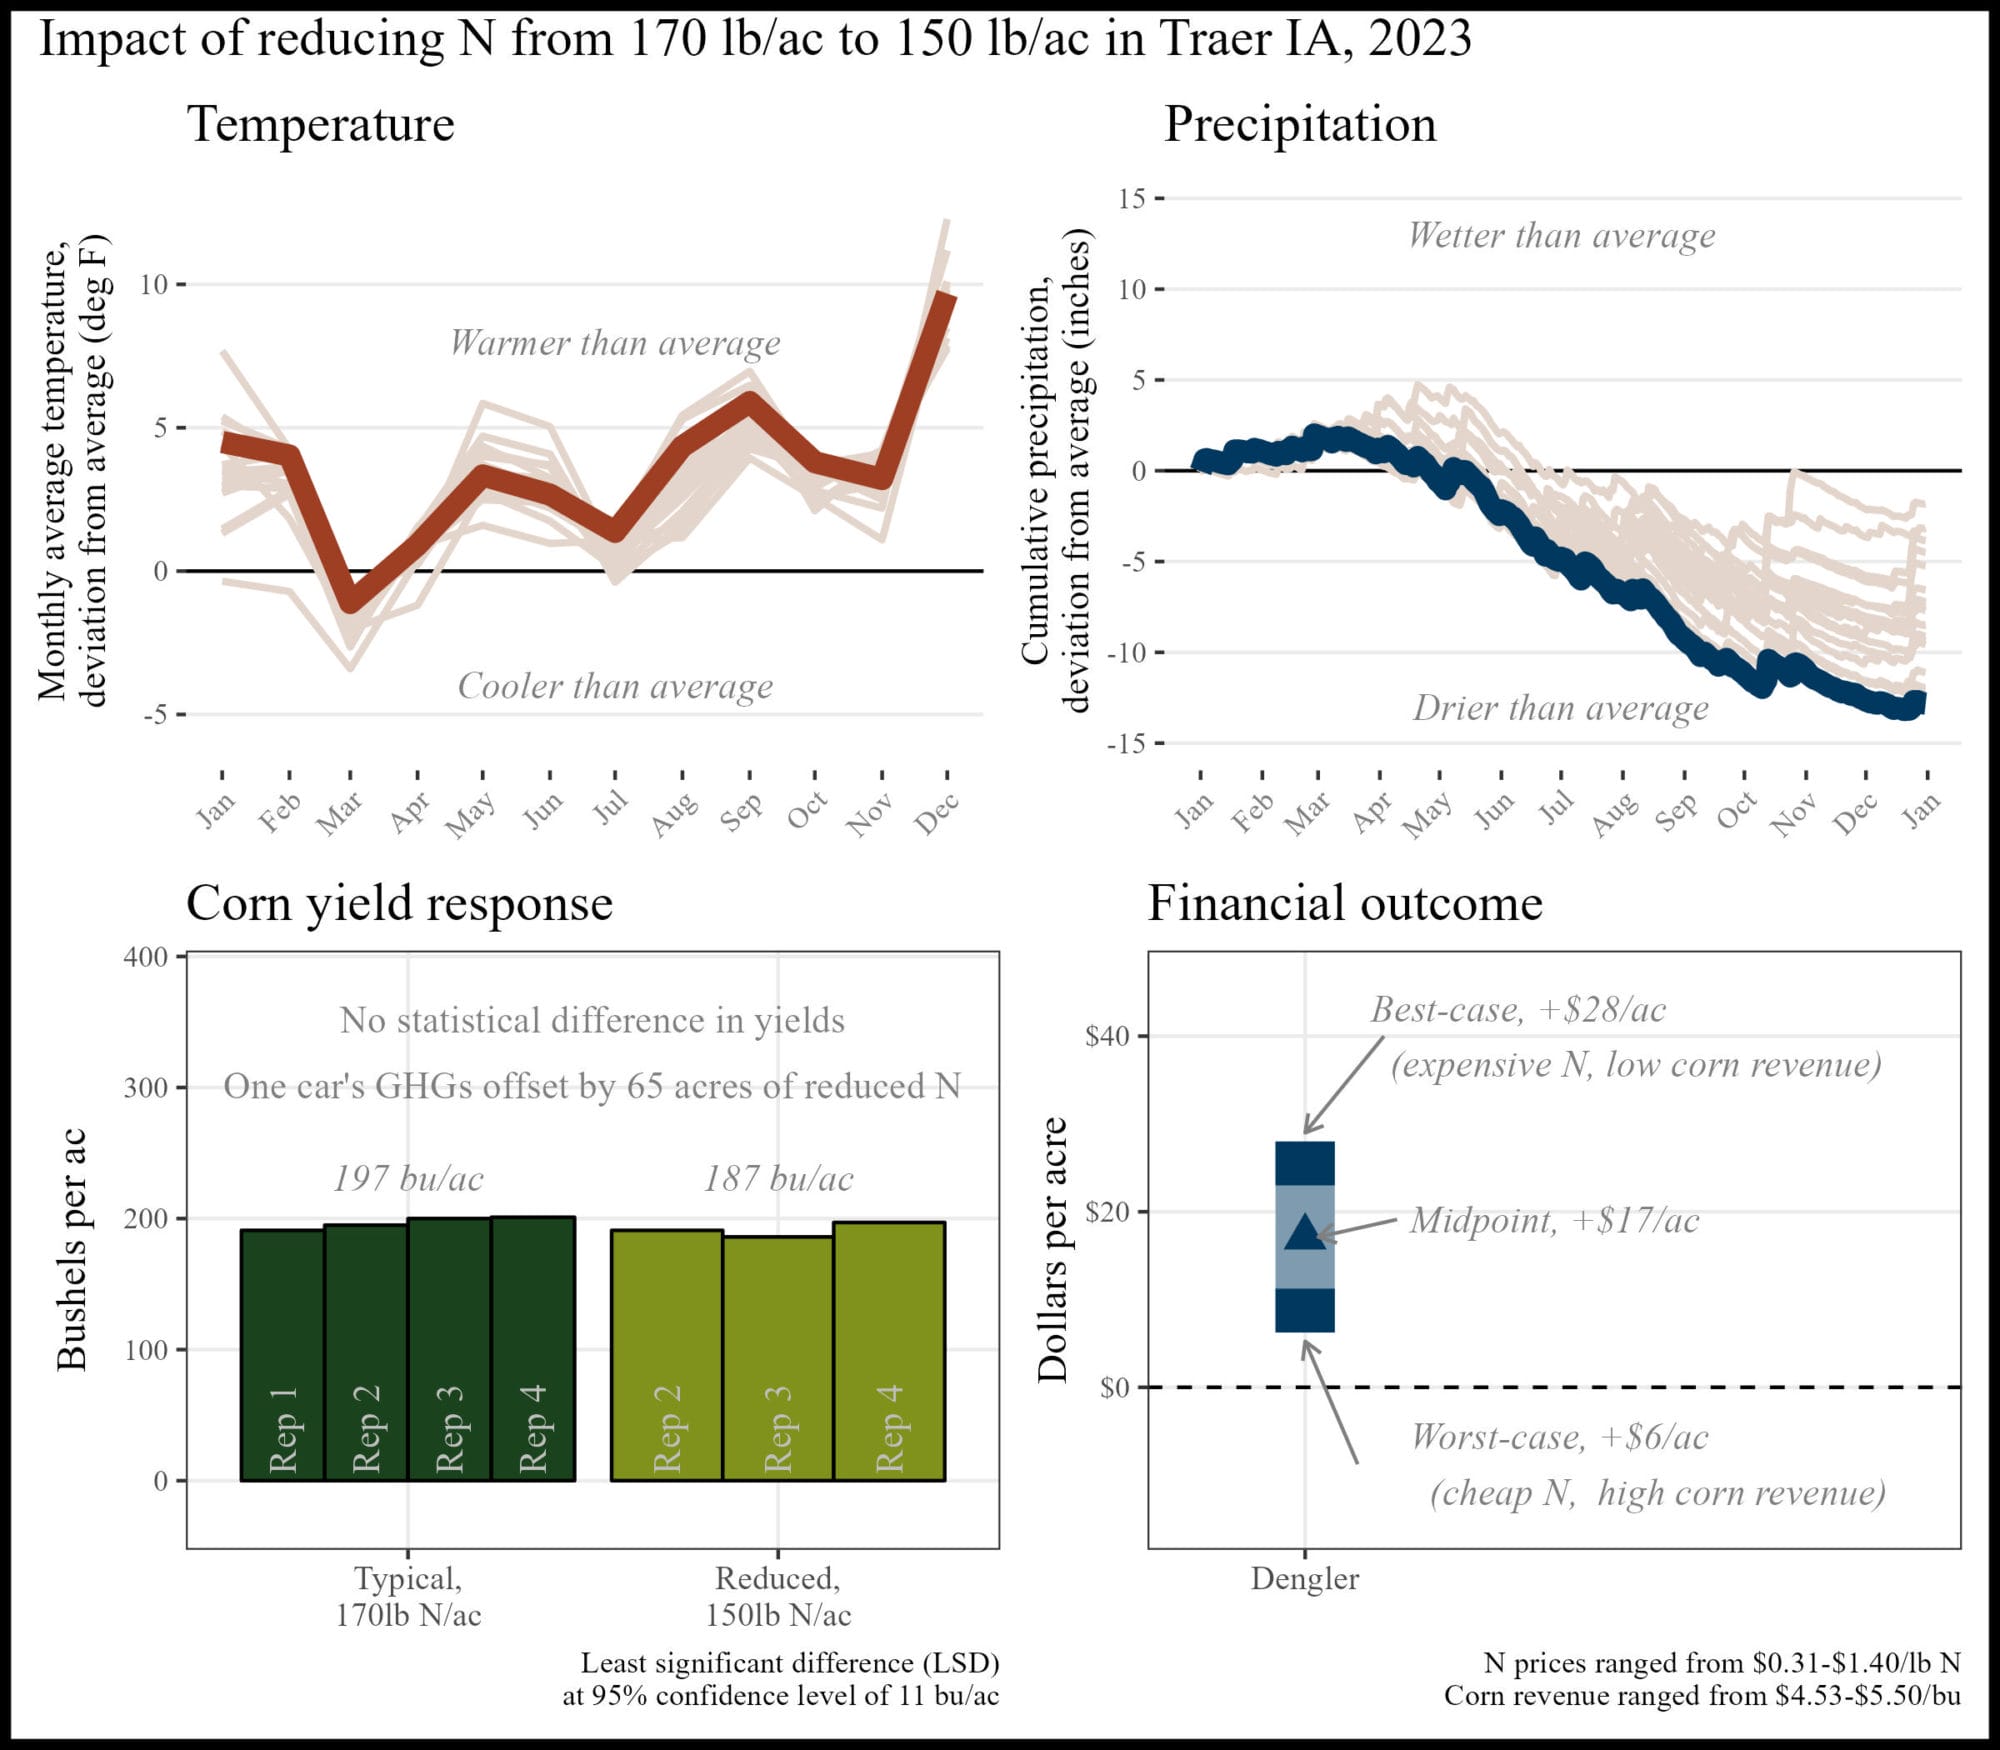
Appendix J. Sean Dengler; Traer, IA
“I suspected the typical rate was too high, but I was pleasantly surprised at how much I saved per acre with the reduced rate.”
The financial outcome at the reduced N rate was likely a financial savings compared to the typical N rate. A 30 lb N/ac reduction saved money this year, and, when applied to at least 65 acres, could offset the average annual GHGs of one vehicle.
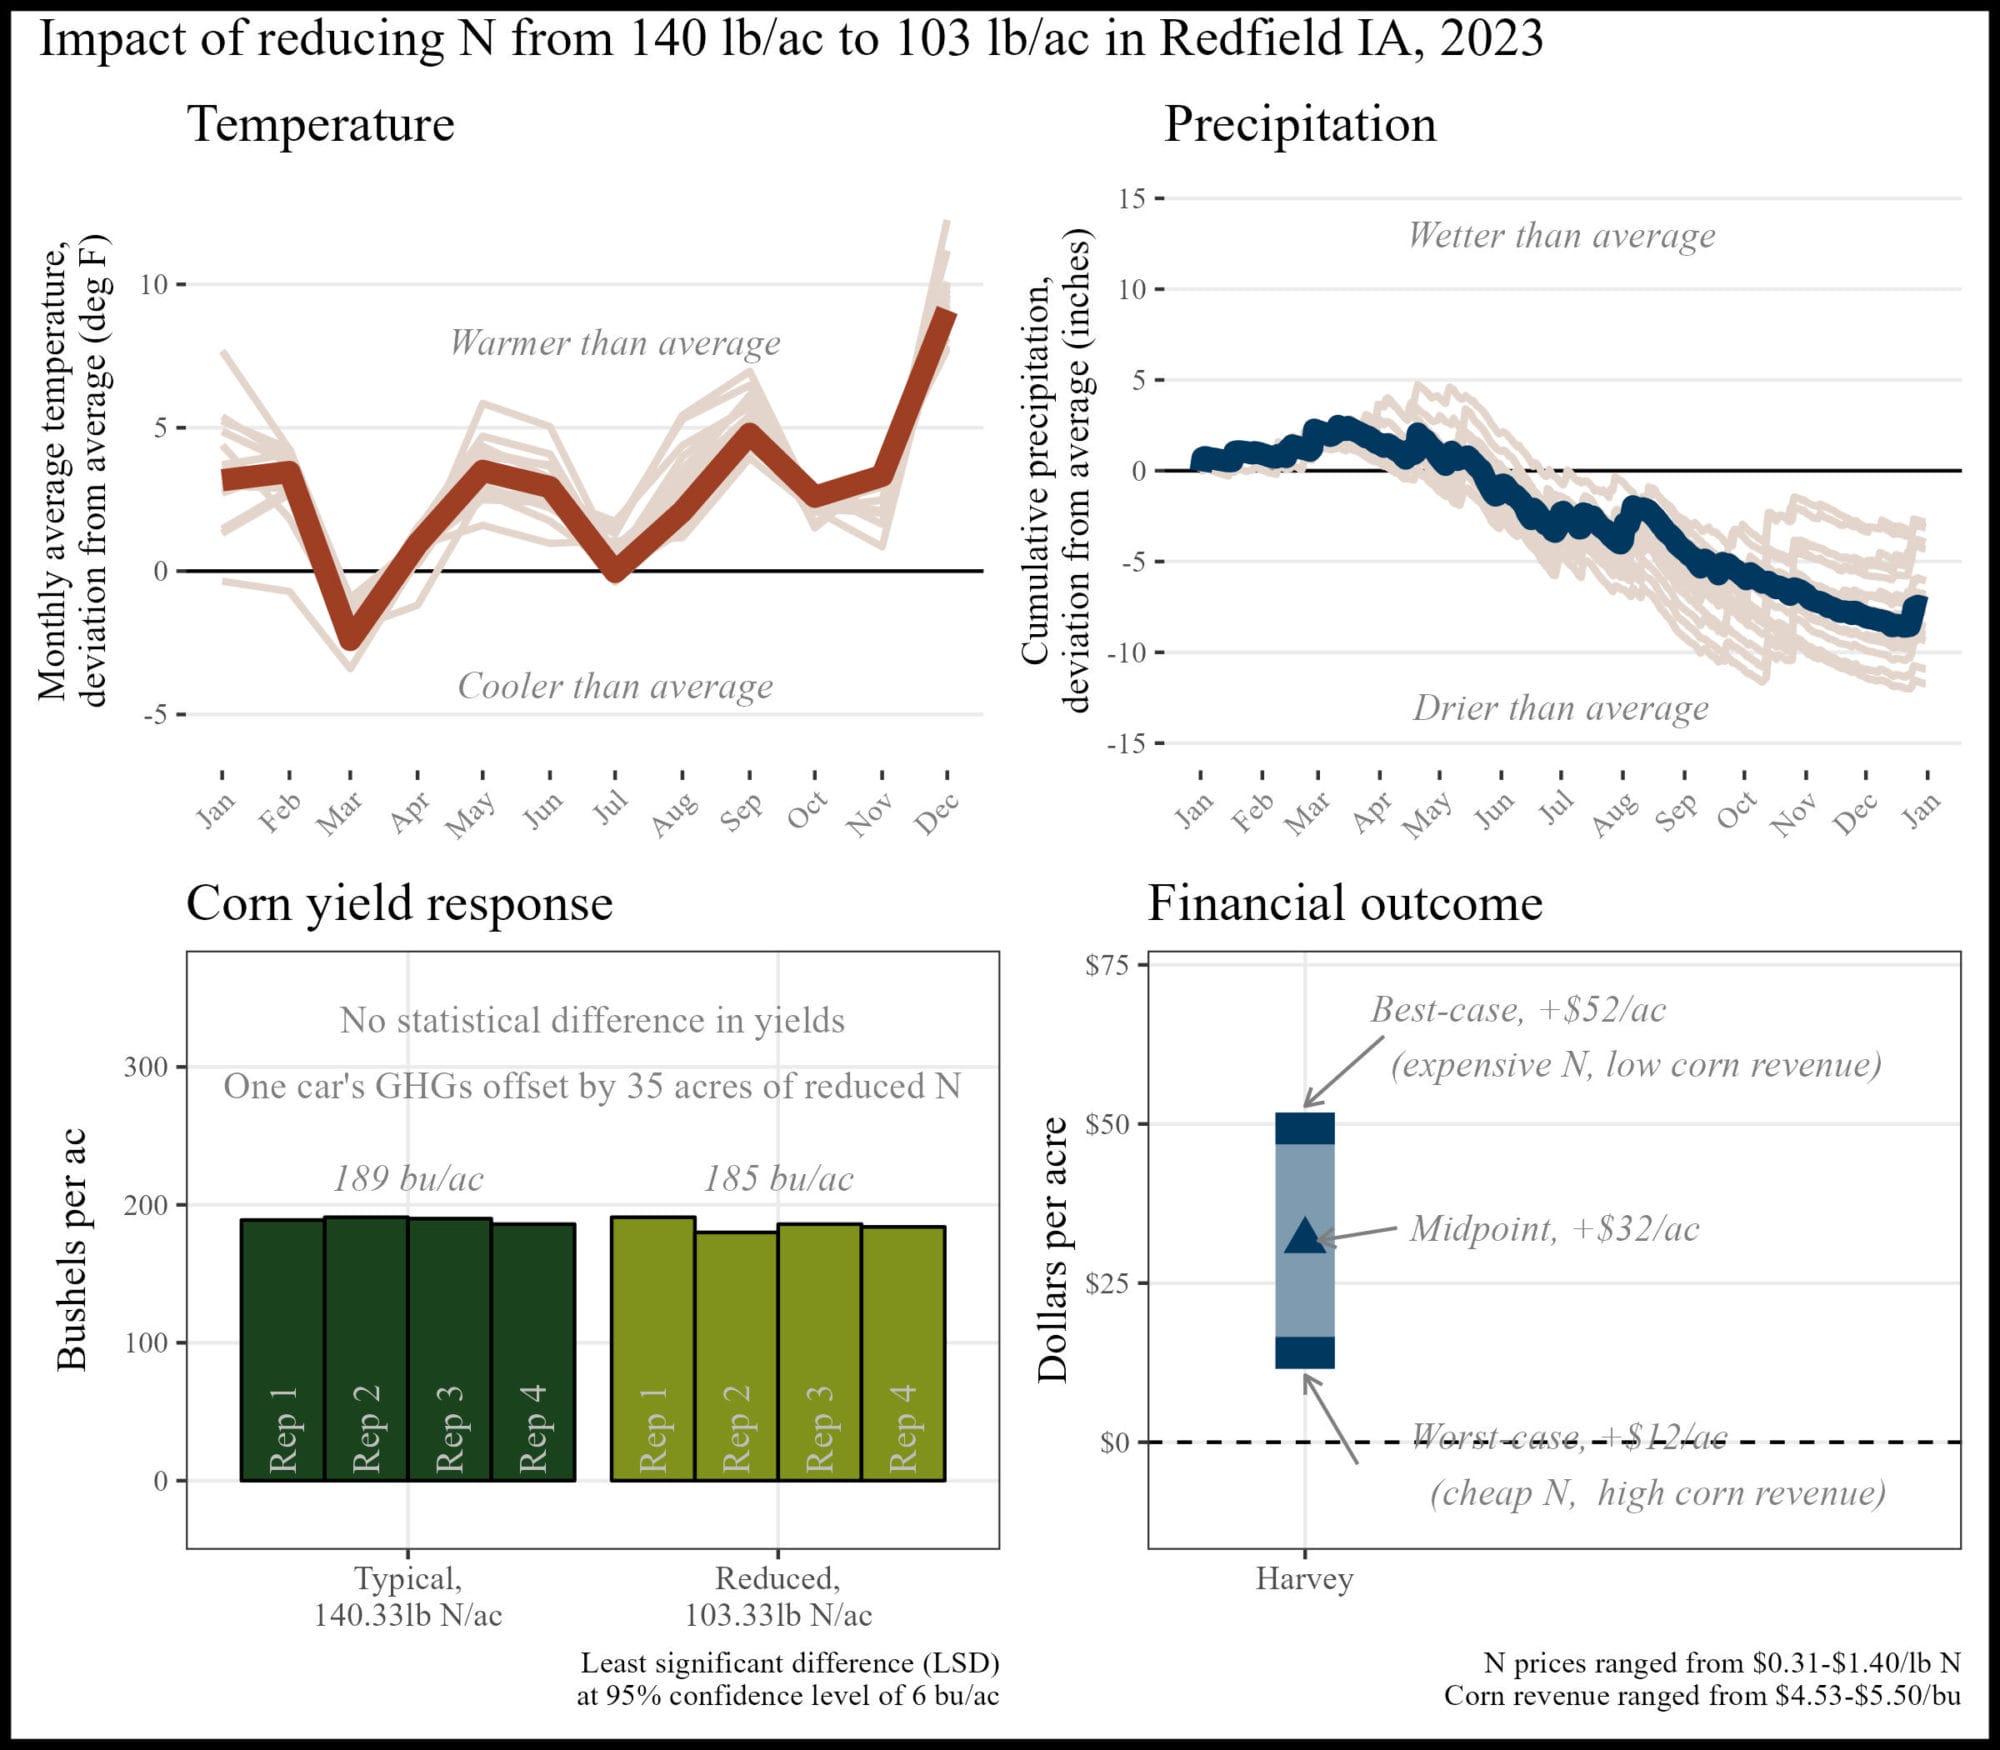
Appendix K. Robert Harvey; Redfield, IA
“This trial is one step in finding the best economic rate of N.”
The financial outcome at the reduced N rate was likely a financial savings compared to the typical N rate. A 37 lb N/ac reduction saved money this year, and, when applied to at least 35 acres, could offset the average annual GHGs of one vehicle.
Appendix L. Josh Hiemstra; Brandon, WI
“It was the third time I completed a trial with N. I now have enough confidence in my soil health program to free myself from unnecessary costs and passes.”
The financial outcome at the reduced N rate was likely a financial savings compared to the typical N rate. A 42 lb N/ac reduction saved money this year, and, when applied to at least 31 acres, could offset the average annual GHGs of one vehicle.

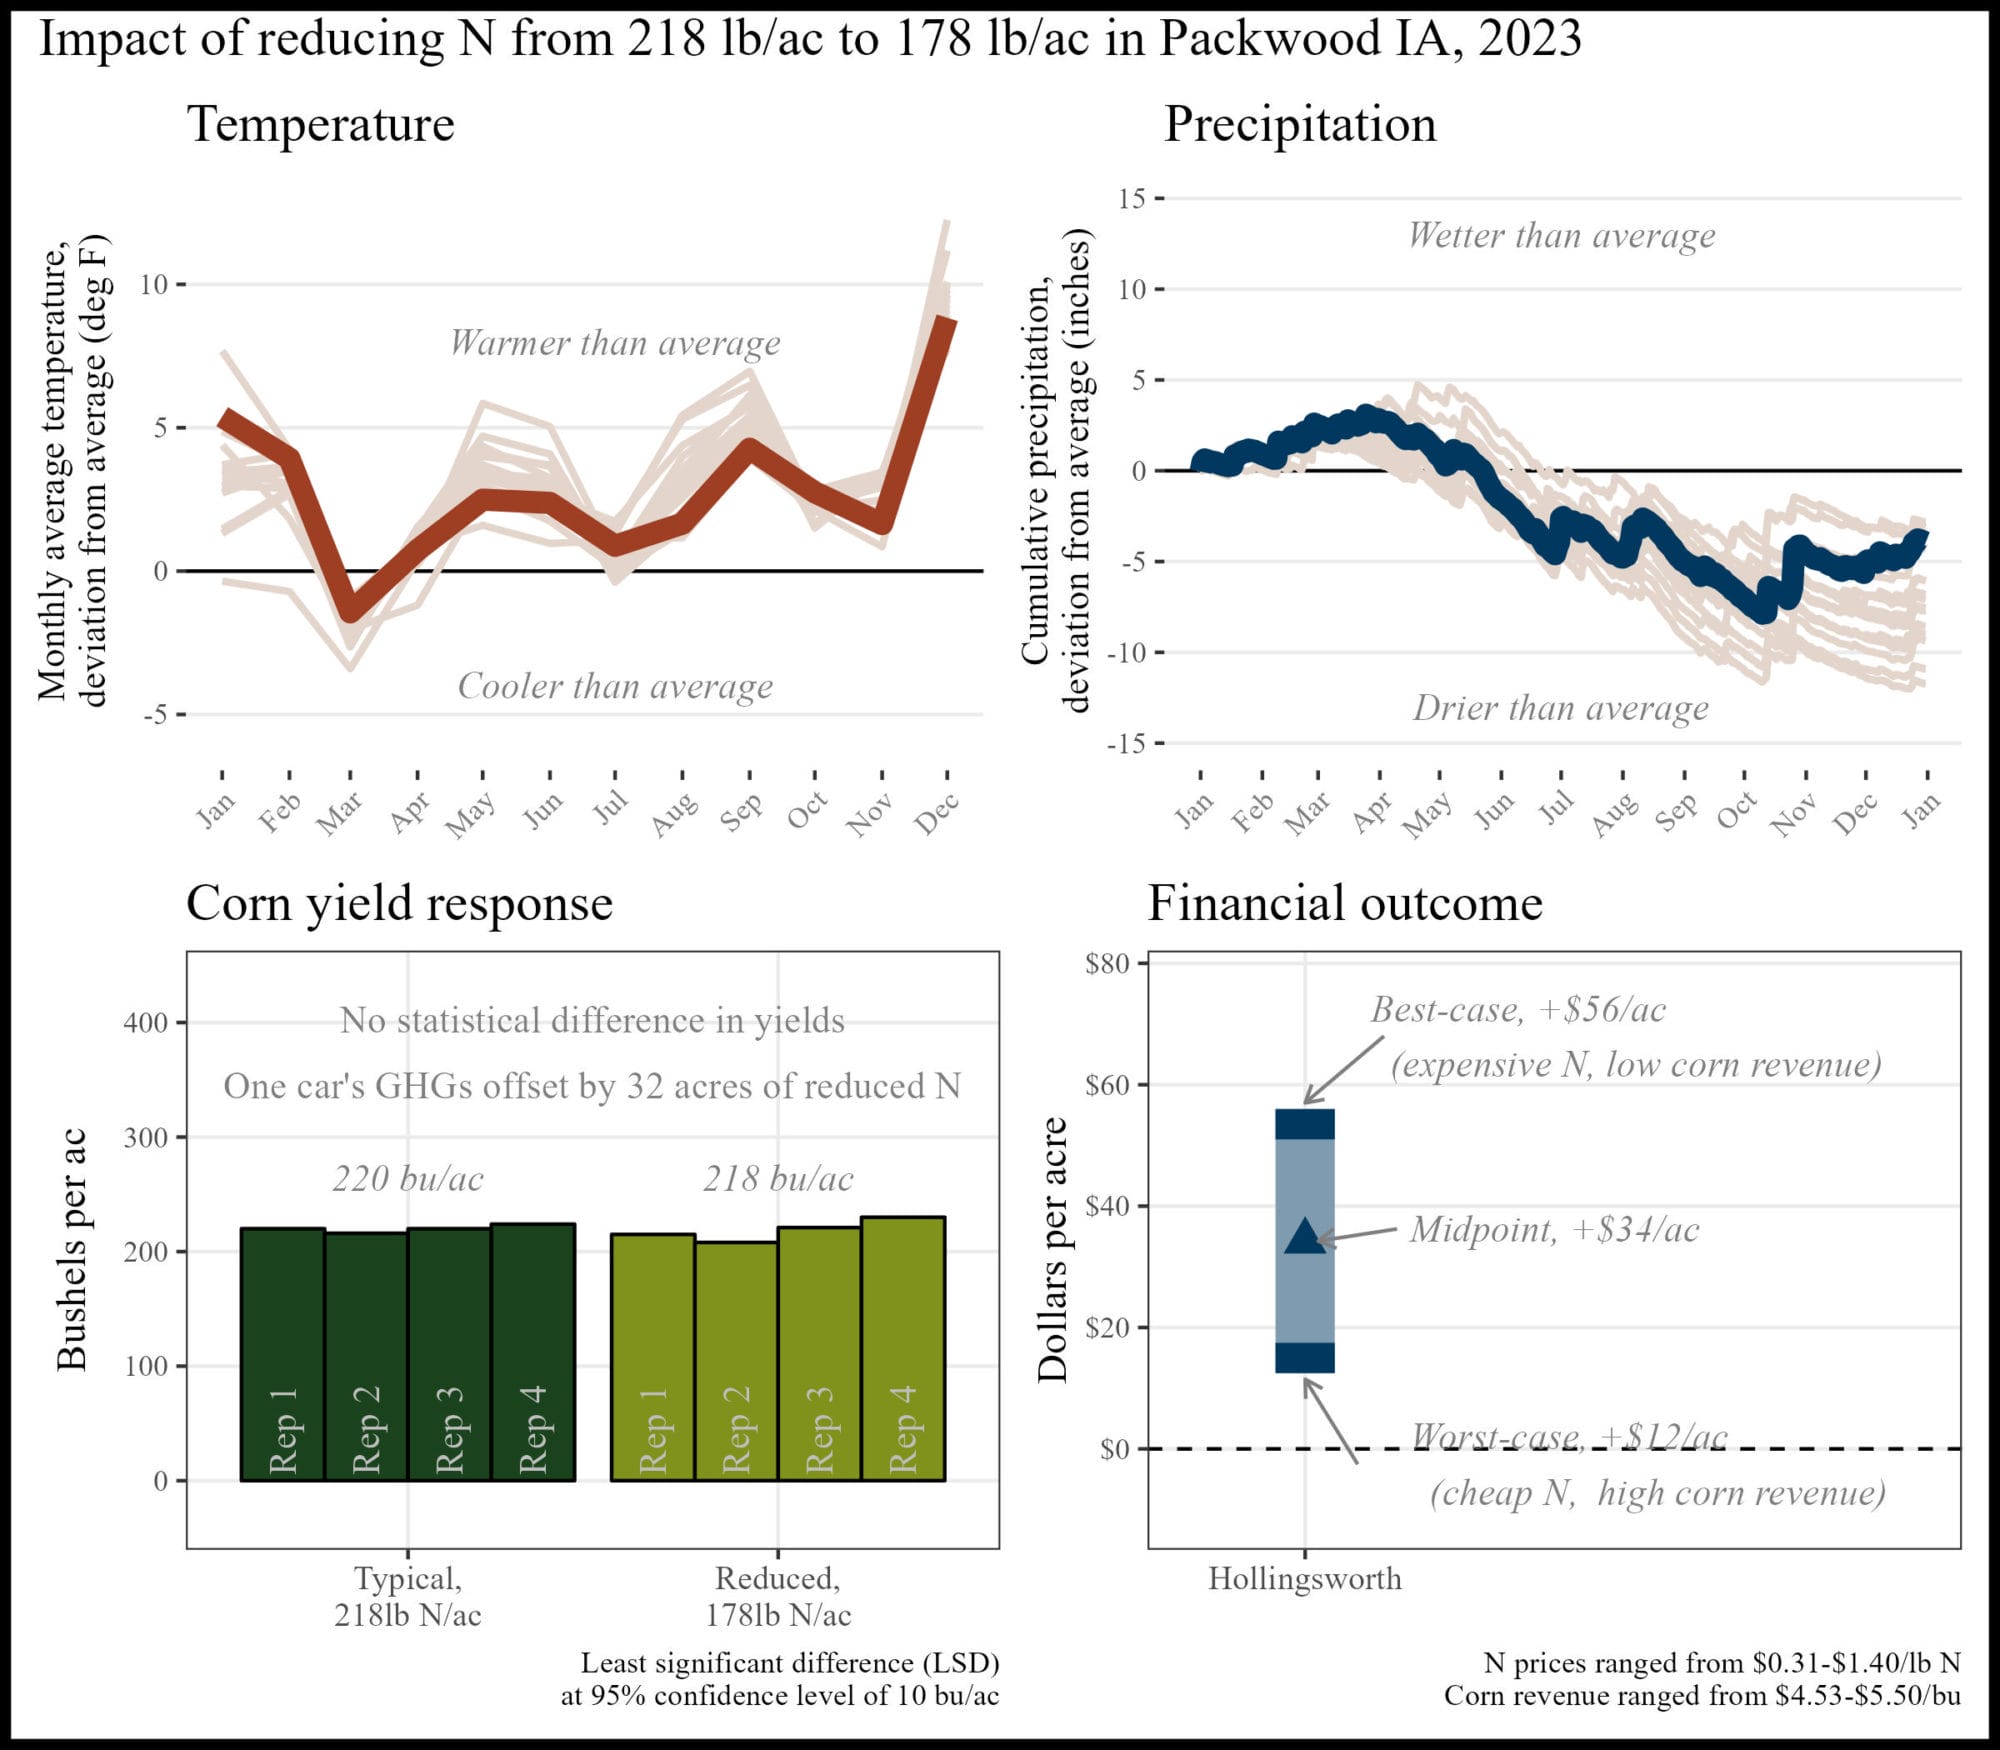
Appendix M. J.D. Hollingsworth; Packwood, IA
“I don't like to make big changes based off of one year, but seeing these results will definitely get me to try reduced rates again.”
The financial outcome at the reduced N rate was likely a financial savings compared to the typical N rate. A 40 lb N/ac reduction saved money this year, and, when applied to at least 32 acres, could offset the average annual GHGs of one vehicle.
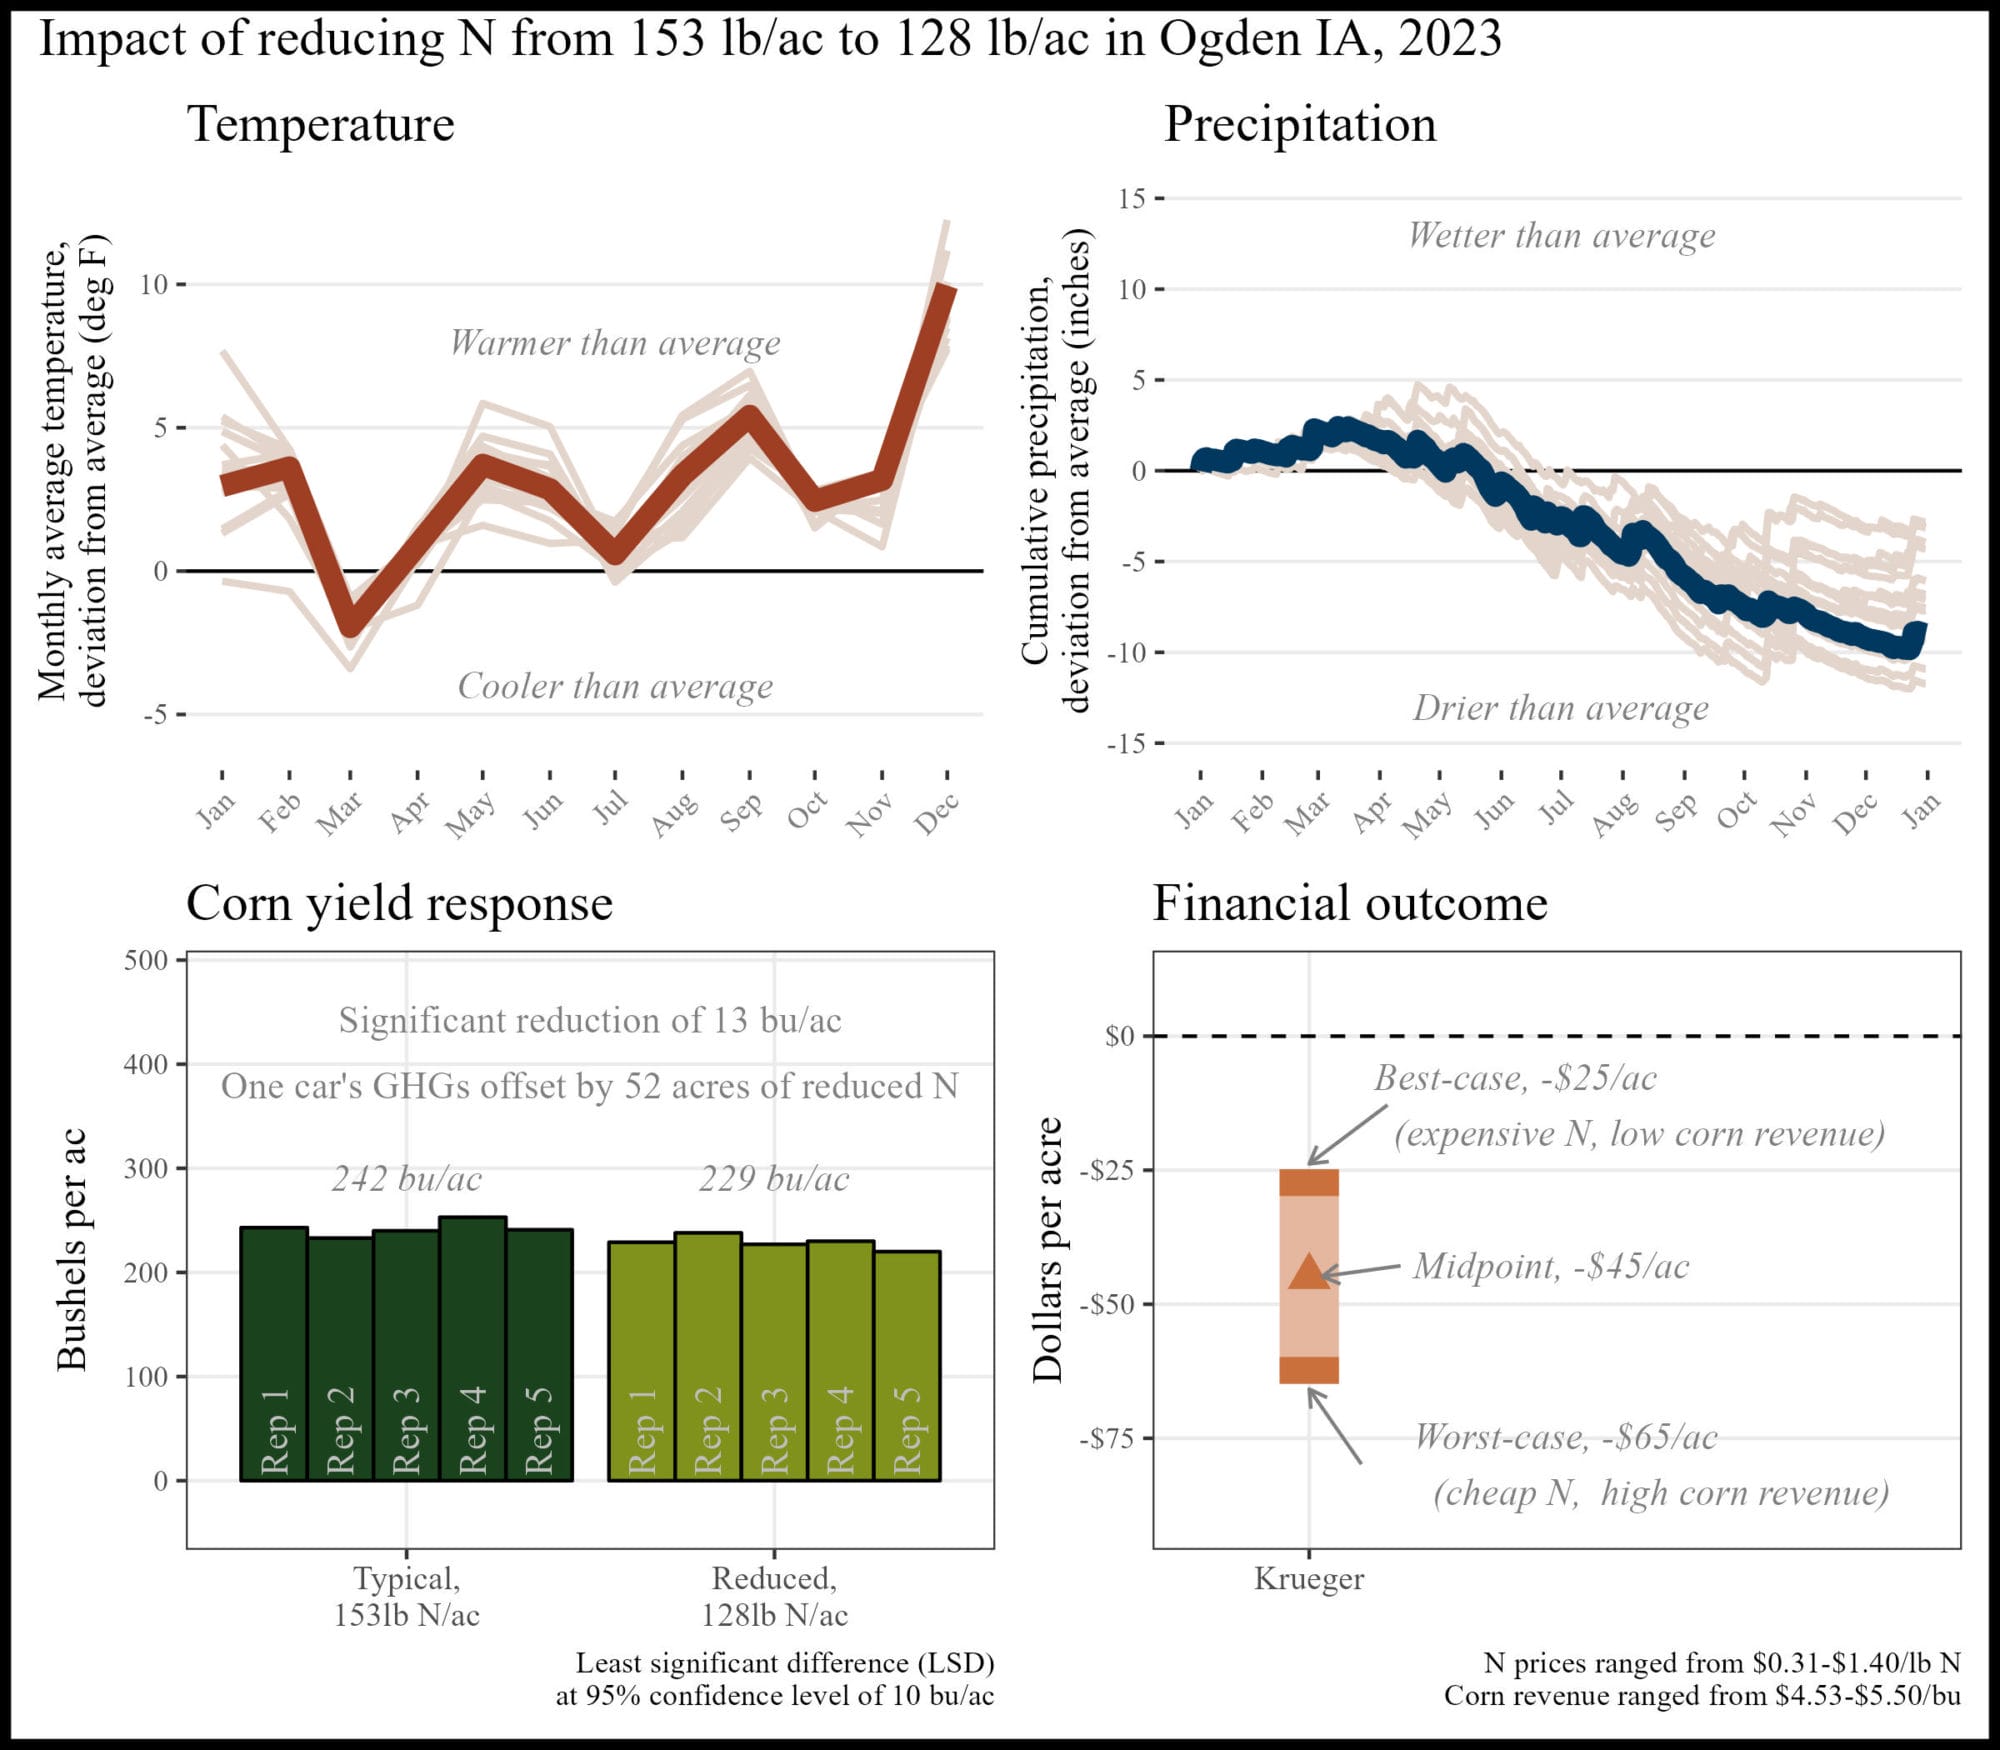
Appendix N. Keaton Krueger; Ogden, IA
The financial outcome at the reduced N rate was likely a financial loss compared to the typical N rate. A 25 lb N/ac reduction was likely too large this year.
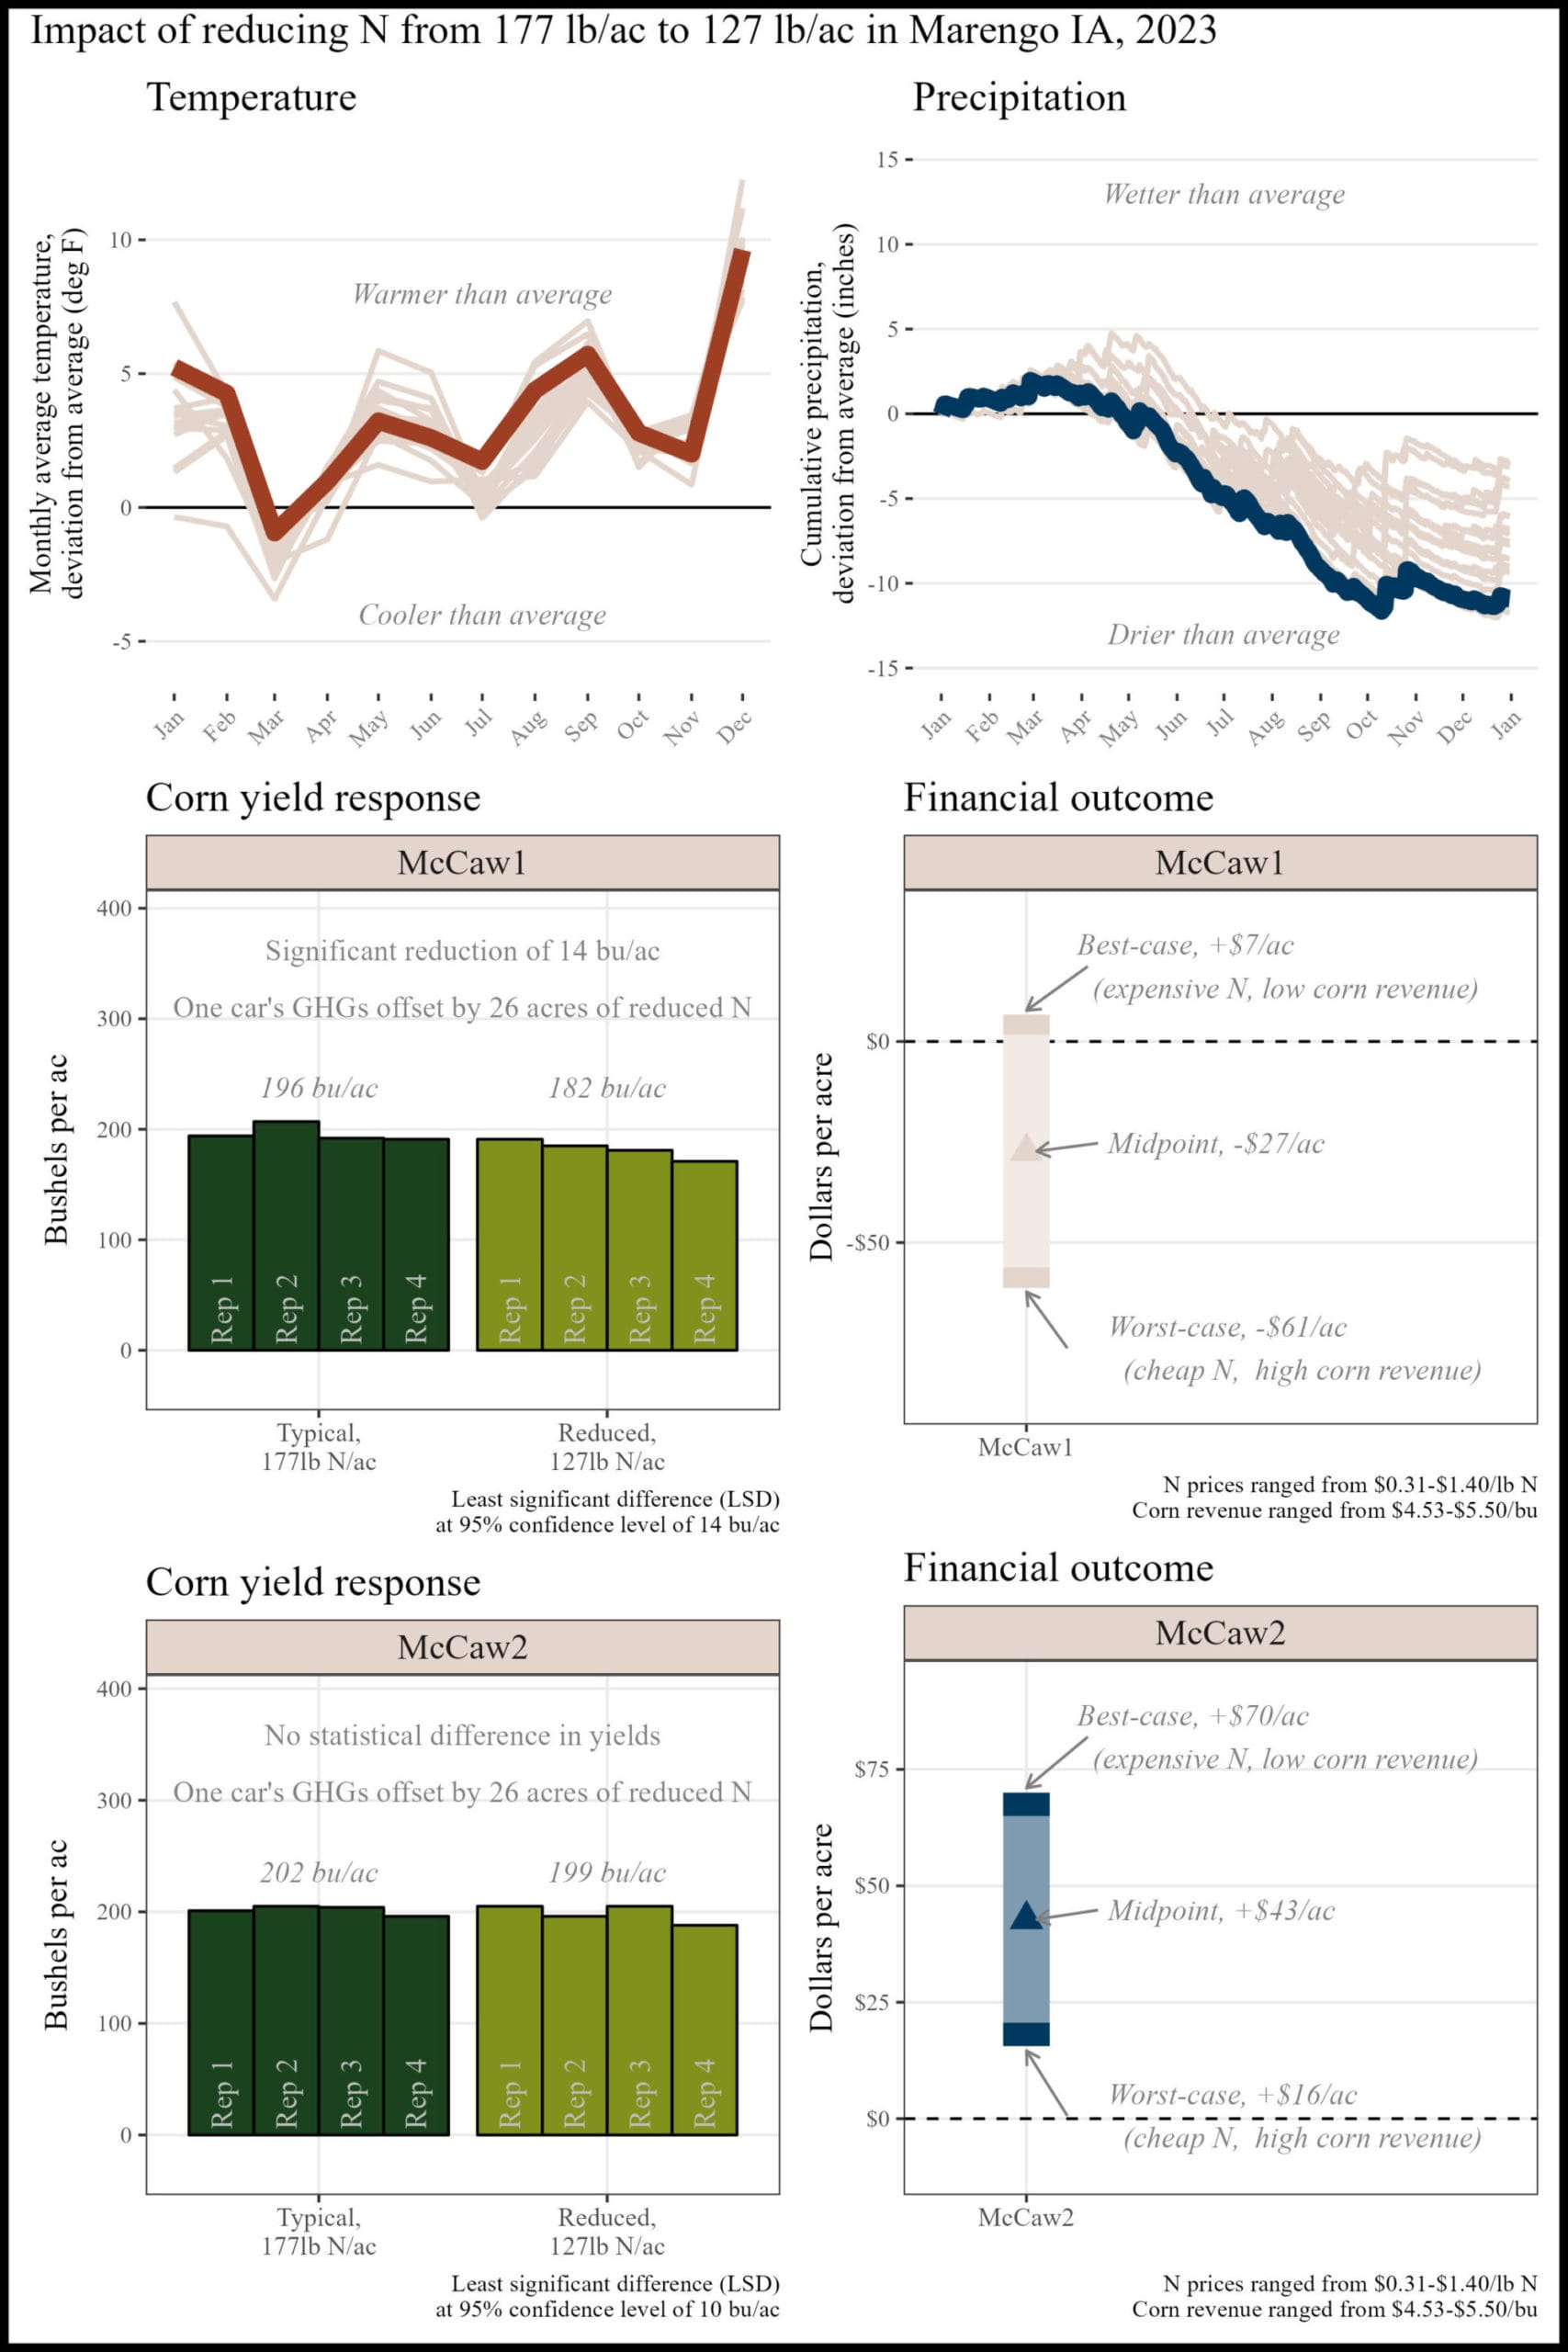
Appendix O. Ross McCaw; Marengo, IA
“Really opens your mind to what different soil types need for nitrogen. Without this test I would have never started spoon feeding nitrogen with multiple passes. I will be doing this from here on.”
In field 1, the financial outcome at the reduced N rate was likely a financial loss. A 50 lb N/ac reduction was likely too large this year, but a smaller N reduction could bring financial savings.
In field 2, the financial outcome at the reduced N rate was likely a financial savings compared to the typical N rate. A 50 lb N/ac reduction saved money this year, and, when applied to at least 26 acres, could offset the average annual GHGs of one vehicle.
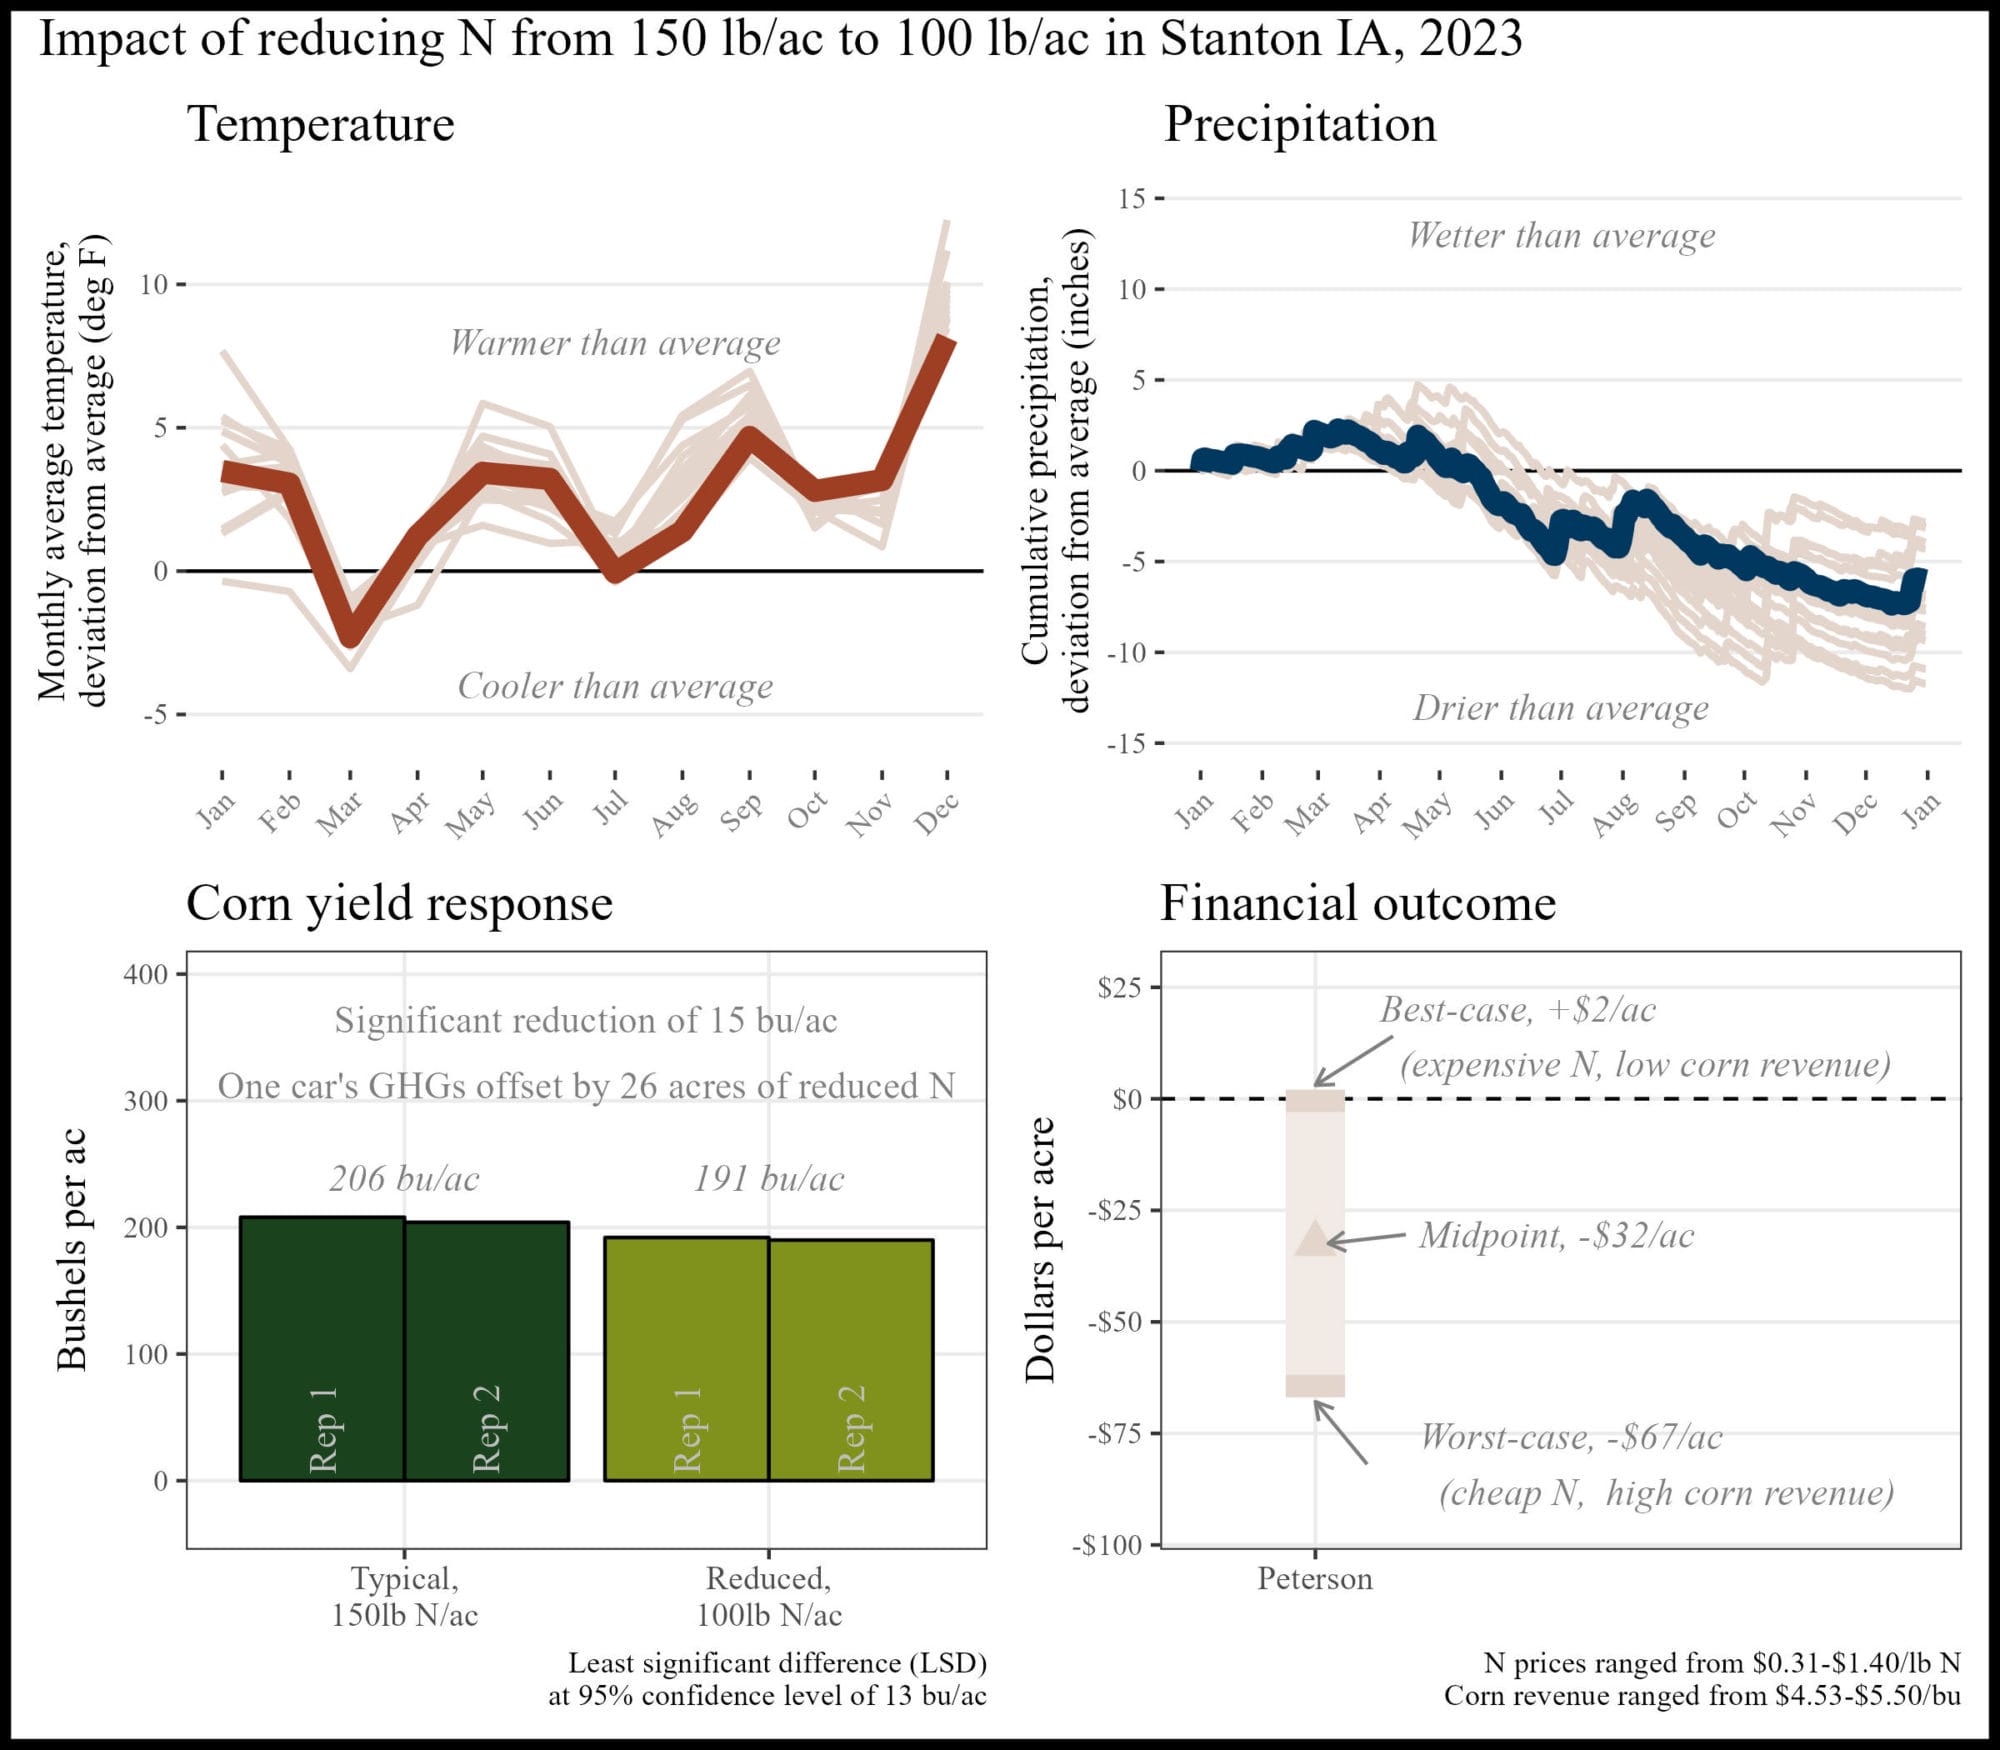
Appendix P. Mark Peterson; Stanton, IA
The financial outcome at the reduced N rate was likely a financial loss. A 50 lb N/ac reduction was likely too large this year, but a smaller N reduction could bring financial savings.
Appendix Q. Kevin Prevo; Bloomfield, IA
“Love replicated trials. Always learning. Every year different.”
The financial outcome at the reduced N rate was likely a financial savings compared to the typical N rate. A 53 lb N/ac reduction saved money this year, and, when applied to at least 24 acres, could offset the average annual GHGs of one vehicle.

Appendix R. John Van Horn; Glidden, IA
The financial outcome at the reduced N rate was likely a financial savings compared to the typical N rate. A 60 lb N/ac reduction saved money this year, and, when applied to at least 22 acres, could offset the average annual GHGs of one vehicle.

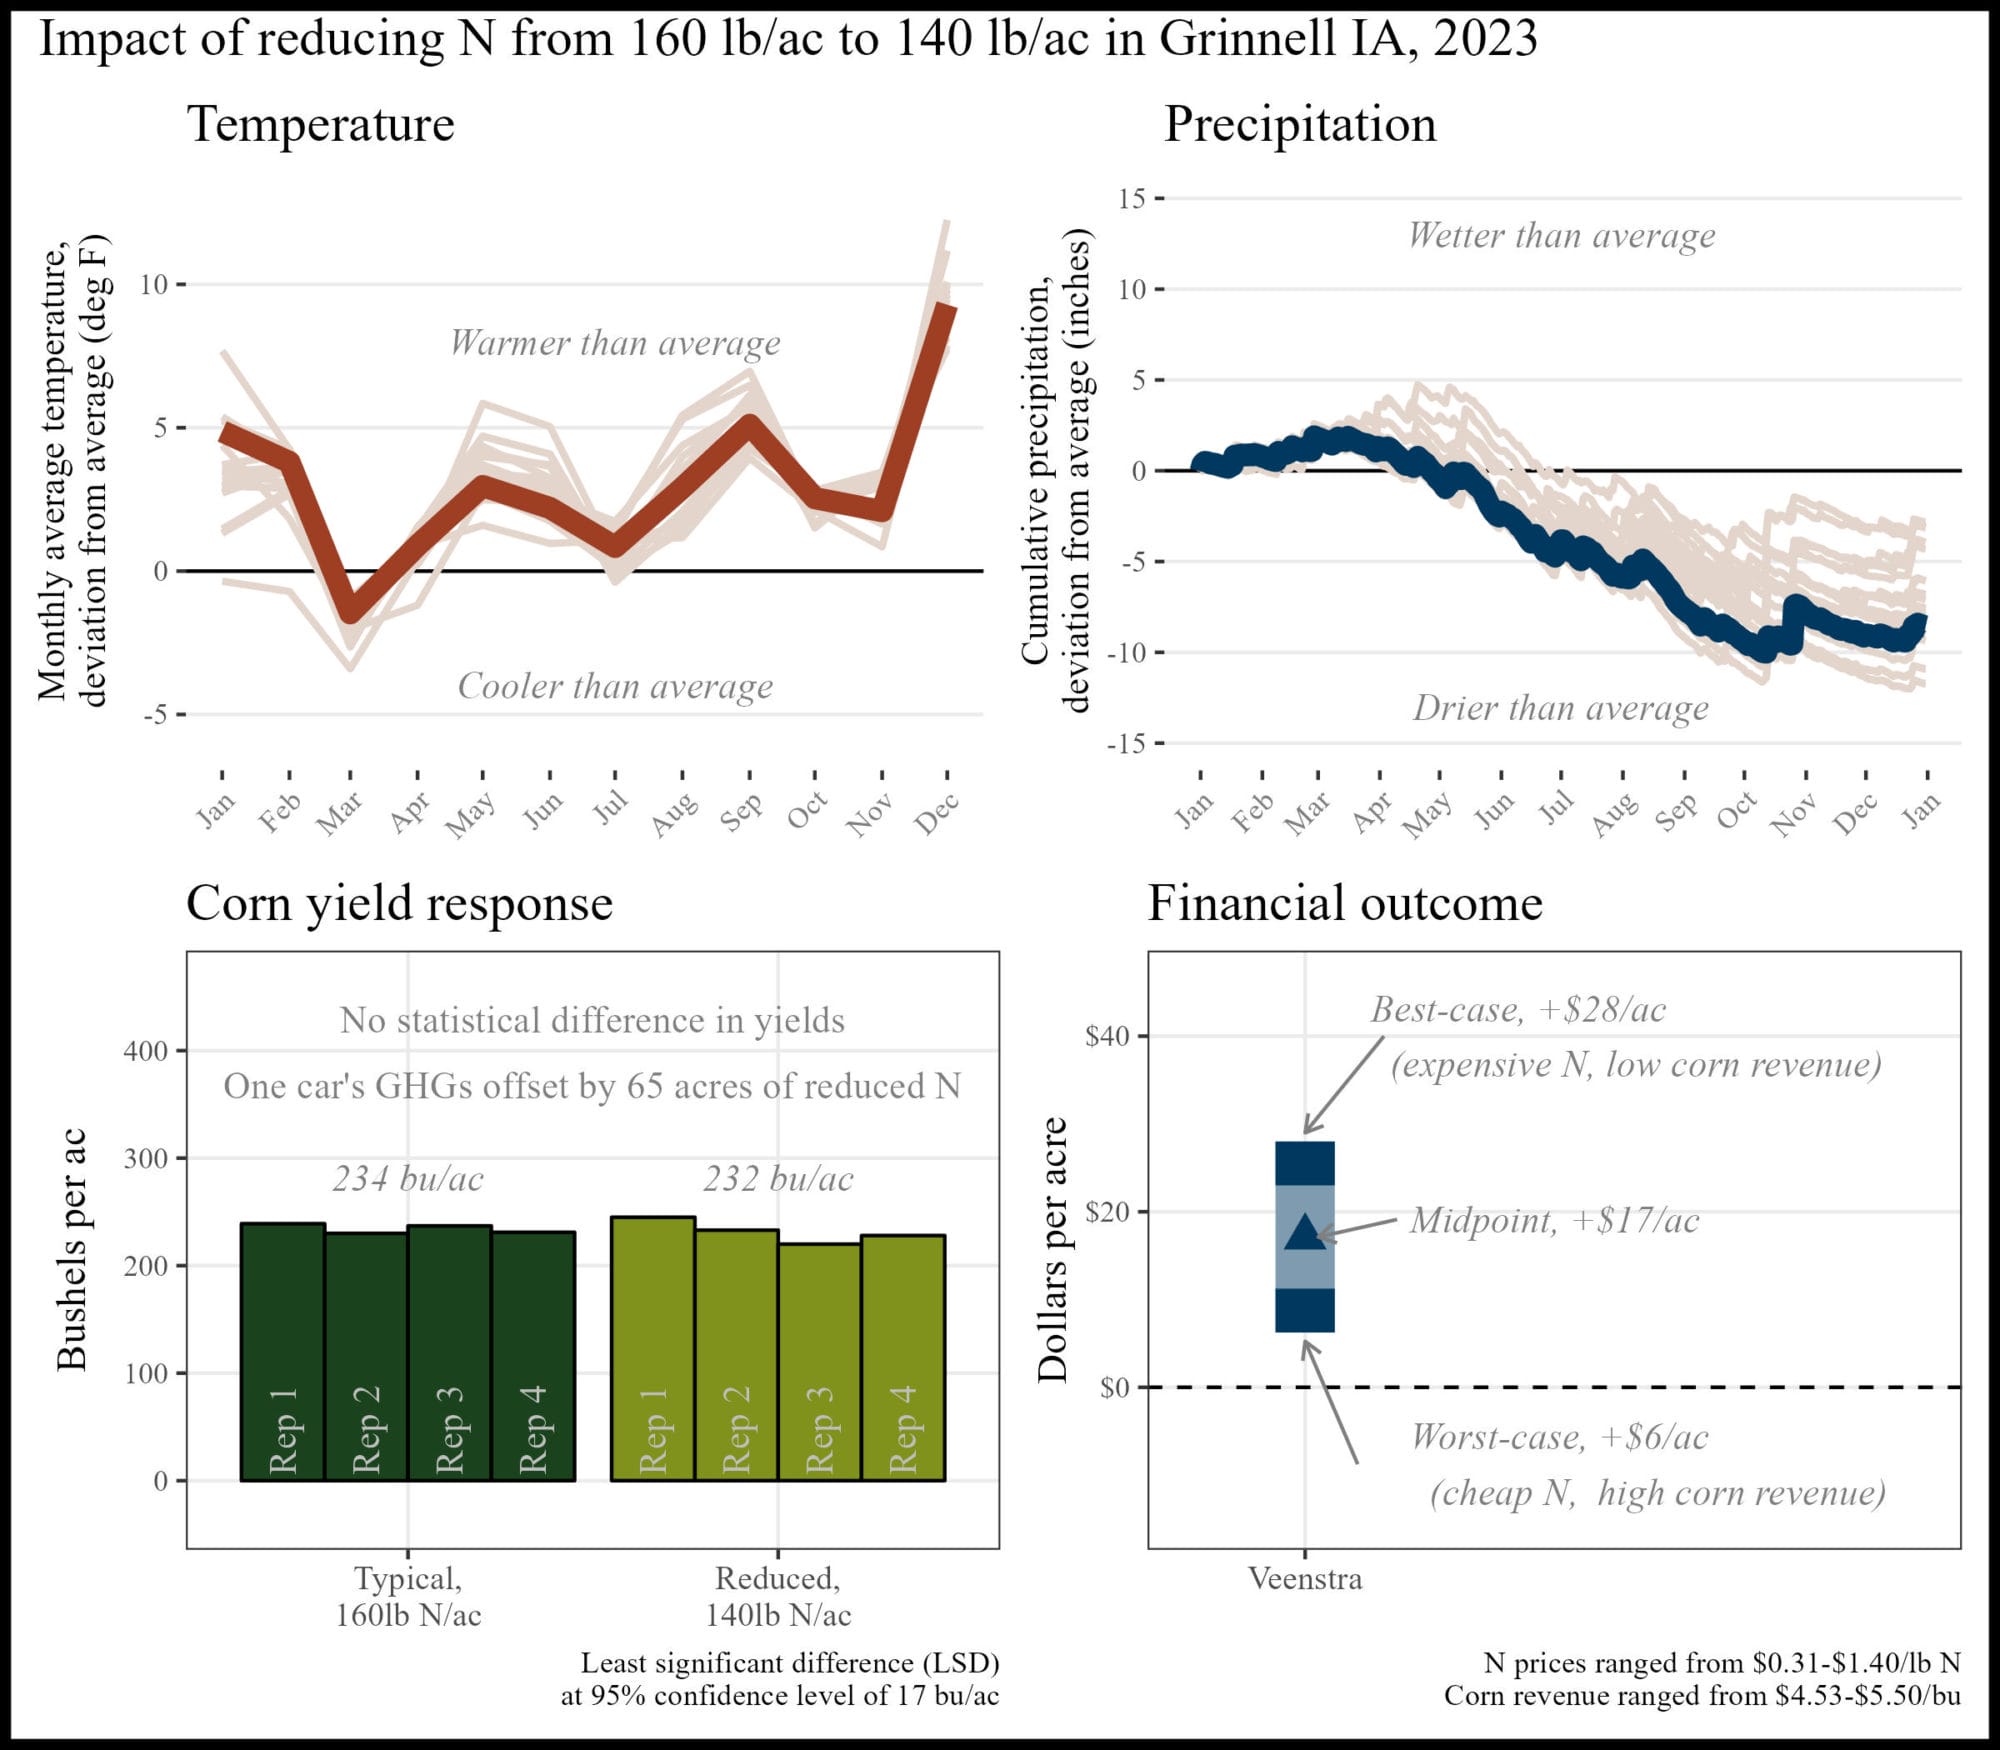
Appendix S. Kevin Veenstra; Grinnell, IA
The financial outcome at the reduced N rate was likely a financial savings compared to the typical N rate. A 20 lb N/ac reduction saved money this year, and, when applied to at least 65 acres, could offset the average annual GHGs of one vehicle.
Appendix T. Detailed Methods
All data and code are available in a publicly available github repository: https://github.com/vanichols/PFI_CanWeReduceN Weather data Each cooperator chose a US Census-recognized town with which to associate their trial. The latitude and longitude of the chosen town were used to retrieve weather data from the National Aeronautics and Space Administration (NASA) Prediction of Worldwide Energy Resources (POWER) project using the nasapower package [7] for R software [8]. Data was downloaded for the period spanning January 1, 1994 through December 31, 2024. Two weather variables were used: (1) cumulative daily precipitation values and (2) the average daily air temperature at two meters above ground level. The weather data was separated into two data sets: one comprising the entire 30 years of data (historical weather data), and one containing only data from January 1 – December 31, 2024 (trial year data). To provide context for each trial’s temperatures, the historical mean temperature for month at a given site was calculated using the historical weather dataset. The historical value was subtracted from the trial year average temperature for that month to provide an estimate of the deviation from average conditions. GHG Emissions Both direct and indirect (volatilization, leaching) N2O emissions were considered in these calculations. Additionally, although N2O emissions do vary by the form of N fertilizer used, in this trial farmers only adjusted chemical forms of N fertilizer, and the variation between chemical fertilizer types was small compared to the absolute estimates (~1%), so an average of the fertilizer types was used. Funding Acknowledgement This material is based upon work supported by the U.S. Department of Agriculture, under agreement number NR216114XXXXG003, and by The Foundation for Food & Agriculture Research (FFAR). Any opinions, findings, conclusions, or recommendations expressed in this publication are those of the author(s) and do not necessarily reflect the views of the U.S. Department of Agriculture or FFAR. In addition, any reference to specific brands or types of products or services does not constitute or imply an endorsement by the U.S. Department of Agriculture or FFAR for those products or services. USDA is an equal opportunity provider, employer, and lender. References [1] G. Nichols and S. Gailans, “Can We Reduce N Rates and Improve ROI?,” Practical Farmers of Iowa, 2023. Accessed: Mar. 28, 2024. [Online]. Available: https://practicalfarmers.b-cdn.net/wp-content/uploads/2023/07/22.FC_.Can-WeReduceN.pdf [2] “IPCC Fourth Assessment Report: Climate Change 2007.” Intergovernmental Panel on Climate Change, 2007. Accessed: Mar. 28, 2024. [Online]. Available: https://archive.ipcc.ch/publications_and_data/ar4/wg1/en/ch2s2-10-2.html [3] “GREET.” U.S. Department of Energy, 2022. Accessed: Mar. 28, 2024. [Online]. Available: https://www.energy.gov/eere/greet [4] “Greenhouse Gases Equivalencies Calculator - Calculations and References.” U.S. Environmental Protection Agency, 2024. Accessed: Mar. 28, 2024. [Online]. Available: https://www.epa.gov/energy/greenhouse-gases-equivalencies-calculator-calculations-and-references [5] “Good Practice Guidance and Uncertainty Management in National Greenhouse Gas Inventories,” Intergovernmental Panel on Climate Change, 2000. Accessed: Mar. 28, 2024. [Online]. Available: https://www.ipcc-nggip.iges.or.jp/public/gp/english/ [6] “Greenhouse Gas Emissions from a Typical Passenger Vehicle.” U.S. Environmental Protection Agency, 2024. Accessed: Mar. 28, 2024. [Online]. Available: https://www.epa.gov/greenvehicles/greenhouse-gas-emissions-typical-passenger-vehicle [7] A. Sparks, “nasapower: A NASA POWER Global Meteorology, Surface Solar Energy and Climatology Data Client for R,” J. Open Source Softw., vol. 3, no. 30, 2018, doi: doi.org/10.21105/joss.01035. [8] R Core Team, “R: A language and environment for statistical computing.” R Foundation for Statistical Computing, Vienna, Austria, 2022. Accessed: Mar. 28, 2024. [Online]. Available: https://www.r-project.org/