In a Nutshell:
- Twenty-four farmers performed 27 replicated strip trials testing their typical nitrogen (N) rate against that rate reduced by an amount of their choosing.
- 10 of the 24 farmers also compared their typical and reduced N rate application against a control with no N applied.
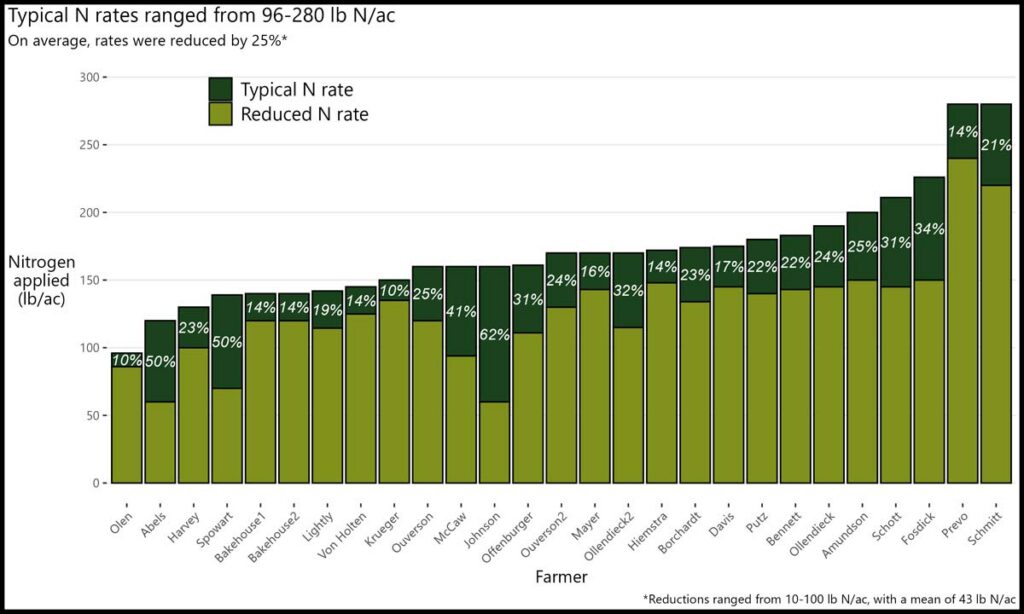
- Farmers chose to test N reductions ranging from 10-100 lb N/ac (reducing 10-62% of typical rate).
- Most farms have routinely used cover crops in the past five years (24), while some used a diversified crop rotation (2), applied manure (6), or incorporated grazing (2). Farms were predominantly in no-till with some occasionally including strip-till.
Key Findings:
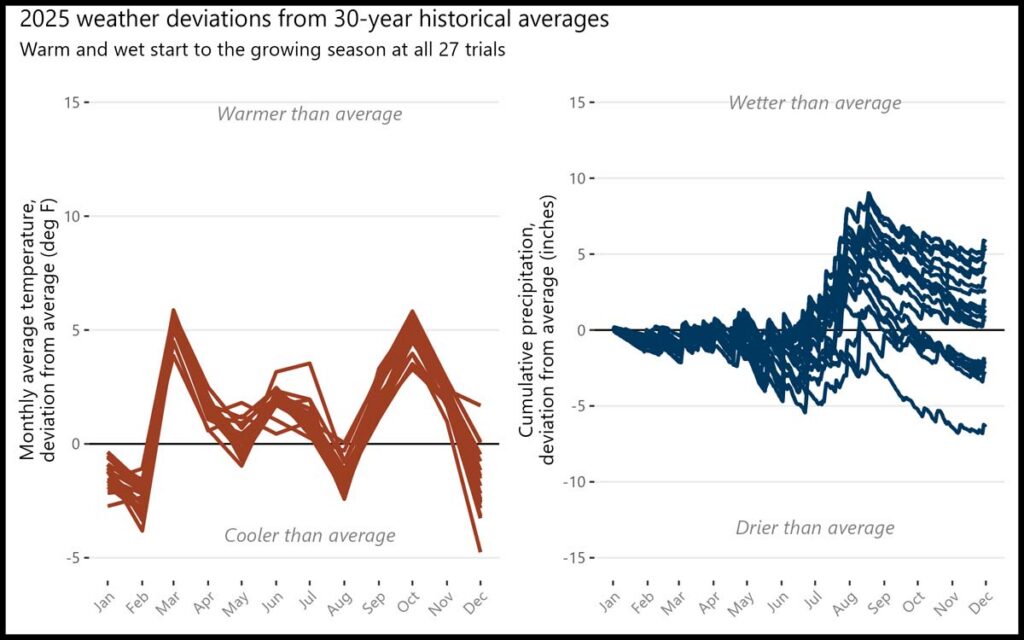
- All sites experienced above-average temperatures in early spring (March-April) and again in early Fall (September-November).
- Most sites shifted to wetter-than-average conditions beginning in mid- to late July, with cumulative precipitation remaining above the 30-year average through August and into early fall.
- Nineteen of the 27 trials potentially saved money when reducing their N rates.
Background
The 2025 round of nitrogen fertilizer rate trials builds on key questions first explored when the project began in 2022: Can farmers reduce nitrogen (N) rates while maintaining corn yields and profitability? [1], [2], [3]. The current set of trials, initiated in 2024 in preparation for the 2025 growing season, involved farmers across Iowa, Illinois, Minnesota and Wisconsin. Most participating farmers reported using soil-health promoting practices for at least five years. Using replicated strip-trial designs, they compared yields, financial outcomes and greenhouse gas emissions at their typical N rate with outcomes at a reduced rate of their choosing. A major intent of the project is to encourage farmers to test N rates outside of their usual comfort zones.
As in the 2024 growing season, the 2025 trials included strips receiving no applied nitrogen (0) to serve as a true control [3]. This zero-nitrogen benchmark improves understanding of how much yield comes from soil-supplied N versus fertilizer inputs. Including the 0N treatment also strengthens the experiment by helping farmers better interpret the effects of their typical and reduced N rates [4].
If farmers maintain yields and/or reduce costs at the lower N rate, these findings may build confidence to reduce – or at least reevaluate – their fertilizer rates in the future. Conversely, if reducing N results in lower yields and reduced profitability, farmers still gain valuable information: they can be more confident that their current N rate is appropriate for their farm. However, adoption of long-term soil health–building practices may create opportunities to safely reduce N rates in the future. “I need proof to make an educated decision in regards to nitrogen applications”, said Jeff Schmitt at the onset of the trial.
Methods
Design
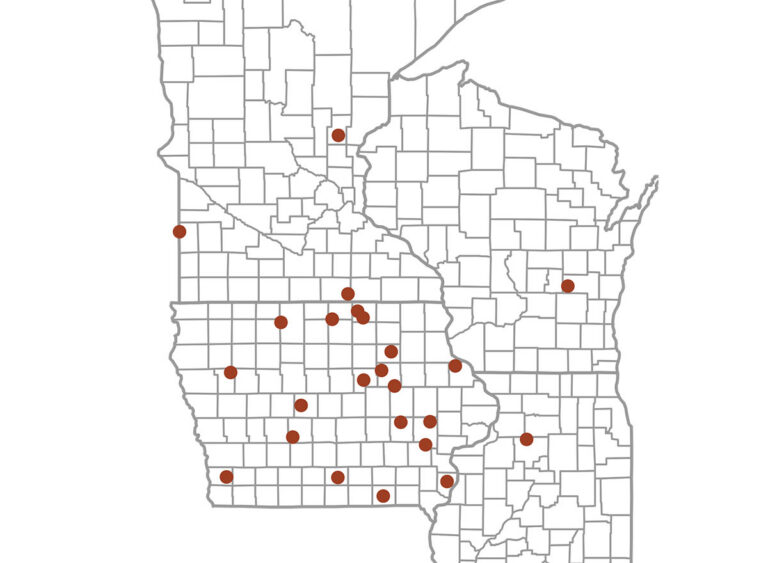
Cooperating farms in 2025 were located across Iowa (19), Illinois (1), Minnesota (3) and Wisconsin (1). All treatments were applied at least four times, resulting in a total of at least eight strips in each farmer’s trial (Figures 1 and 2).
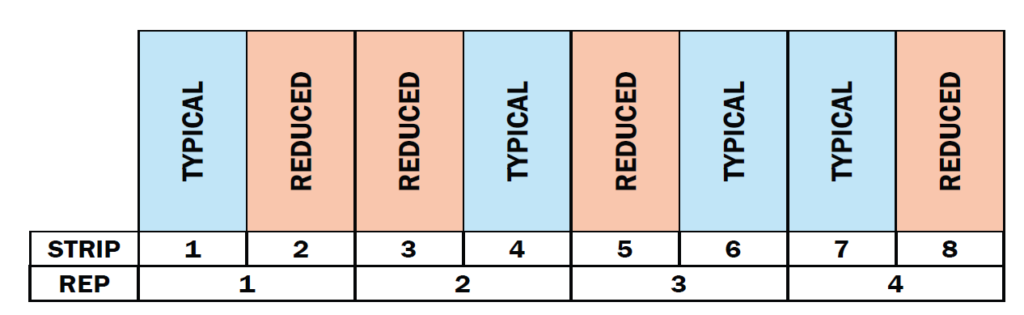
Fifteen farmers used two-treatments:
- Typical – Their typical N fertilizer rate applied to a corn crop.
- Reduced – An N fertilizer rate less than the typical rate.
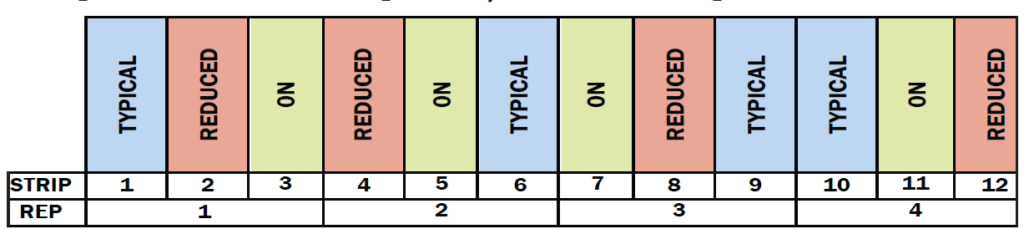
Seven farmers used three treatments:
- Typical – Their typical N fertilizer rate applied to a corn crop.
- Reduced – An N fertilizer rate less than the typical rate.
- 0N – No applied N fertilizer or manure
Two farmers tested both designs, running two different trials on their farms.
Measurements
Farmers recorded the timing, type (chemical, organic), amount of N applied, and price per unit of N for each treatment. Corn yields were measured and reported by each farmer, along with the percent moisture of the harvested grain. All yields were converted to 15.5% moisture for this report. Additionally, most farmers reported approximate prices received per bushel of corn.
Data analysis
Note that more details on data analysis can be found in the Appendix Y. Detailed Methods section at the end of this report.
Weather
To provide context for the results, weather data was downloaded from the National Aeronautics and Space Administration (NASA) Prediction of Worldwide Energy Resources (POWER) project (https://power.larc.nasa.gov/) for each farmer’s trial.
Yields
For both the two-treatment and three-treatment (0N) designs, yield differences at each trial were assessed for statistical significance using a statistical model. The model tested for the effect of the N treatment, while accounting for possible natural yield gradients in the field and, in some cases, missing data. Significance was assigned using 95% confidence level threshold, meaning we are 95% sure the differences observed were ‘real.'
Finances
Nitrogen prices depend on several factors including the form of N, the timing of the purchase and the location of the purchase. Similarly, the price received for corn fluctuates throughout the year. Due to this variation, as well as the limited control farmers have over the price paid for N and the price received for corn, we used three price scenarios to compare financial outcomes of the typical and reduced N treatments: best-case savings, midpoint savings, and worst-case savings (Table 1). Using the data provided by the farmers, we took the lowest and highest farmer reported prices for the N source they adjusted to create their two rate treatments, and the lowest and highest reported prices received for corn – these values were used to construct the price scenarios.
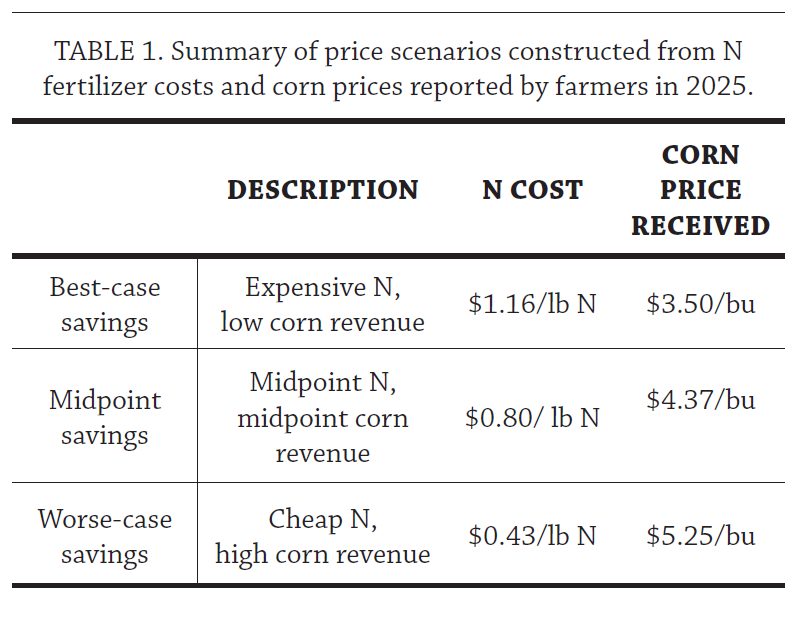
A partial budget using a given price scenario was performed for each treatment. Costs were estimated as the amount of N applied in that treatment multiplied by the assumed N cost, which depended on the scenario (Table 1). If the yields of each treatment were statistically different, each treatment’s yields were used for corn revenue calculations. If there was no statistical difference in treatment yields, the overall mean yield for the trial was used for corn revenue calculations. Partial net revenue for each treatment was calculated by subtracting the costs (N applied multiplied by N cost) from the revenue (yield multiplied by corn price). The difference between partial net revenues for the ‘reduced’, ‘typical’ and ‘zero’ treatments were calculated and reported. A positive value therefore represents financial savings at the reduced N rate. This process was done separately for the three price scenarios.
Greenhouse gas emissions
When a farmer reduces the amount of chemical N fertilizer applied to a field, two sources of greenhouse gas (GHG) emissions associated with crop production are avoided: the GHGs (expressed as carbon dioxide equivalents, CO2e) released during fertilizer manufacturing processes, and the nitrous oxide (N2O) released from the soil due to biological processes driven by N application. To convert N2O to CO2e, a 100-year time horizon was assumed based on intergovernmental Panel on Climate Change (IPCC) recommendations [5]. Over the period of 100-years, one pound of N2O will have a forcing potential equal to 298 pounds of CO2e [5].
The CO2 released during fertilizer manufacturing was estimated using two values: (1) energy used to manufacture nitrogen fertilizers as reported from the 2022 GREET® (Greenhouse gases, Regulated Emissions, and Energy use in Technologies) model, developed by the Department of Energy’s Argonne National Laboratory (58 MJ/kg N) [6], and (2) the amount of CO2e released per MJ of energy used as reported by the Environmental Protection Agency [7]. The avoided N2O as a result of decreased N application was estimated using the IPCC methodologies for both direct and indirect agricultural N2O emissions [8]. All above calculations can be simplified to a constant conversion factor: the pounds of N reduced per acre from the typical rate can be multiplied by 7.82 to get pounds of CO2e avoided per acre.
The acres needed to reduce a given amount of N application to equate to the emissions generated by a single United States (US) vehicle were calculated using the EPA’s estimates for vehicle emissions [9]. The EPA uses statistics to represent an average US gasoline vehicle (22 miles per gallon, driven 11,500 miles per year), and estimates the emissions from one vehicle using those values (estimated to be 10,141 lb CO2e/year) [9].
Results and Discussion
Treatments
Twenty-four farmers conducted a total of 27 independent N trials. The chosen treatments reflected the diversity in farming systems, with typical N rates ranging from 96-280 lb N/ac and reduced N rates ranging from 60-240 lb N/ac (Figure 3). When averaged over all trials, typical and reduced N rate treatments were 171 lb N/ac and 128 lb of N/ac, respectively, for an average reduction of 43 lb N/ac.
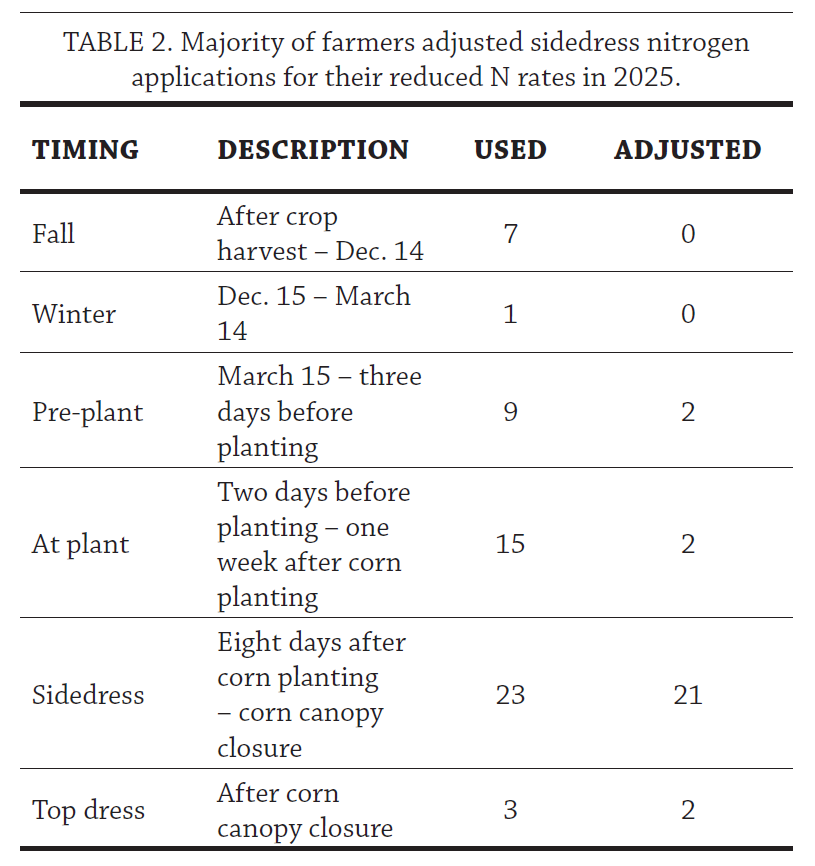
Farmers used a variety of N application timings in their production systems, with most using sidedressing. For the reduced N treatment, 21 of the 27 trials chose to reduce N rates during sidedressing, while keeping other applications constant (Table 2).
Weather
All sites experienced above-average temperatures in early spring (March-April) and again in early Fall (September-November). Most sites shifted to wetter-than-average conditions beginning in mid- to late July, with cumulative precipitation remaining above the 30-year average through August and into early fall.
Yields
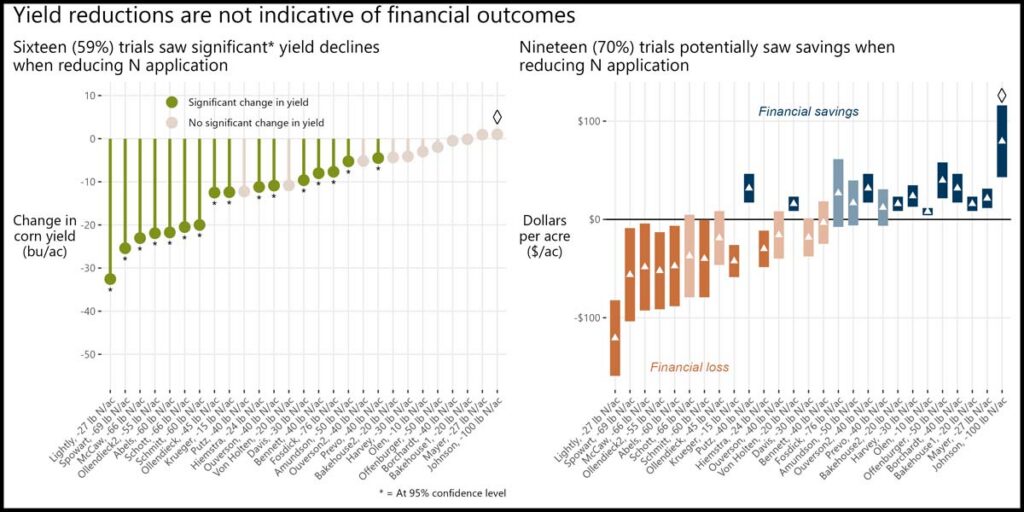
Sixteen of the 27 replicated strip trials (56%) saw statistically significant reductions in corn yields at the reduced N rate. However, it is important to note that statistical significance in yield declines is not related to financial outcomes (Figure 5, left panel). Statistical significance is a function of both the magnitude of the difference in treatments, as well as how variable the yields in the field were. It helps readers and farmers decide how much to ‘trust’ the yield changes, and therefore how to calculate financial outcomes. For example, Matt Ollendieck’s reduced N treatment yielded 12 bu/ac less than his typical N treatment, and this reduction was statistically significant, so he can be confident that reduction was real. In contrast, Ben Offenburger’s trial showed only a 2 bu/ac reduction at the reduced N rate, and this difference was not statistically significant. This indicates that yield variability among strips was greater at Ollendieck’s site than at Offenburger’s. While they may have different conclusions about the impact of the reduced N treatment on corn yields, they both saw potential financial savings at the reduced N rate (Figure 5, right panel).
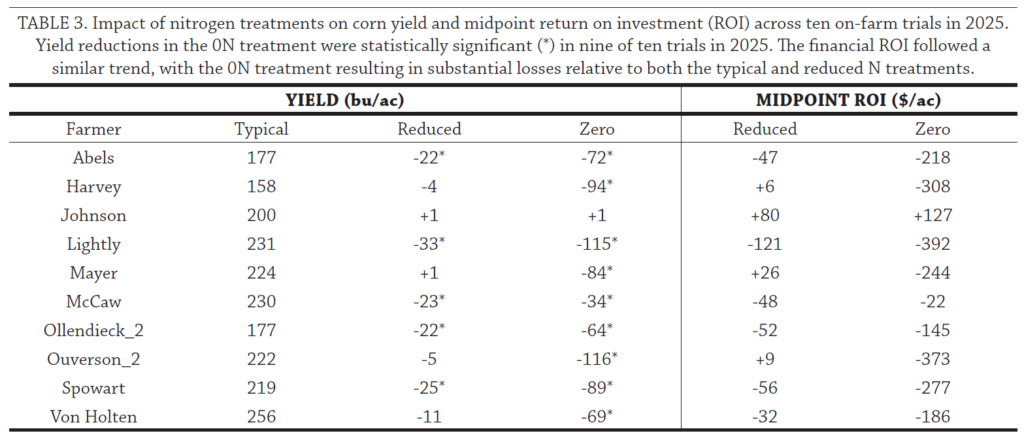
The addition of a zero-nitrogen (0N) treatment this year, used by ten farmers participating in this research, provided further insights into nitrogen’s role in corn production. Nine of the ten farmers experienced statistically significant reductions in yield when comparing their 0N with the typical N treatment. Yield declines at 0N treatment ranged from -34 to -116 bu/ ac when compared to the typical N rate (Table 3). Financially, the 0N resulted in substantial revenue losses across nine trials, with midpoint ROI reductions ranging from -$22 to -$392/ ac compared to the typical N rate. Despite the yield declines and revenue losses, the 0N provided valuable insights into the baseline productivity of these fields in the absence of synthetic nitrogen inputs.
Finances
The financial outcomes of reducing applied N varied by trial and price scenario (Figure 5, right panel). Eleven trials saved money in the reduced N treatment compared to the typical N treatment regardless of the price scenario (Table 1). An additional eight trials showed potential for savings under at least one price scenario. For example, Michael Fosdick saved $61/ac in the best-case scenario, $27/ac in the mid-point scenario, but lost $8 in the worst-case scenario. Eight trials lost money in every price scenario. In this set of trials, the worst potential financial loss observed was $159/ac (Lightly’s worst-case scenario), and the best potential financial savings was $116/ac (Johnson’s best-case scenario).
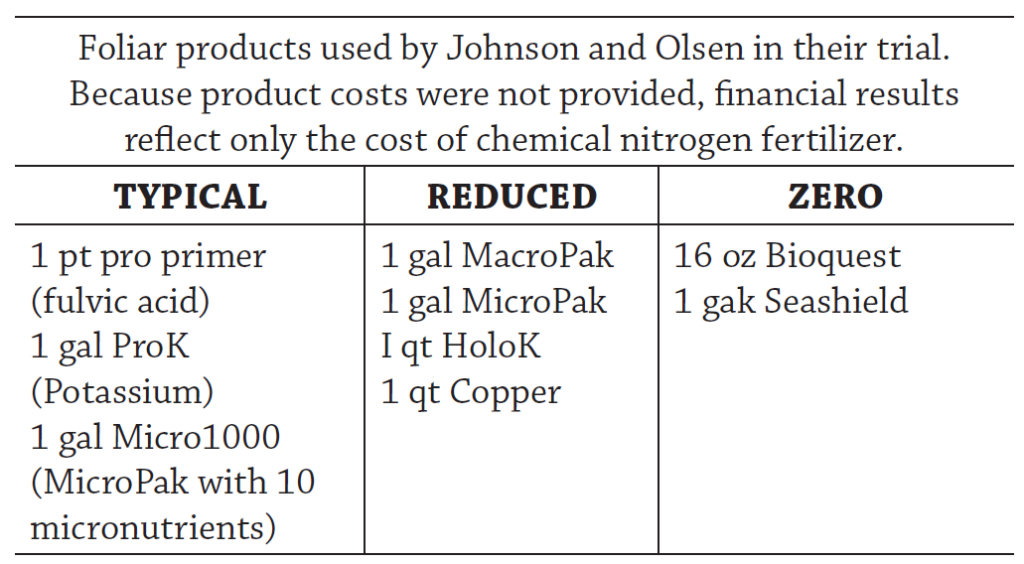
◊Johnson’s site received foliar applications of various nutrients and microbial products that could have influenced his results. See appendix J for more details.
Conclusions and Next Steps
Of the 27 replicated strip-trials, nineteen potentially saved money in the reduced N treatment (any part of the bars above the zero line in the right panel of Figure 5). More specifically, eleven trials saved money under all three price scenarios, three trials saved money under best- and mid-point price scenarios, and five trials saved money only under the best-case price scenario. Eight trials likely lost money in the reduced N treatment under all price scenarios.
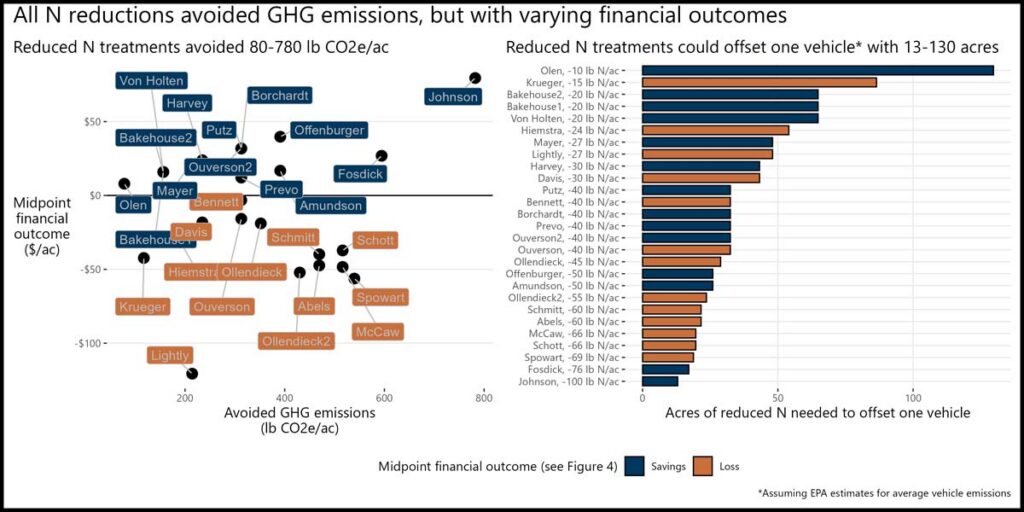
All trials avoided GHG emissions by reducing N fertilizer and 14 of the 27 trials could do so while also saving money under the mid-point scenario (left pane of Figure 6). To offset the emissions of a single vehicle, those farmers would have to apply their reduced N rate to 13-130 acres on their farms. That is a climate-smart win-win for farming and the environment.
The fourth year of the N rate trials builds upon prior findings, further evaluating the economic and environmental implications of reduced nitrogen (N) applications in corn production. Although weather variability and other uncontrollable factors continue to influence outcomes, ongoing data collection will strengthen our understanding of how soil health–building practices contribute to more resilient and sustainable corn systems across the Midwest. As participant Chris Von Holten noted, “By increasing the soil biologically I can lower my N rates and still maintain good yields.” Continued multi-year evaluation will allow us to better account for interannual variability and refine management recommendations, ensuring that conclusions are supported by a robust dataset rather than isolated seasonal conditions.
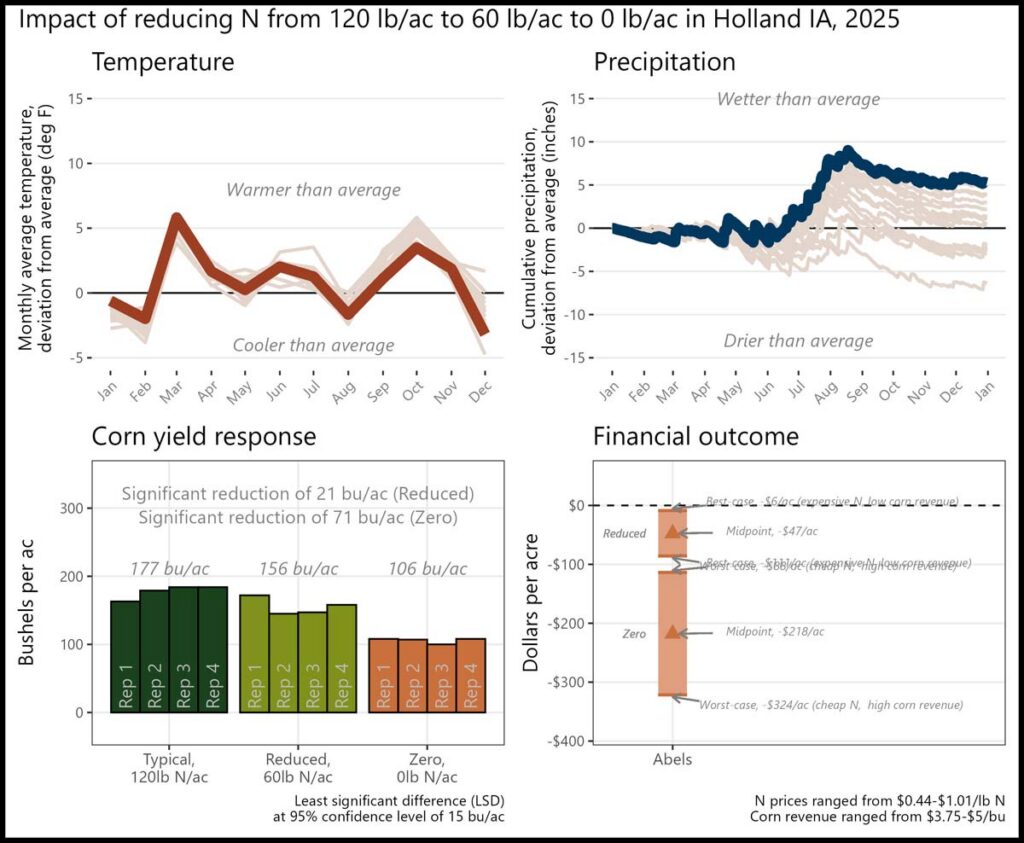
Appendix A. Fred Abels; Holland, IA
[From conducting this trial] you can see how good your land is, and practices that you do.
The financial outcome at both the reduced N rate and zero N rate resulted in a financial loss compared to the typical N rate. A reduction of 60 lb N/ac was likely too large this year, but there may be potential financial savings with a smaller N reduction. While considerable yield losses are expected when no nitrogen is applied, the 0N treatment is important for understanding the full impact of nitrogen on yield and profitability.
Historical cropping system (5 year): No-till soybeans and corn; cereal rye cover crop
Previous crop: Soybeans
Strip size: 0.81 ac
Corn planting/harvest date: May 12/October 31
Corn row spacing/planting density: 30 in; 34,000 seeds/ac
Nitrogen sources and timing: Chemical; Pre-plant, sidedress
Appendix B. Alec Amundson; Osage, IA
Nitrogen is a moving target we need to continue to test and learn so we can manage it better.
The financial outcome at the reduced N rate was likely a financial savings compared to the typical N rate. A 50 lb N/ac reduction saved money this year, and, when applied to at least 26 acres, could offset the average annual GHGs of one vehicle.

Historical cropping system (5 year): No-till corn and soybeans; diverse mix and cereal rye cover crops
Previous crop: Soybeans
Strip size: 2 ac
Corn planting/harvest date: May 4/October 8
Corn row spacing/planting density: 30 in; 34,500 seeds/ac
Nitrogen sources and timing: Chemical; Fall, At plant, sidedress, top dress
Appendix C. Jon Bakehouse; Hastings, IA
As we hone in on the best rates, the trials have given me confidence to trim them beyond what I may have been comfortable with.
The financial outcome at the reduced N rate was likely a financial savings compared to the typical N rate in both trials. A 20 lb N/ac reduction saved money this year, and, when applied to at least 65 acres, could offset the average annual GHGs of one vehicle.
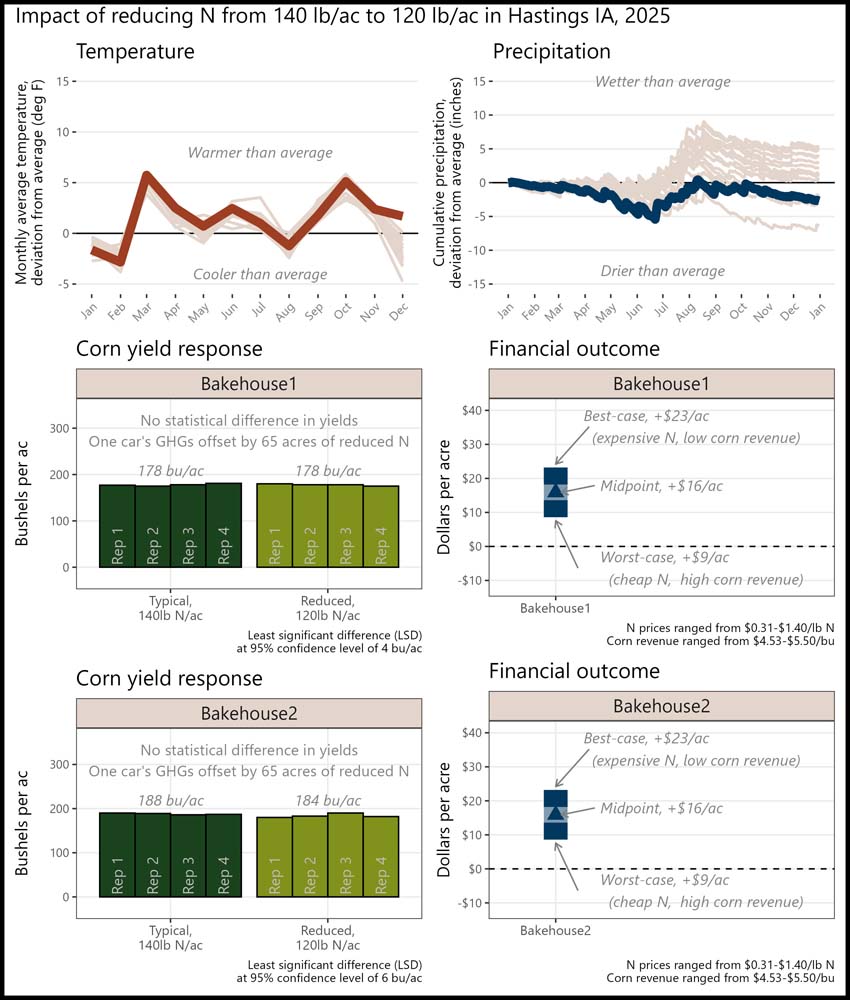
Historical cropping system (5 year): No-till corn and soybeans; cereal rye cover crop
Previous crop: Soybeans
Strip size: 1.45 ac (field 1) and 0.77 ac (field 2)
Corn planting/harvest date: April 29/October 1
Corn row spacing/planting density: 30 in; 33,400 seeds/ac
Nitrogen sources and timing: Chemical; Pre-plant, sidedress
Appendix D. Sam Bennett, Galva, IA
Adding a year of data to my own set of trials, as well as comparing the data of other repeat cooperators, helps me to gauge the weather year's effect on optimum N rate.
The financial outcome at the reduced N rate was likely a financial loss. A 40 lb N/ac reduction was likely too large this year, but a smaller N reduction could bring financial savings.
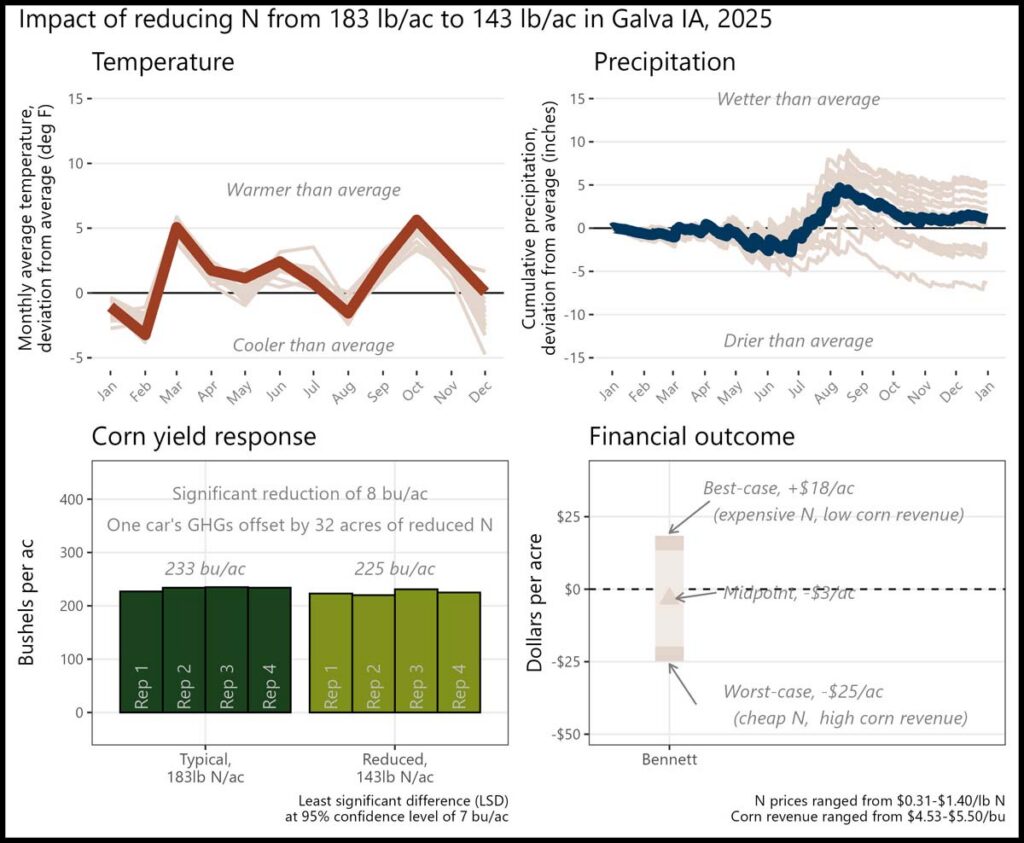
Historical cropping system (new field): No-till corn and soybeans; cereal rye cover crop; chicken/turkey litter application
Previous crop: Soybeans
Strip size 1 ac
Corn planting: May 14/October 16
Corn row spacing/planting density: 30 in; 36,000 seeds/ac
Nitrogen sources and timing: Organic – Fall; Chemical – At plant; sidedress
Appendix E. Vaughn Borchardt; Fenton, IA
[The most valuable aspect of conducting this trial was] being aware of N rates on yields.
The financial outcome at the reduced N rate was likely a financial savings compared to the typical N rate. A 40 lb N/ac reduction saved money this year, and, when applied to at least 32 acres, could offset the average annual GHGs of one vehicle.
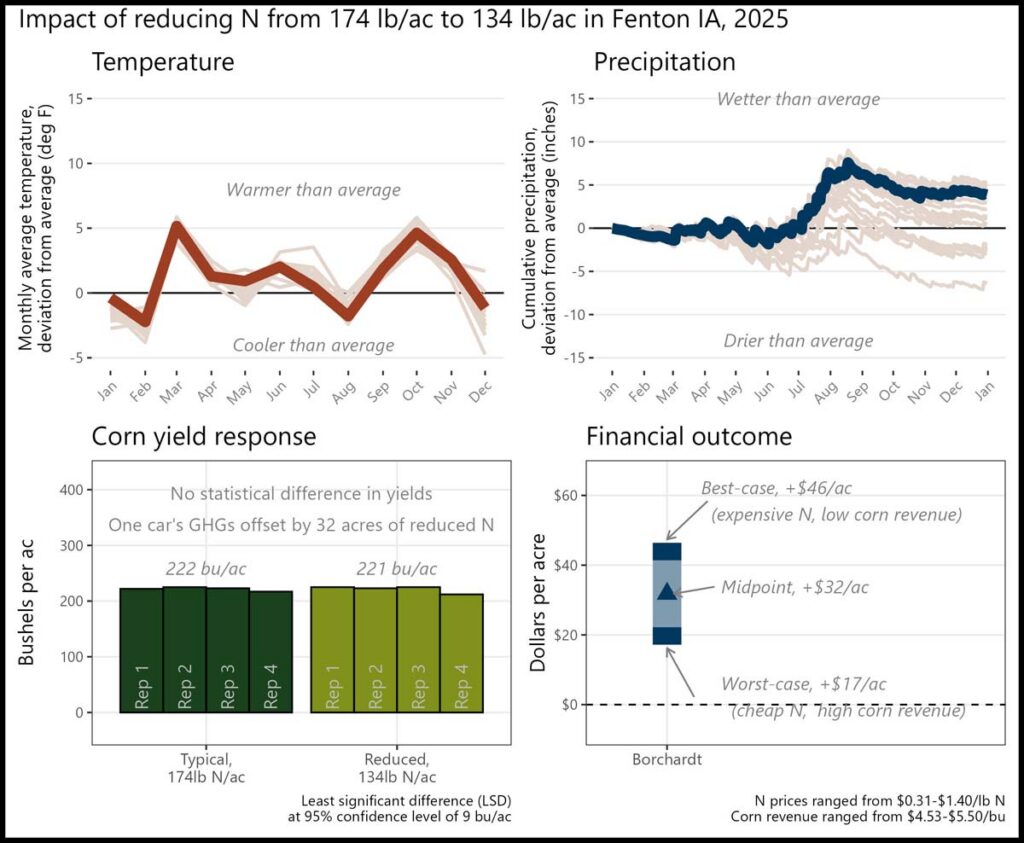
Historical cropping system (5 year): Strip-till corn and soybeans
Previous crop: Soybeans
Strip size: 0.76 ac
Corn planting/harvest date: May 5/Oct. 14
Corn row spacing/planting density: 30 in; 34,500 seeds/ac
Nitrogen sources and timing: Chemical; Pre-plant, sidedress
Appendix F. Emery Davis; Solon, IA
This trial showed that I'm probably in the sweet spot for nitrogen use so I probably shouldn't reduce the rate further.
The financial outcome at the reduced N rate was likely a financial loss. A 30 lb N/ac reduction was likely too large this year, but a smaller N reduction could bring financial savings.

Historical cropping system (5 year): No-till corn, soybeans and wheat; cereal rye and red clover cover crops
Previous crop: Wheat
Strip size: 1 ac
Corn planting/harvest date: April 28/NA
Corn row spacing/planting density: 30 in; 34,000 seeds/ac
Nitrogen sources and timing: Chemical; At-plant, sidedress, top dress
Appendix G. Michael Fosdick; Sperry, IA
"Reduce up front N and keep split application" are the likely changes Fosdick will apply to his farm after conducting his trial.
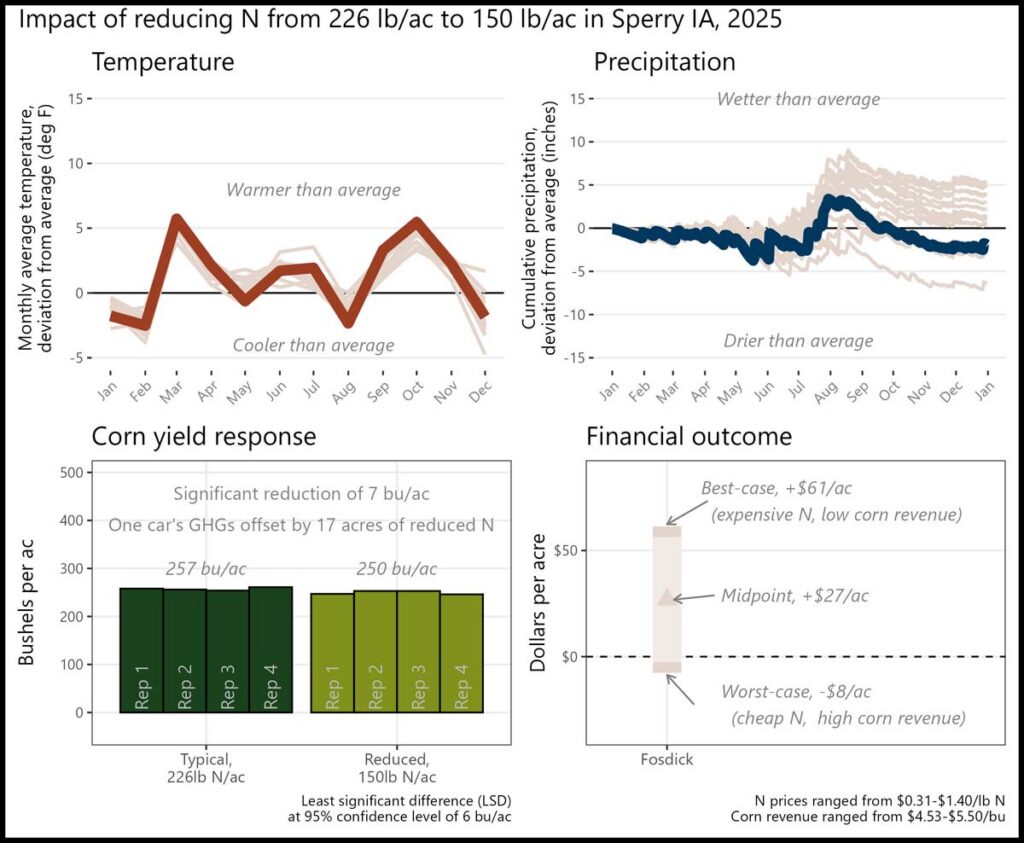
Historical cropping system (5 year): No-till/Strip-till corn and soybeans; cereal rye
Previous crop: Soybeans
Strip size: 1.2 ac
Corn planting/harvest date: April 16/September 27
Corn row spacing/planting density: 30 in; 33,800 seeds/ac
Nitrogen sources and timing: Chemical; Fall, at plant, sidedress
Appendix H. Robert Harvey; Redfield, Iowa
The financial outcome at the reduced N rate was likely a financial savings compared to the typical N rate. A 30 lb N/ac reduction saved money this year, and, when applied to at least 43 acres, could offset the average annual GHGs of one vehicle. The financial outcome at the zero N rate resulted in a financial loss compared to the typical N rate. While considerable yield losses are expected when no nitrogen is applied, the 0N treatment is important for understanding the full impact of nitrogen on yield and profitability.
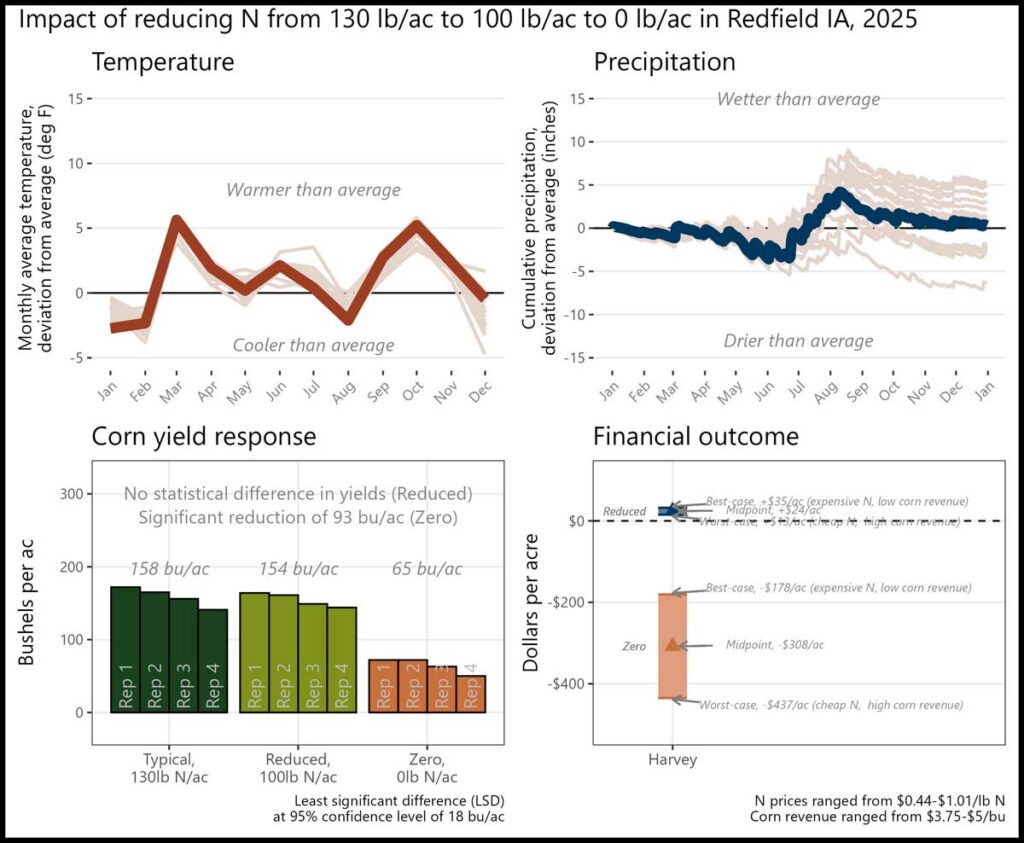
Historical cropping system (5 year): Corn-soybeans; cereal rye cover crop
Previous crop: Soybeans
Strip size: 0.80 ac
Corn planting/harvest date: April 28/October 9
Corn row spacing/planting density: 30 in; 30,O00 seeds/ac
Nitrogen sources and timing: Chemical; Winter, sidedress
Appendix I. Josh Hiemstra; Brandon, WI
"Learning how to be more profitable while being environmentally responsible" was the most valuable aspect of this trial for Josh.
The financial outcome at the reduced N rate was likely a financial loss. A 24 lb N/ac reduction was likely too large this year, but a smaller N reduction could bring financial savings.
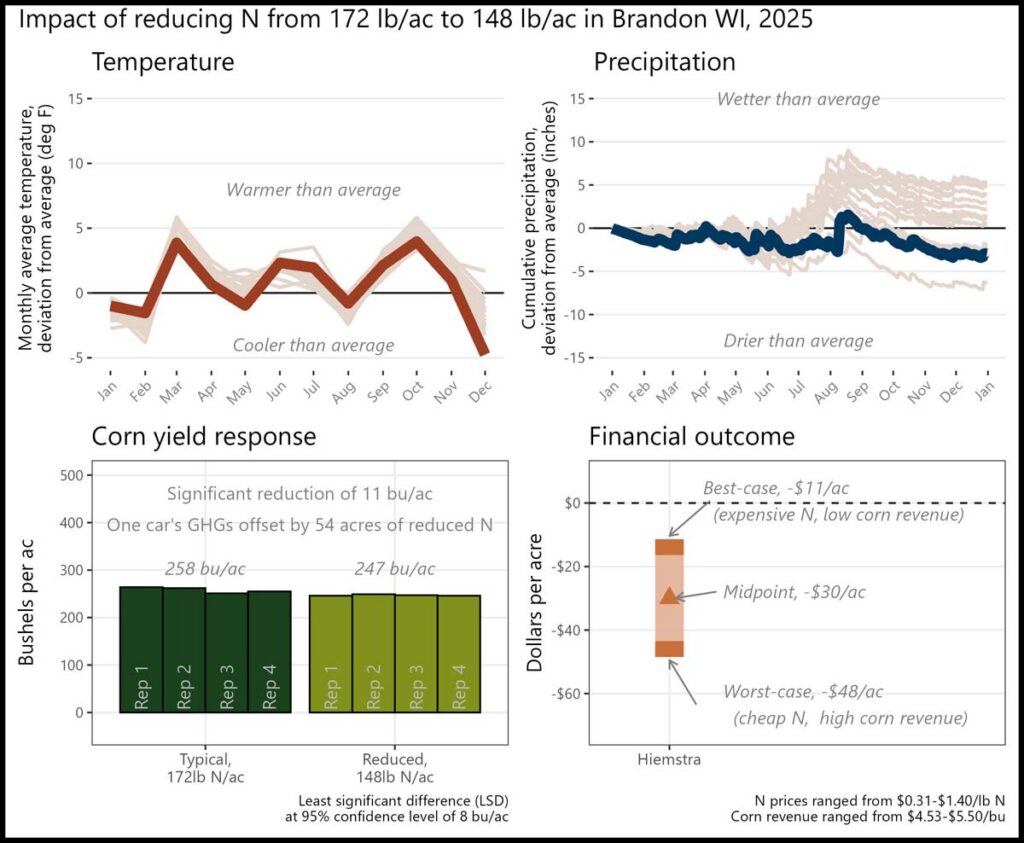
Historical cropping system (5 year): Corn (silage)-Winter Wheat-Soybeans; cereal rye and cover crop mixes
Previous crop: Corn (silage)
Strip size: 0.31 ac
Corn planting/harvest date: May 7/October 1
Corn row spacing/planting density: 30 in; 32,800 seeds/ac
Nitrogen sources and timing: Organic – Fall; Chemical – Preplant, at plant, sidedress
Appendix J. Chad Olsen and Trent Johnson; Hendricks, MN
I'm getting a better idea of what my operation fertility needs. I'm finding that it isn't just soil type but the organic matter as well.
The financial outcome at both the reduced N rate and zero N rate resulted in a financial savings compared to the typical N rate. A 100 lb N/ac reduction saved money this year, and, when applied to at least 13 acres, could offset the average annual GHGs of one vehicle.
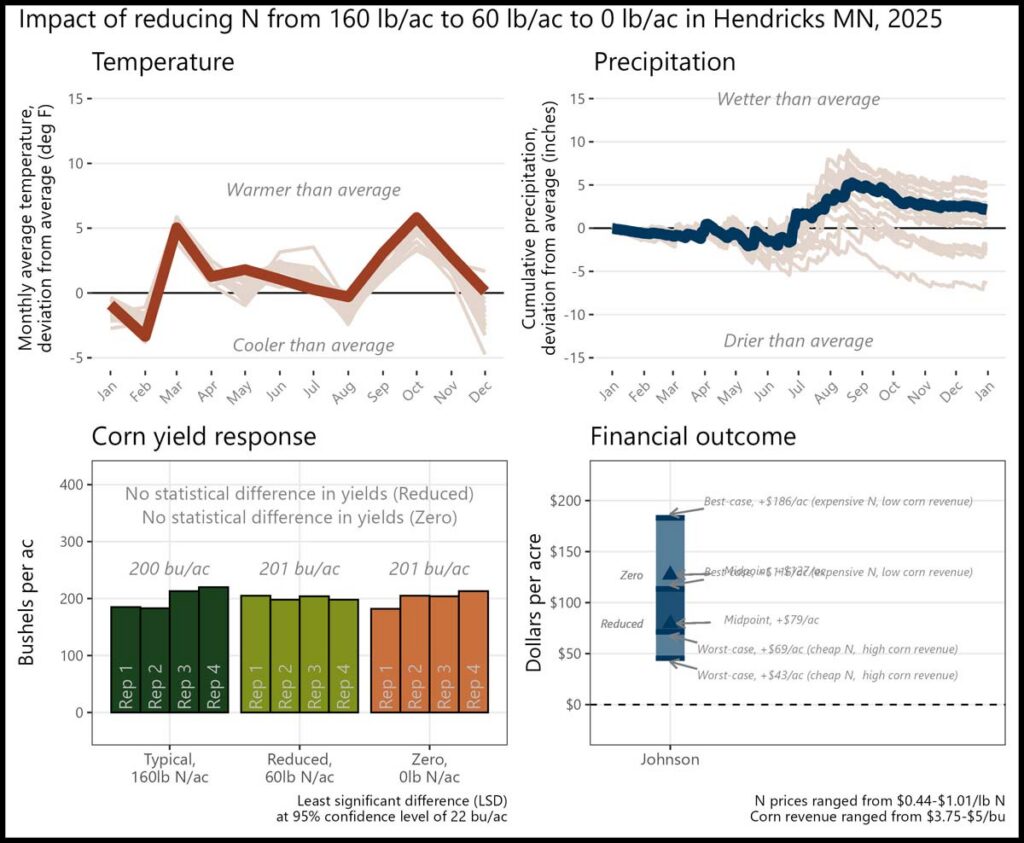
Historical cropping system (5 year): Oats-Corn-Soybeans-Winter Barley; cover crop mix; compost application
Previous crop: Winter barley/double crop soybeans
Strip size: 0.83 ac
Corn planting/harvest date: May 8/October 10
Corn row spacing/planting density: 30 in; 30,700 seeds/ac
Nitrogen sources and timing: Chemical + foliar nutrients; sidedress
Appendix K. Keaton Krueger; Ogden, IA
This trial continues to show the same results year after year. It is helping me get more confident in what the correct rate is on my farm.
The financial outcome at the reduced N rate was likely a financial loss. A 15 lb N/ac reduction was likely too large this year, but a smaller N reduction could bring financial savings.

Historical cropping system (5 year): No-till/Strip-till corn and soybeans; oats, triticale, camelina and cereal rye cover crops; cattle grazing
Previous crop: Soybeans
Strip size: 0.48 ac
Corn planting/harvest date: May 3/Oct. 13
Corn row spacing/planting density: 30 in; 32,500 seeds/ac
Nitrogen sources and timing: Chemical; Pre-plant, sidedress
Appendix L. Scott Lightly; Oakland, MN
The financial outcome at both the reduced N rate and zero N rate resulted in a financial loss compared to the typical N rate. A reduction of 27 lb N/ac was likely too large this year, but there may be potential financial savings with a smaller N reduction. While considerable yield losses are expected when no nitrogen is applied, the 0N treatment is important for understanding the full impact of nitrogen on yield and profitability.
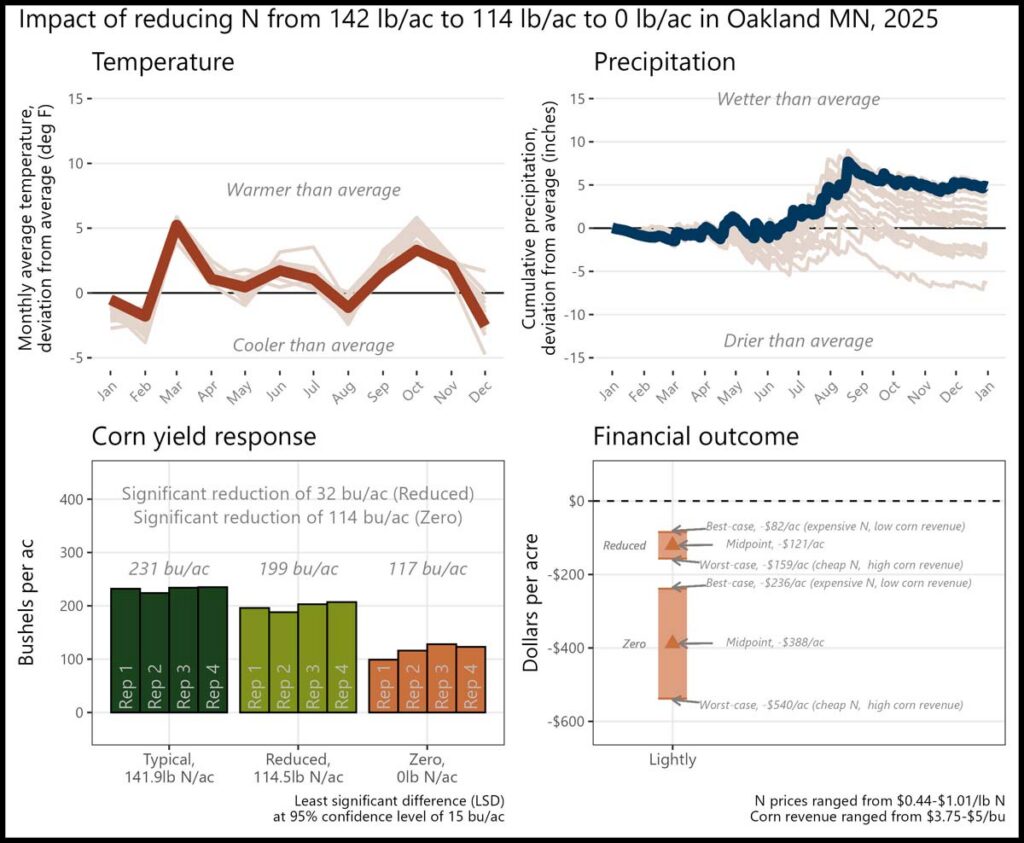
Historical cropping system (5 year): No-till soybeans and corn; cereal rye and cover crop mixes
Previous crop: Soybeans
Strip size: 0.27 ac
Corn planting/harvest date: May 9/Oct. 10
Corn row spacing/planting density: 30 in; 36,000 seeds/ac
Nitrogen sources and timing: Chemical; At plant, sidedress, top dress
Appendix M. Adam Mayer; Saint Ansgar, IA
I will continue gradually decreasing rates and trialing to find economic tipping point for my operation.
The financial outcome at the reduced N rate was likely a financial savings compared to the typical N rate. A 27 lb N/ac reduction saved money this year, and, when applied to at least 48 acres, could offset the average annual GHGs of one vehicle. The financial outcome at the zero N rate resulted in a financial loss compared to the typical N rate. While considerable yield losses are expected when no nitrogen is applied, the 0N treatment is important for understanding the full impact of nitrogen on yield and profitability.
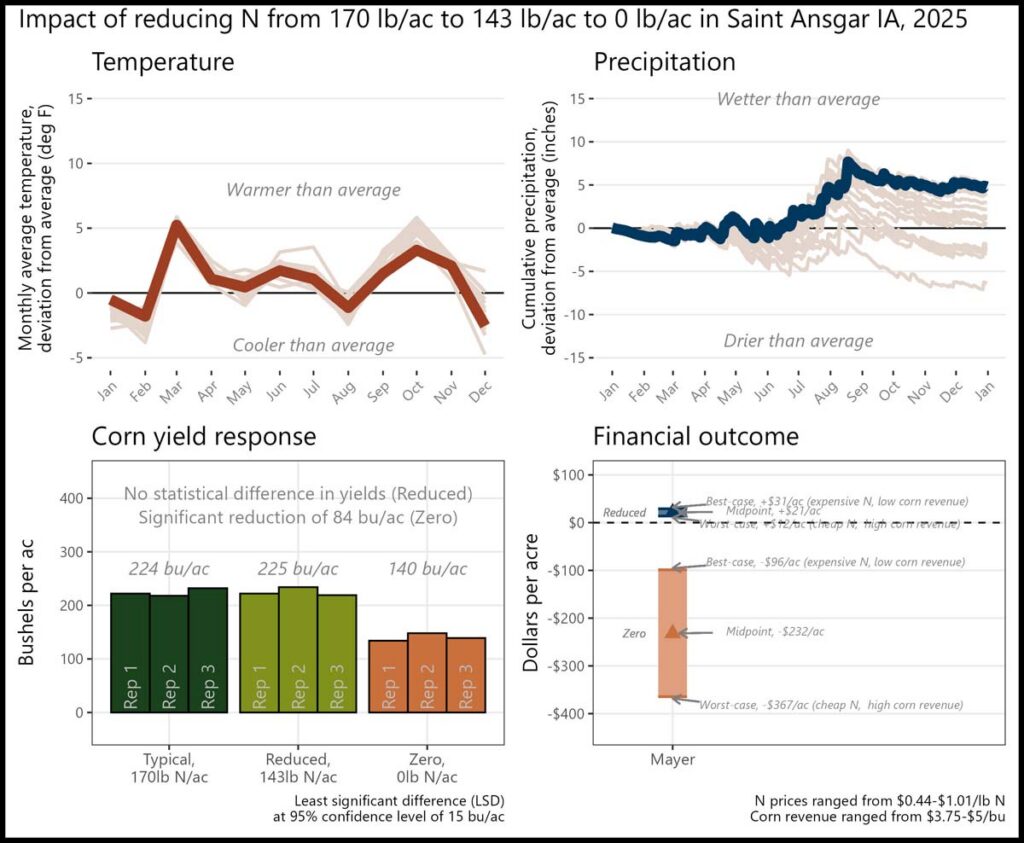
Historical cropping system (5 year): No-till/strip-till corn and soybeans; cereal rye
Previous crop: Soybeans
Strip size: 1.65 ac
Corn planting/harvest date: May 11/Oct. 12
Corn row spacing/planting density: 30 in; 35,000 seeds/ac
Nitrogen sources and timing: Chemical; Fall, at-plant, sidedress
Appendix N. Ross McCaw; Marengo, IA
Comparing low to no nitrogen treatments was an eye opener. It's good to know that the biology on this farm is working.
The financial outcome at both the reduced N rate and zero N rate resulted in a financial loss compared to the typical N rate. A reduction of 66 lb N/ac was likely too large this year, but there may be potential financial savings with a smaller N reduction. While considerable yield losses are expected when no nitrogen is applied, the 0N treatment is important for understanding the full impact of nitrogen on yield and profitability.
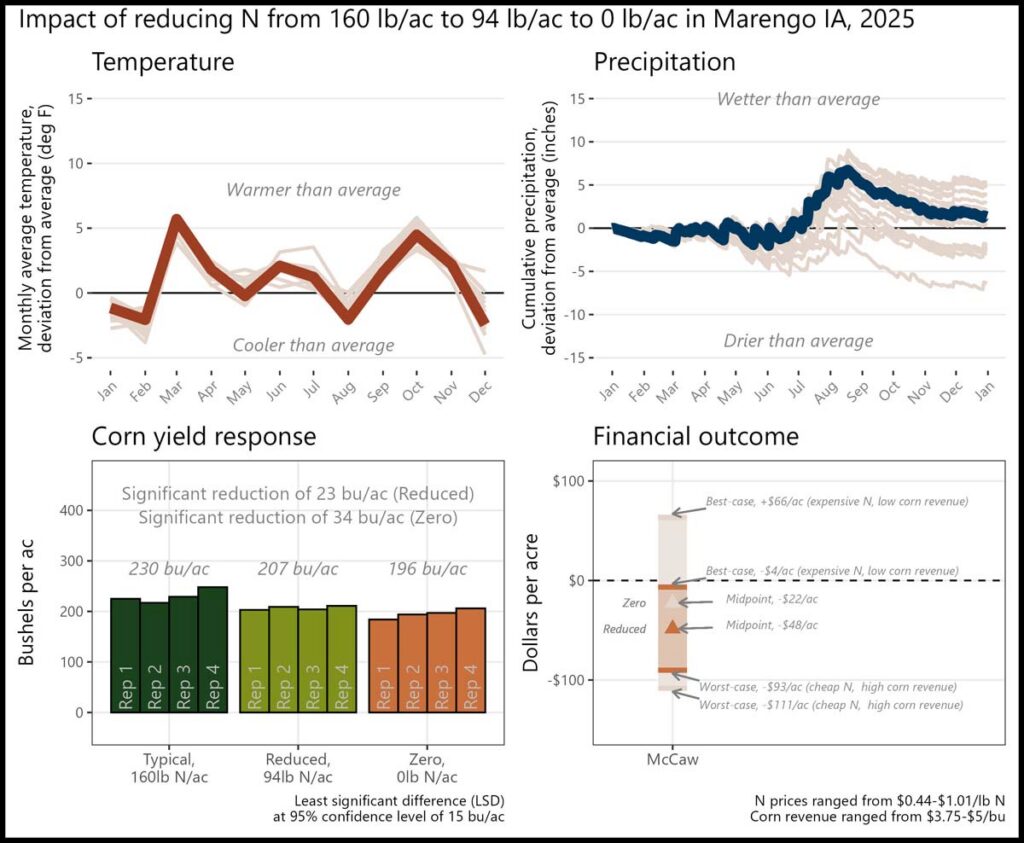
Historical cropping system (5 year): No-till corn and soybeans; cereal rye cover crop
Previous crop: Soybeans
Strip size: 0.73-0.86 ac
Corn planting/harvest date: May 12/Oct. 22
Corn row spacing/planting density: 30 in; 34,000 seeds/ac
Nitrogen sources and timing: Chemical; Pre-plant, sidedress
Appendix O. Ben Offenburger; Chariton, IA
With tight margins this year I plan to reduce N rate applied preplant. I have seen that there was statistically no difference in my reduced rate. This will save me money, and I have peace of mind that it will not hurt yield too badly. I can still add more nitrogen later on depending on how the year goes with weather and finances.
The financial outcome at the reduced N rate was likely a financial savings compared to the typical N rate. A 50 lb N/ac reduction saved money this year, and, when applied to at least 25 acres, could offset the average annual GHGs of one vehicle.
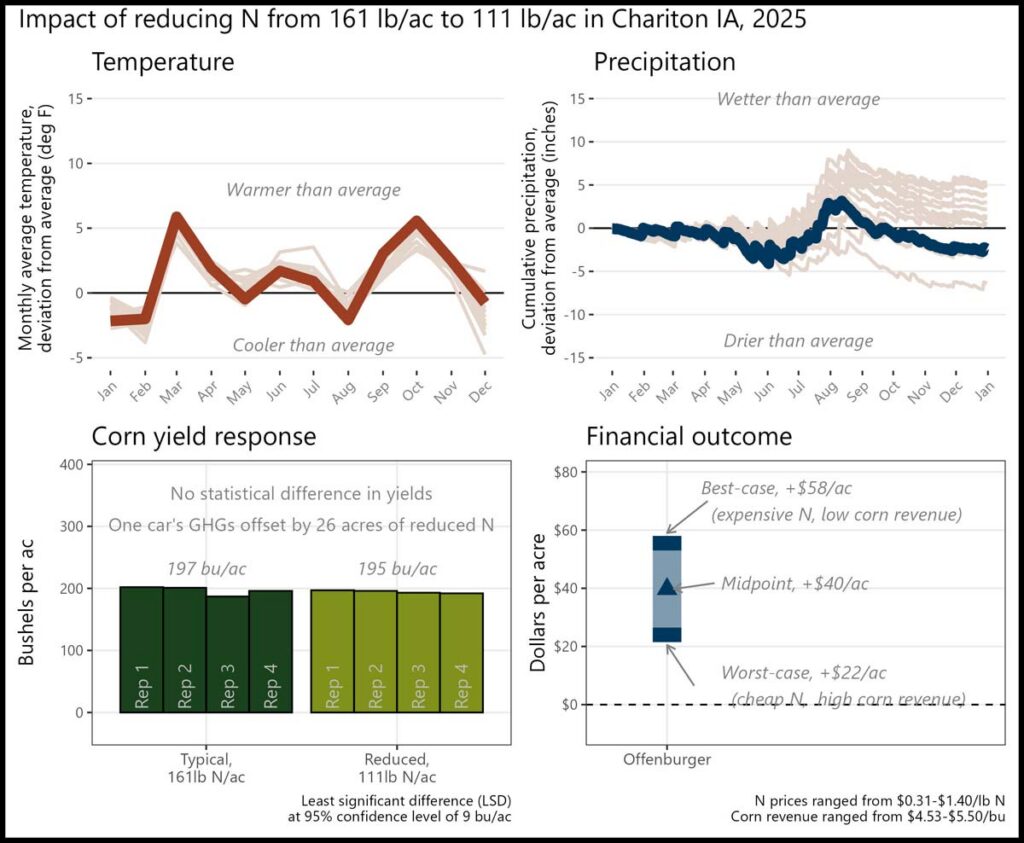
Historical cropping system (5 year): No-till corn and soybeans; cereal rye cover crop; grazing
Previous crop: Soybeans
Strip size: Not reported
Corn planting/harvest date: May 6/Oct. 13
Corn row spacing/planting density: 30 in; 32,000 seeds/ac
Nitrogen sources and timing: Chemical; Pre-plant
Appendix P. Lucas Olen; Mora, MN
The financial outcome at the reduced N rate was likely a financial savings compared to the typical N rate. A 10 lb N/ac reduction saved money this year, and, when applied to at least 130 acres, could offset the average annual GHGs of one vehicle.
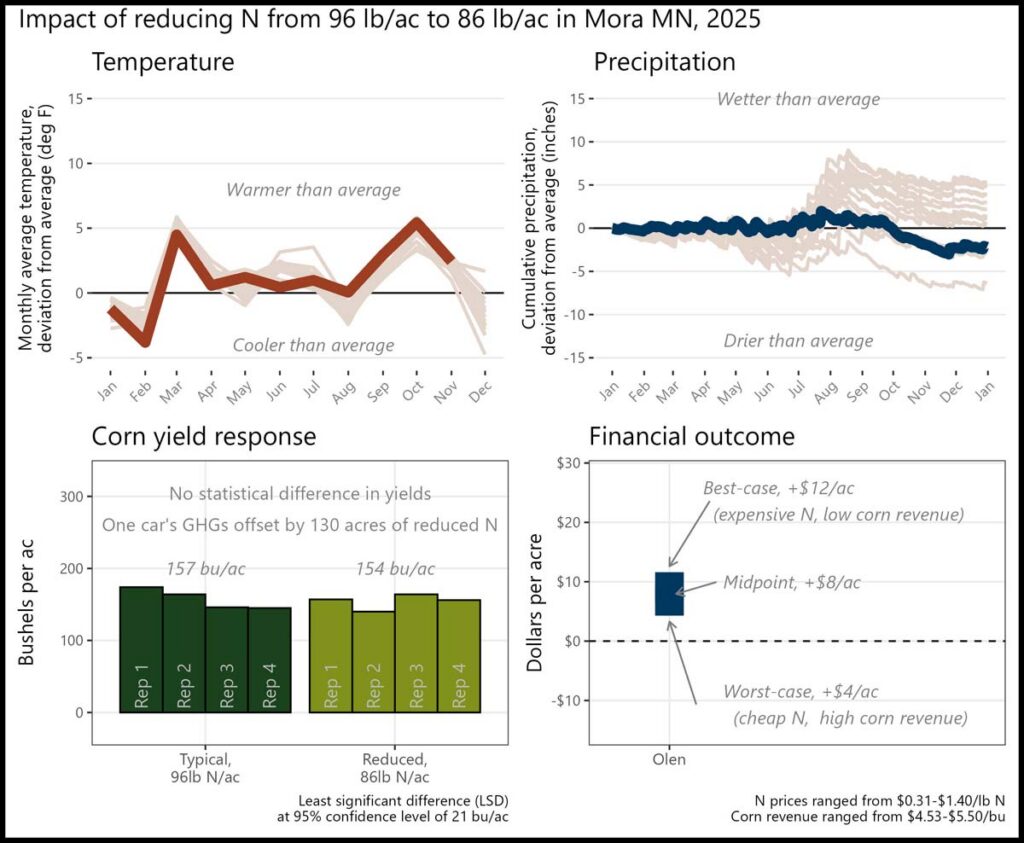
Historical cropping system (5 year): No-till corn and soybeans; cereal rye, radish, and turnip field peas cover crops
Previous crop: Soybeans (2023); prevent plant (2024)
Strip size: 1.8-3.8 ac
Corn planting/harvest date: May 1/Nov. 15
Corn row spacing/planting density: Not reported
Nitrogen sources and timing: Chemical; at-plant, sidedress
Appendix Q. Matt Ollendieck; La Porte City, IA
I feel like we have nitrogen rates dialed into a decent range, but this [trial] helped quantify that.
The financial outcome at the reduced N rate was likely a financial loss. A 45 lb N/ac reduction was likely too large this year, but a smaller N reduction could bring financial savings.
For the second trial (0N), the financial outcome at both the reduced N rate and zero N rate resulted in a financial loss compared to the typical N rate. A reduction of 55 lb N/ac was likely too large this year, but there may be potential financial savings with a smaller N reduction.
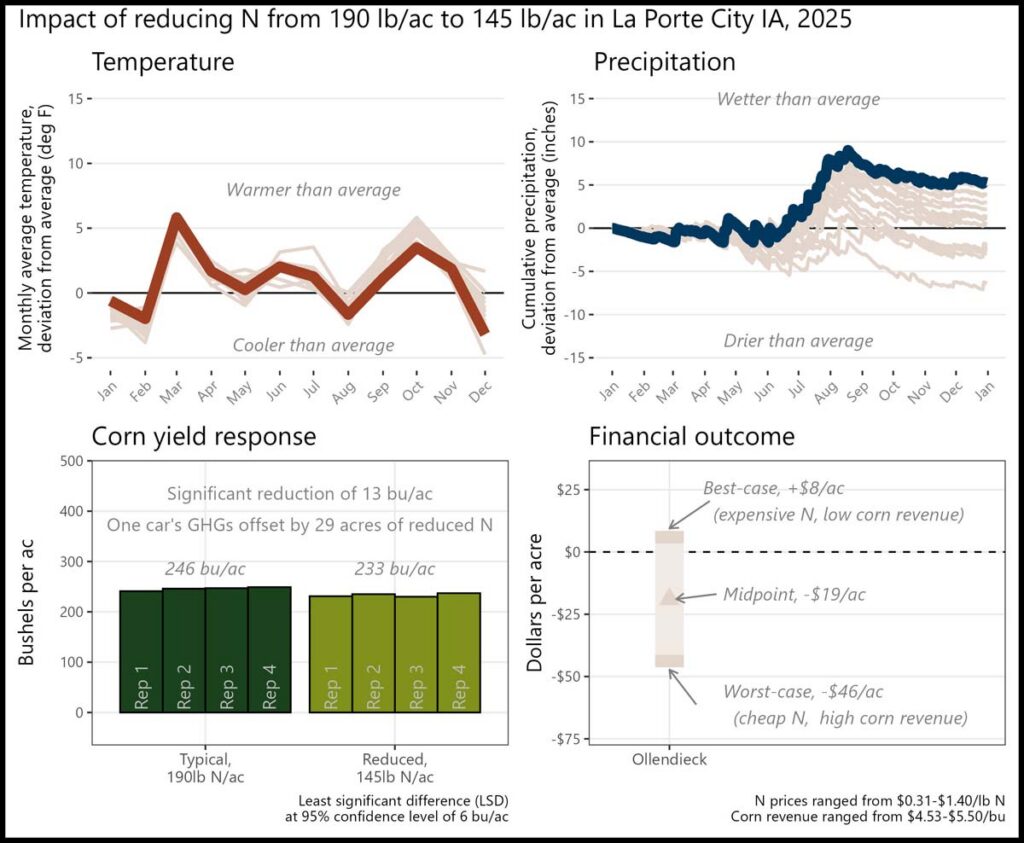
Historical cropping system (5 year): No-till corn and soybeans; cereal rye and oat/radish cover crops
Previous crop: Soybeans
Strip size: 1.25 ac
Corn planting/harvest date: May 5/October 21
Corn row spacing/planting density: 30 in; 34,000 seeds/ac
Nitrogen sources and timing: Chemical; At-plant, sidedress
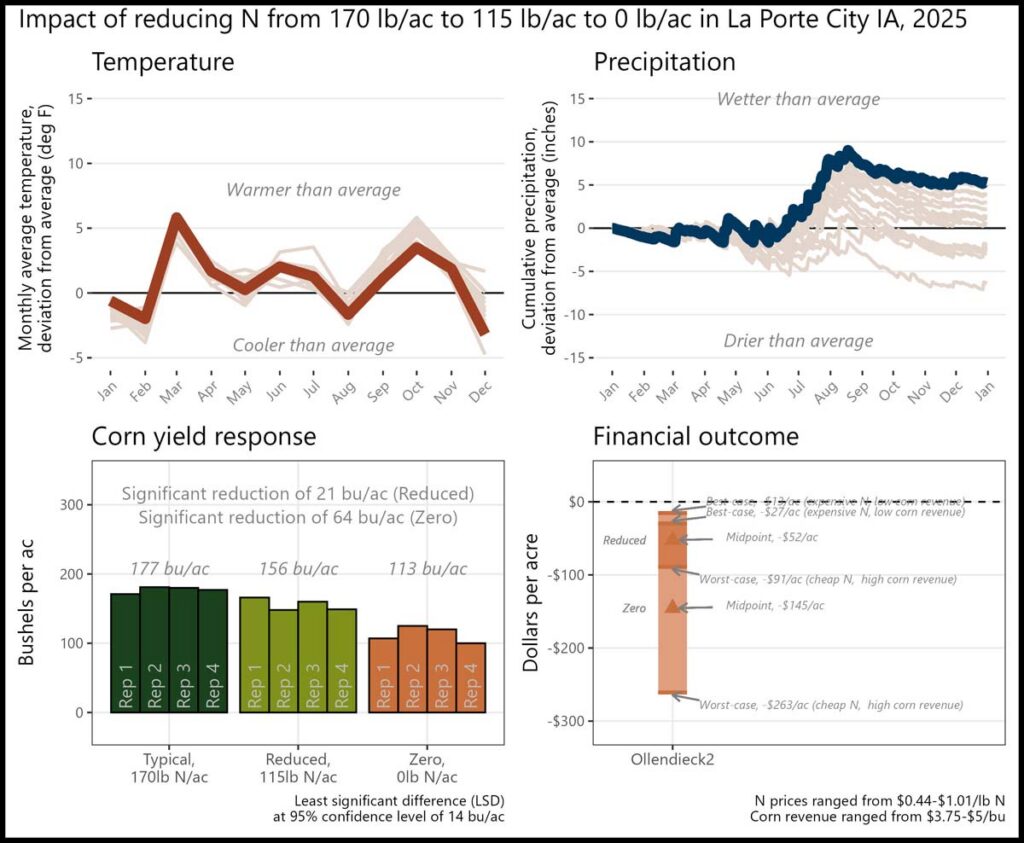
Historical cropping system (5 year): No-till corn and soybeans; cereal rye and oat/radish cover crops
Previous crop: Soybeans
Strip size: 1.25 ac
Corn planting/harvest date: May 15/Nov. 13
Corn row spacing/planting density: 30 in; 32,000 seeds/ac
Nitrogen sources and timing: Chemical; At-plant, sidedress
Appendix R. Jerry Ouverson; Fertile, IA
The financial outcome at the reduced N rate was likely a financial loss. A 40 lb N/ac reduction was likely too large this year, but a smaller N reduction could bring financial savings.
For the second trial (0N), the financial outcome at the reduced N rate was likely a financial savings compared to the typical N rate. A 40 lb N/ac reduction saved money, and, when applied to at least 32 acres, could offset the average annual GHGs of one vehicle. The financial outcome at the zero N rate resulted in a financial loss compared to the typical N rate.

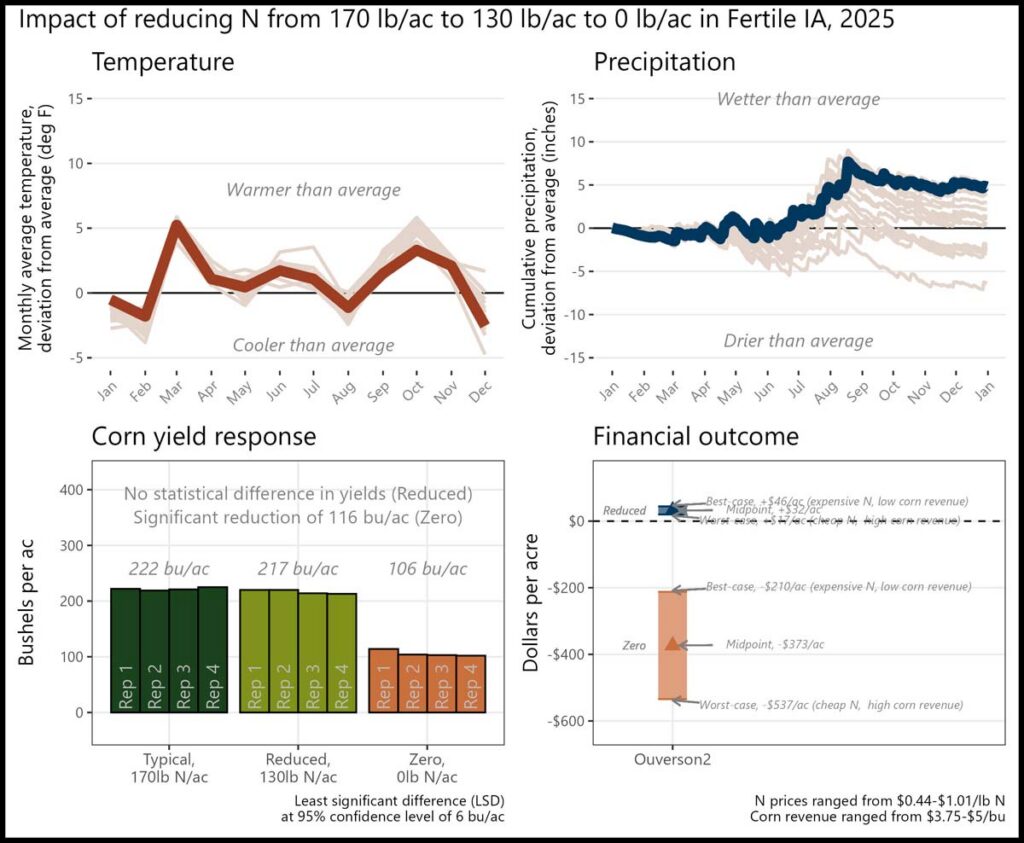
Historical cropping system (5 year): No-till/Strip-till corn and soybeans; cereal rye, rapeseed, and oats cover crops
Previous crop: Soybeans
Strip size: 0.77 ac
Corn planting/harvest date: May 12/NA
Corn row spacing/planting density: 30 in; 34,000 seeds/ac
Nitrogen sources and timing: Chemical; At-plant, sidedress
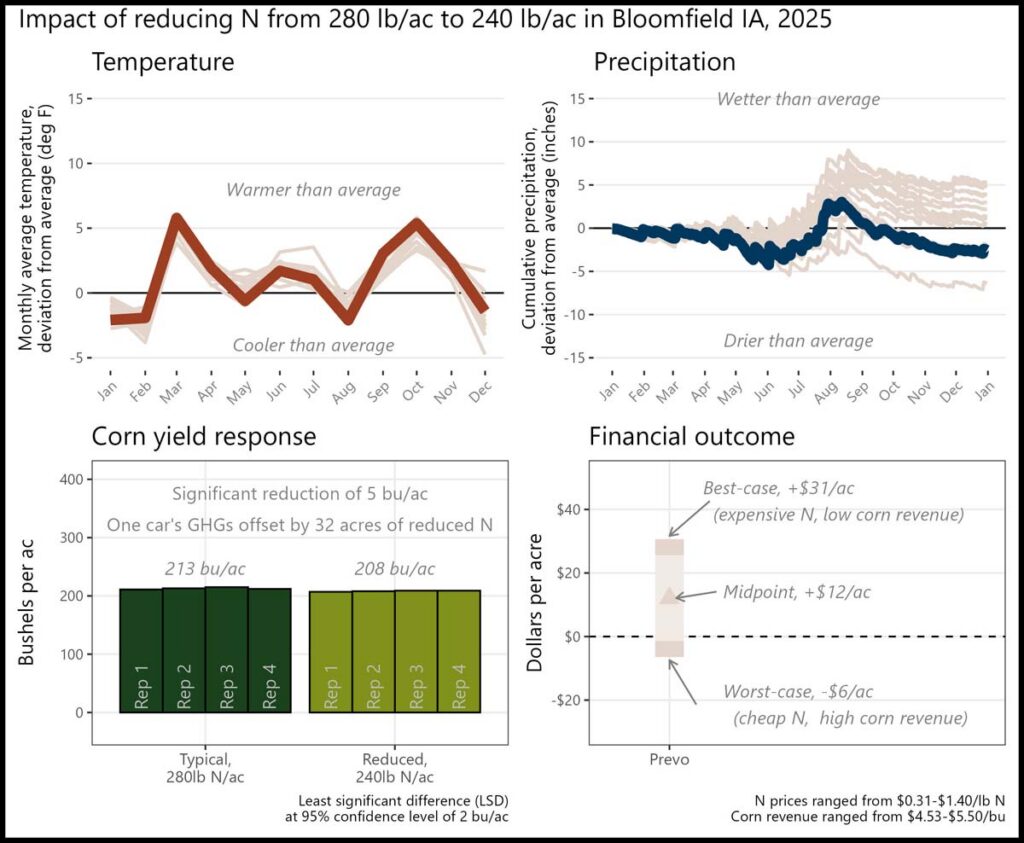
Appendix S. Kevin Prevo; Bloomfield, IA
[The most valuable aspect of conducting this trial was] validation of my practices.
The financial outcome at the reduced N rate was likely a financial savings compared to the typical N rate. A 40 lb N/ac reduction saved money this year, and, when applied to at least 32 acres, could offset the average annual GHGs of one vehicle.
Historical cropping system (5 year): No-till corn and soybeans; cereal rye and diverse mix cover crops; hog manure application; grazing
Previous crop: Soybeans
Strip size: 0.31 ac
Corn planting/harvest date: April 9/Sept. 30
Corn row spacing/planting density: 30 in; 32,000 seeds/ac
Nitrogen sources and timing: Organic ‑ Fall; Chemical - sidedress
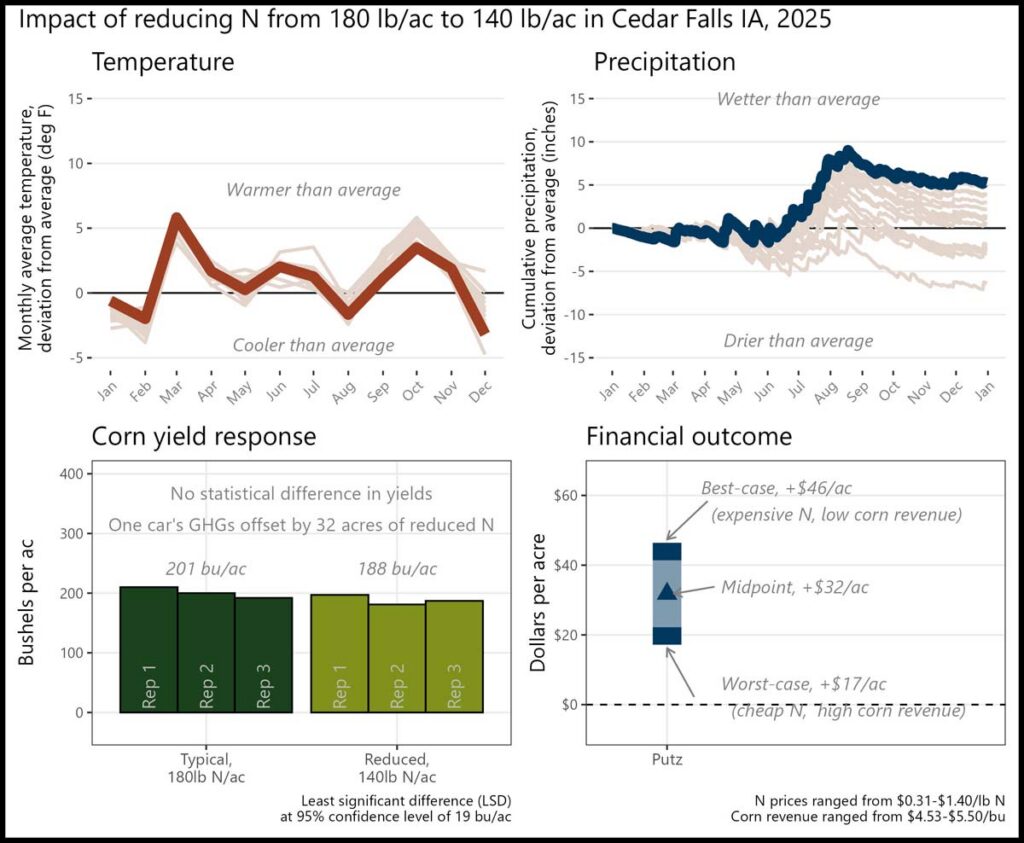
Appendix T. Don Putz; Cedar Falls, IA
This has been the second year of this trial, and we're wanting at least 5 years in order to come to a full consensus.
The financial outcome at the reduced N rate was likely a financial savings compared to the typical N rate. A 40 lb N/ac reduction saved money this year, and, when applied to at least 32 acres, could offset the average annual GHGs of one vehicle.
Historical cropping system (5 year): No-till corn and soybeans; rye and camelina cover crops
Previous crop: Soybeans
Strip size: 0.92 ac
Corn planting/harvest date: April 29/Oct. 17
Corn row spacing/planting density: 30 in; 33,500 seeds/ac
Nitrogen sources and timing: Chemical; Pre-plant, sidedress
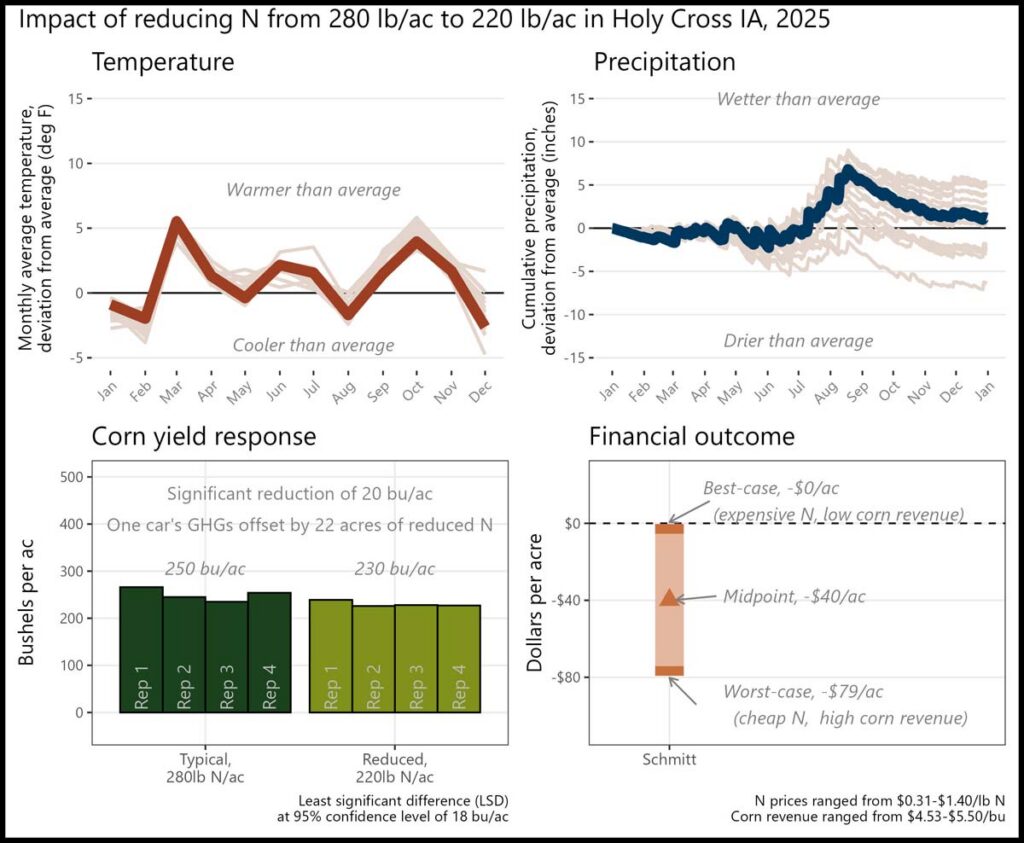
Appendix U. Jeff Schmitt; Holy Cross, IA
I didn't think we would have a positive yield response, but N rates are affected by so many factors that it is nearly impossible to have a blanket recommendation.
The financial outcome at the reduced N rate was likely a financial loss. A 60 lb N/ac reduction was likely too large this year, but a smaller N reduction could bring financial savings.
Historical cropping system (5 year): No-till corn and soybeans; cereal rye cover crops; hog manure
Previous crop: Soybeans
Strip size: 0.57 ac
Corn planting/harvest date: May 7/November 5
Corn row spacing/planting density: 30 in; 34,500 seeds/ac
Nitrogen sources and timing: Chemical; At plant
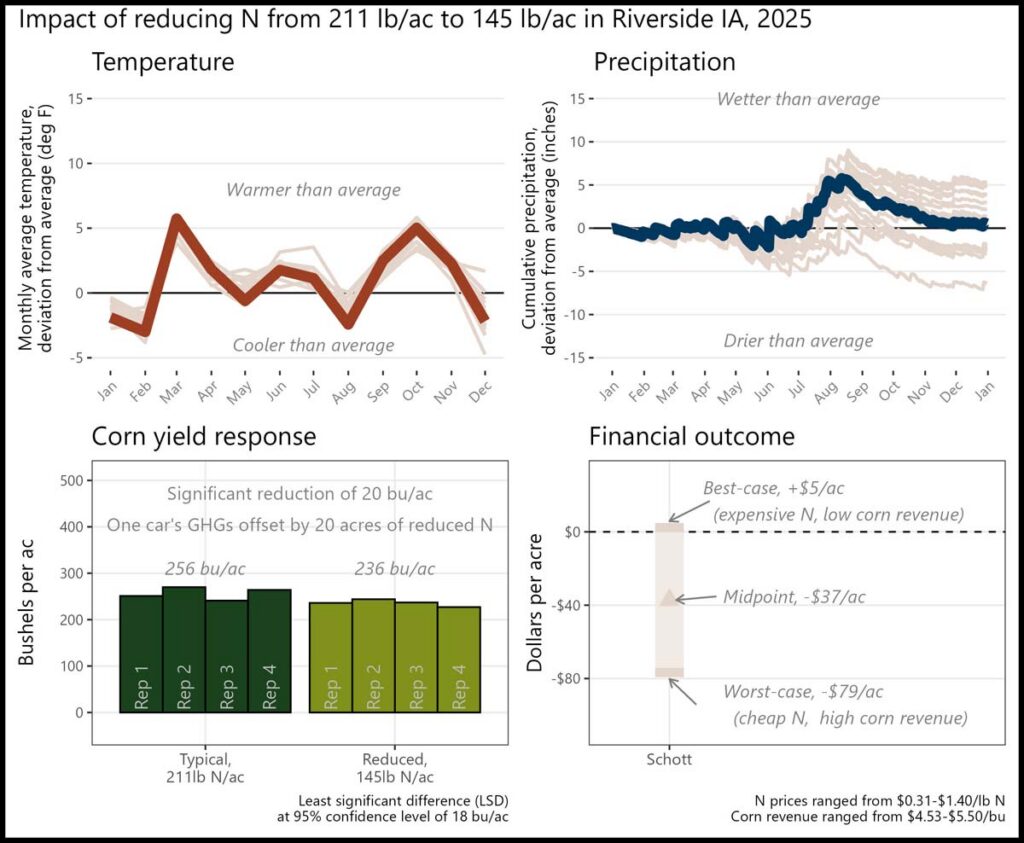
Appendix V. Larry Schott; Riverside, IA
I think it is always important to evaluate if we are using too much nitrogen. This helped answer that question for us this year.
The financial outcome at the reduced N rate was likely a financial loss. A 66 lb N/ac reduction was likely too large this year, but a smaller N reduction could bring financial savings.
Historical cropping system (5 year): No-till/soil finish corn and soybeans
Previous crop: Corn
Strip size: 0.28 ac
Corn planting/harvest date: April 14/September 11
Corn row spacing/planting density: 30 in; 33,100 seeds/ac
Nitrogen sources and timing: Chemical; Pre-plant, at plant, sidedress
Appendix W. Kyle Spowart; Tripoli, IA
The financial outcome at both the reduced N rate and zero N rate resulted in a financial loss compared to the typical N rate. A reduction of 69 lb N/ac was likely too large this year, but there may be potential financial savings with a smaller N reduction.

Historical cropping system (5 year): No-till/strip-till corn and soybeans; cereal rye cover crops
Previous crop: Corn
Strip size: 0.53 ac
Corn planting/harvest date: May 8/October 9
Corn row spacing/planting density: 30 in; 34,000 seeds/ac
Nitrogen sources and timing: Chemical + foliar applications; Top dress
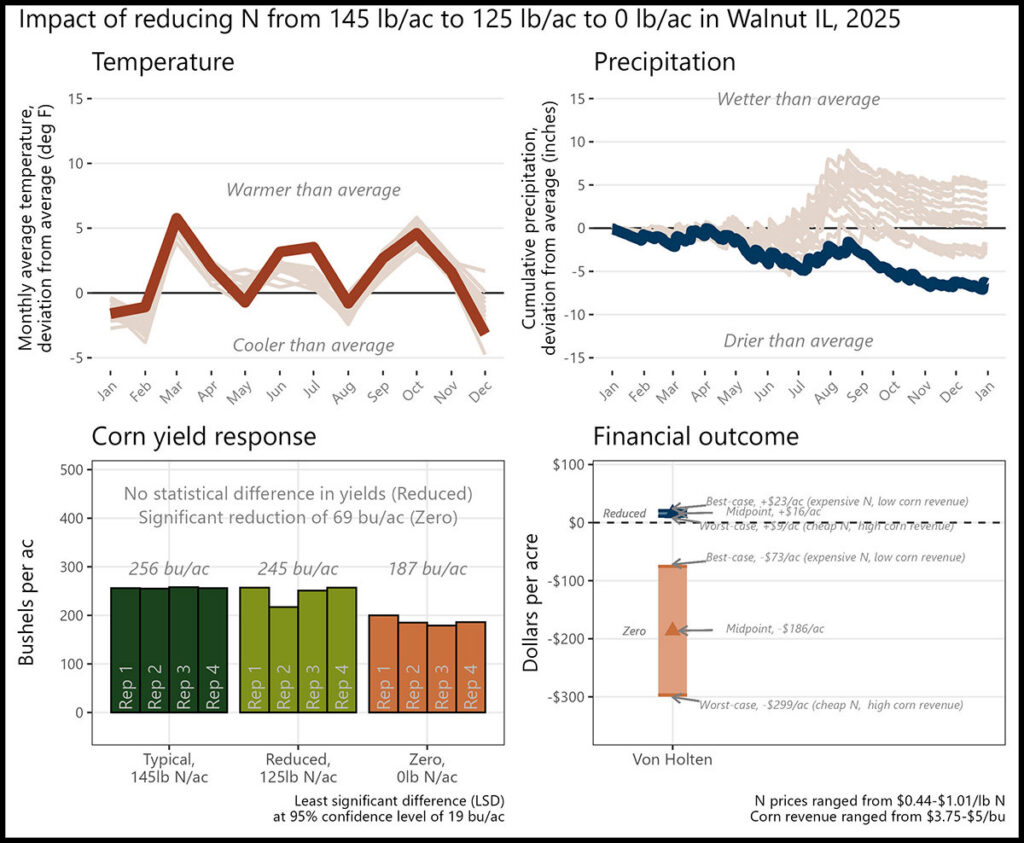
Appendix X. Chris Von Holten; Walnut, IL
Trial results showed me that I can potentially lower my N rates by 20 lbs/ac. By doing this I won't give up much yield and have positive ROI from the reduced N rate.
The financial outcome at the reduced N rate was likely a financial savings compared to the typical N rate. A 20 lb N/ac reduction saved money, and, when applied to at least 65 acres, could offset the average annual GHGs of one vehicle. The financial outcome at the zero N rate resulted in a financial loss compared to the typical N rate.
Historical cropping system (5 year): No-till corn and soybeans; cereal rye cover crop
Previous crop: Soybeans
Strip size: 0.92 ac
Corn planting/harvest date: April 17/October 13
Corn row spacing/planting density: 30 in; 32,000 seeds/ac
Nitrogen sources and timing: Chemical; At plant, sidedress
Appendix Y. Detailed Methods
Weather data
Each cooperator chose a US Census-recognized town with which to associate their trial. The latitude and longitude of the chosen town were used to retrieve weather data from the National Aeronautics and Space Administration (NASA) Prediction of Worldwide Energy Resources (POWER) project using the nasapower package [10] for R software [11]. Data was downloaded for the period spanning January 1, 1995 through December 31, 2025. Two weather variables were used: (1) cumulative daily precipitation values and (2) the average daily air temperature at two meters above ground level. The weather data was separated into two data sets: one comprising the entire 30 years of data (historical weather data), and one containing only data from January 1 – December 31, 2025 (trial year data).
To provide context for each trial’s temperatures, the historical mean temperature for month at a given site was calculated using the historical weather dataset. The historical value was subtracted from the trial year average temperature for that month to provide an estimate of the deviation from average conditions.
GHG Emissions
Both direct and indirect (volatilization, leaching) N2O emissions were considered in these calculations. Additionally, although N2O emissions do vary by the form of N fertilizer used, in this trial farmers only adjusted chemical forms of N fertilizer, and the variation between chemical fertilizer types was small compared to the absolute estimates (~1%), so an average of the fertilizer types was used.
Funding Acknowledgement
This material is based upon work supported by The Foundation for Food & Agriculture Research (FFAR). Any opinions, findings, conclusions, or recommendations expressed in this publication are those of the author(s) and do not necessarily reflect the views of FFAR. In addition, any reference to specific brands or types of products or services does not constitute or imply an endorsement by FFAR for those products or services.
References
[1] R. Bianchin Rebesquini and S. Gailans, “Can We Reduce N Rates to Corn and Improve ROI?,” Practical Farmers of Iowa, 2025. Accessed: Feb. 25, 2026. [Online]. Available: https://practicalfarmers.org/research/can-we-reduce-n-rates-to-corn-and-improve-roi-2024/
[2] G. Nichols and S. Gailans, “Can We Reduce N Rates and Improve ROI?,” Practical Farmers of Iowa, 2023. Accessed: Mar. 28, 2024. [Online]. Available: https://practicalfarmers.b-cdn.net/wp-content/uploads/2023/07/22.FC_.Can-WeReduceN.pdf
[3] G. Nichols and S. Gailans, “Can We Reduce N Rates to Corn and Improve ROI?,” Practical Farmers of Iowa, 2024. Accessed: Mar. 18, 2025. [Online]. Available: https://practicalfarmers.b-cdn.net/wp-content/uploads/2024/06/23.FC_.canwereduceNratestocorn.pdf
[4] T. F. Morris et al., “Strengths and Limitations of Nitrogen Rate Recommendations for Corn and Opportunities for Improvement,” Agron. J., vol. 110, no. 1, pp. 1–37, 2018, doi: 10.2134/agronj2017.02.0112.
[5] “IPCC Fourth Assessment Report: Climate Change 2007.” Intergovernmental Panel on Climate Change, 2007. Accessed: Mar. 28, 2024. [Online]. Available: https://archive.ipcc.ch/publications_and_data/ar4/wg1/en/ch2s2-10-2.html
[6] “GREET.” U.S. Department of Energy, 2022. Accessed: Mar. 28, 2024. [Online]. Available: https://www.energy.gov/eere/greet
[7] “Greenhouse Gases Equivalencies Calculator - Calculations and References.” U.S. Environmental Protection Agency, 2024. Accessed: Mar. 28, 2024. [Online]. Available: https://www.epa.gov/energy/greenhouse-gases-equivalencies-calculator-calculations-and-references
[8] “Good Practice Guidance and Uncertainty Management in National Greenhouse Gas Inventories,” Intergovernmental Panel on Climate Change, 2000. Accessed: Mar. 28, 2024. [Online]. Available: https://www.ipcc-nggip.iges.or.jp/public/gp/english/
[9] “Greenhouse Gas Emissions from a Typical Passenger Vehicle.” U.S. Environmental Protection Agency, 2024. Accessed: Mar. 28, 2024. [Online]. Available: https://www.epa.gov/greenvehicles/greenhouse-gas-emissions-typical-passenger-vehicle
[10] A. H. Sparks, “nasapower: A NASA POWER Global Meteorology, Surface Solar Energy and Climatology Data Client for R,” J. Open Source Softw., vol. 3, no. 30, p. 1035, Oct. 2018, doi: 10.21105/joss.01035.
[11] R Core Team, “R: A language and environment for statistical computing.” R Foundation for Statistical Computing, Vienna, Austria, 2022. Accessed: Mar. 28, 2024. [Online]. Available: https://www.r-project.org/