Funded by FFAR.
In a Nutshell:
- In 2024, 19 cooperators conducted trials comparing the effects of their typical nitrogen fertilizer rate to corn with a reduced fertilizer rate of their choosing..
- In 2025, five of those cooperators undertook trials to measure the effects of those different N rates on the soybeans that they grew the following year.
Key Findings:
- Nitrogen rates applied to corn in 2024 ranged from 130-172 lb N/ac in the ‘typical’ N rates, 100-132 lb N/ac in the ‘reduced’ N rate), and 0 lb N/ac for for the ‘zero’ N rate).
- Soybean yields in 2025 were not affected by nitrogen rates applied to corn in 2024.
- Relatively low ‘typical’ N-rates and cover crops may have limited potential differences in soybean responses.
Background
Since 2022, PFI has supported nitrogen fertilizer rate trials [1], [2], [3], [4]. From this ongoing work arose the question: do lower nitrogen fertilization rates have any effect on soybeans planted the following year?
In the common two-year corn-soy rotation, the leguminous soybeans are often not fertilized with extra nitrogen, although the amount of legacy nitrogen that can be counted on to be left after the corn season and its availability remain open questions.
Five farms tested the effects of reducing nitrogen fertilizer application to corn in 2024 on the yields of the soybeans in 2025. Four of these farms performed two-way comparisons, looking at their Typical N-rate and a Reduced N-rate, and two farms made three-way comparisons between their Typical N-rate, a Reduced N-rate, and a Zero N-rate, where they do not fertilize the corn with any N-containing fertilizer.
Several cooperators wrote that they were hoping for more confidence in reducing their N-rates to corn, knowing that there would not be knock-on effects on the soybean yield. Robert Harvey wrote that he was hoping to learn how much nitrogen was left in the soil the year after a corn crop. Keaton Krueger wrote that “I don't anticipate seeing any response in the year following in soybean, but it will certainly be interesting if I do.”
Methods
Design
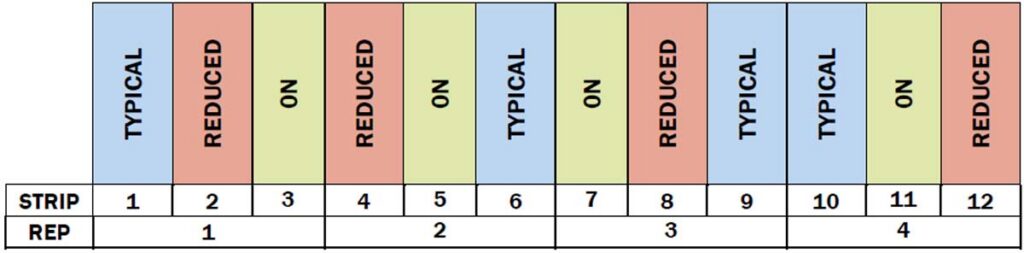
For this trial, the 2025 soybeans were planted in the same strips used for the 2024 “Can We Reduce Nitrogen Rates and Improve ROI” project trials. As such, the experimental treatments’ layout of strips on each farm exactly matches their layout in the 2024 trial. An example of the randomized, replicated experimental setup can be seen in Figure A1. Cooperators had either two or three treatments, depending on whether their 2024 N-Rate trial included a 0 N-rate strip.
- Typical—the amount of nitrogen that cooperators would apply based on their standard management; for the purpose of comparison, this is treated as the control
- Reduced--a nitrogen fertilizer rate less than the typical rate
- Zero, no nitrogen applied (only Bennett and Harvey)
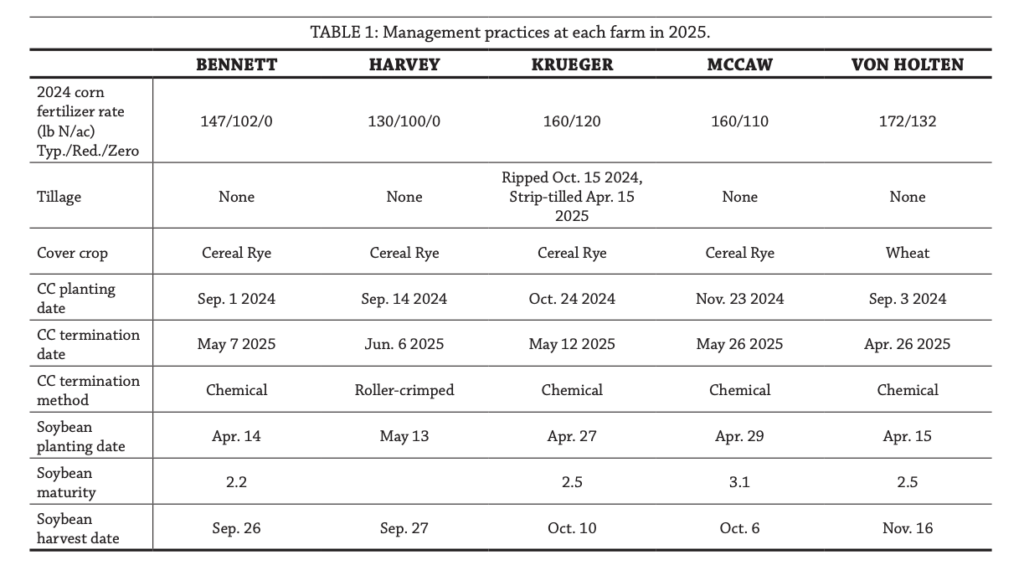
Specific nitrogen fertilizer application rates for each treatment can be seen in the third column of Table 1. The cooperators in this trial reduced their typical nitrogen rates applied to corn in 2024 by an average of 41 pounds between their ‘typical’ and ‘reduced’ N-rates. Except for the nitrogen fertilizer application, farms followed their standard practices for growing soybeans. Summaries of the management techniques and timelines of each participating farm are shown in Table 1.
Each farm in the trial planted cover crops in the autumn or winter of 2024 and terminated them in the spring of 2025. Table 1 also shows a summary of cover crop species that each farm planted and their management timelines.
Measurements
We measured soybean yield in bushels per acre, adjusted to 13% moisture. We also gathered information on the sale price of the soybeans, but because the treatment costs were the same, this information was not used to inform a return on investment (ROI) calculation.
Data Analysis
We used an ANOVA (Analysis of Variance) at a 95% confidence level to determine whether there were significant differences in yield between control and N-rate reduction treatments. This means that any differences between treatments that we declare to be statistically different would be expected to occur 95 times out of 100 under the same conditions. We can perform this analysis because the cooperators had completely randomized and replicated experimental designs (Figure A1).
Results and Discussion
There were no significant differences in soybean yields between treatments. Figure 1 shows that the yield differences between the control ‘typical’ N-rate and the lower ‘reduced’ and ‘zero’ N-rates ranged from 0.8 bu/ac (the reduced treatment slightly, and non-significantly, outperformed the control) and -3.2 bu/ac (the reduced treatment slightly, and non-significantly, underperforming the control).
Yields held steady at each farm across treatments, even the ‘zero’ treatments. Both farms that included zero N-rates (Bennet and Harvey) saw no difference between the zero-rate and their typical rate.

The amount of nitrogen supplied to corn in 2024 did not affect soybean yields on the same ground the following year. At least, not at the rates that were applied for this trial. The highest nitrogen fertilization rate in this trial was 172 lb N/ac. This is not very high. As one example of a higher standard nitrogen fertilization rate, a 2021 study on the ISU North Eastern Research Farm found the optimal N application rate to be 223 lb/N ac for a corn-soybean rotation [5]. Larger amounts of legacy nitrogen available in the soil could be taken up by the soybeans in the spring, but the effects of such a windfall are uncertain. Soybeans do not fix all the nitrogen that they need for production. Furthermore, fixing N does cost energy that the legumes could otherwise use for growth. However, Fontes et al. write that, compared to grass species that benefit from readily available nitrogen as they are starting to grow, soybeans benefit most from additional nitrogen applied later in the season, as the protein-rich seeds are being filled [6]. In this trial, measuring the effect of uncertain and unmeasured amounts of legacy nitrogen left in the field after the winter, with no additional nitrogen being supplied, it is not surprising that we did not see a response.
The farms and farmers in this trial are conservation-minded. All had participated in the N-rate reduction project in at least one prior year; for most, 2024 was their second or third time testing a lower nitrogen rate. With continued participation, we have seen nitrogen application decrease year over year on individual farms. Because cooperators’ “typical” rates were already relatively low, many had already cut excess nitrogen from their fields’ N-budgets, which may help explain the lack of treatment differences.
Every farm in the trial also grew cover crops the winter of 2024-25 (Table 1). The cereal rye and wheat plants would have taken up available nitrogen after corn harvest in fall 2024. This may have blunted any effect that different amounts of legacy nitrogen might have had on the soybeans in 2025.
Conclusions and Next Steps
PFI’s multi-year and ongoing “Can We Reduce Nitrogen Rates and Improve ROI” project has provided many farms with data that has informed their decisions to use less nitrogen fertilizer. This corollary trial examined the effects of these reductions on soybeans planted the following year and found that there were none. Bennett reflected, “This trial adds to my confidence in reducing my N rate in corn. Finding that there was no statistical in yield in the soybeans was important, because there were visual differences in some years after the N reducing trial in corn. The residue difference where the N rate was reduced made for some different looking soybean strips. [This trial] affirmed that vegetative growth in soybeans doesn't equal yield”.
For some, this did not come as surprise. Krueger wrote in his trial reflection, “No differences were expected, and none were found”.
The N-Rate trial for corn continued in 2025, and this trial will be repeated in 2026, looking at the effects on soybeans.
Appendix - Trial Design and Weather Conditions


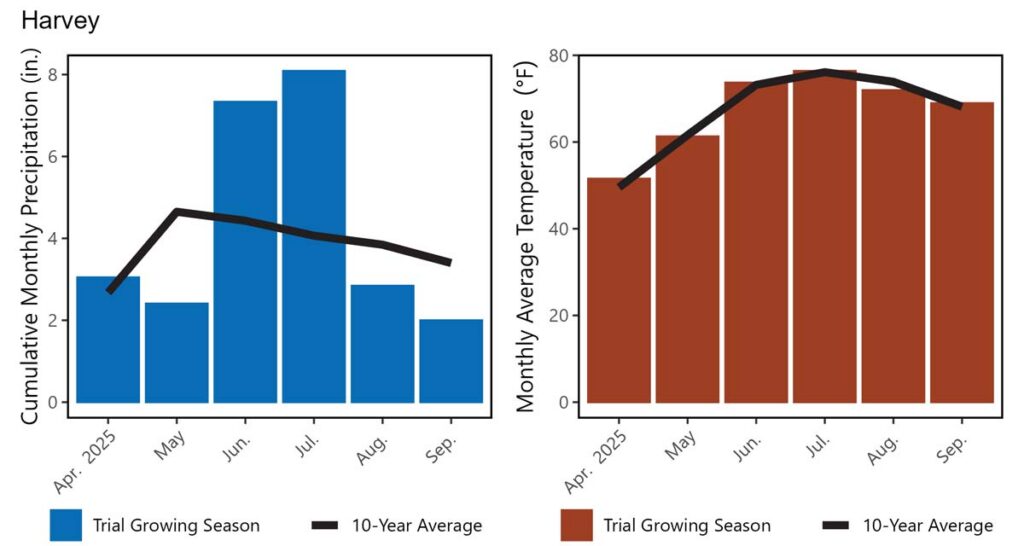
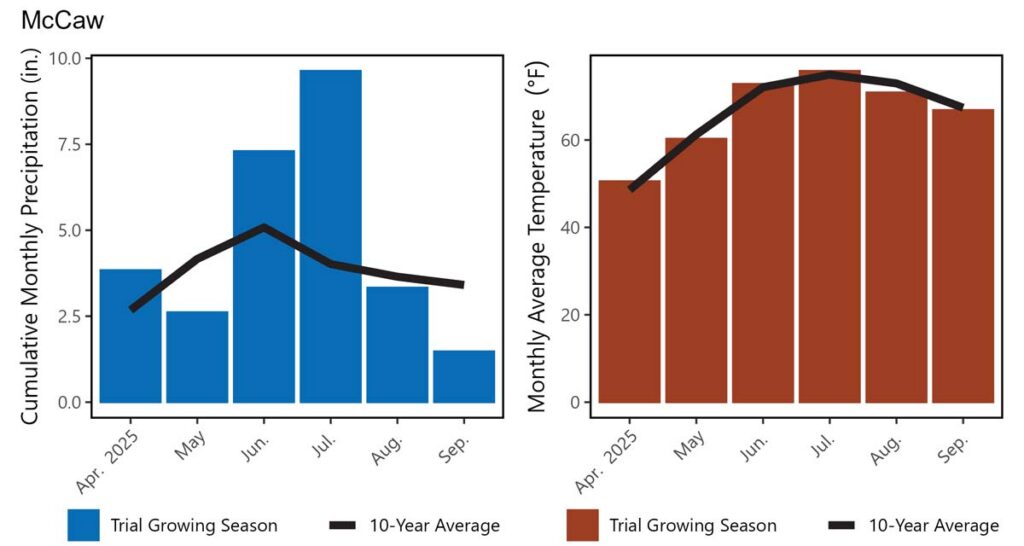
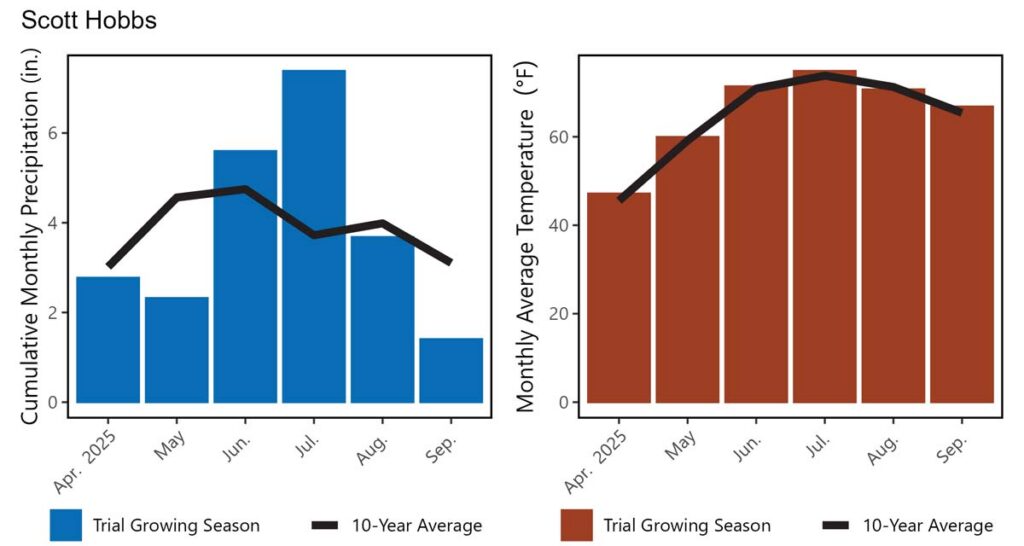

Funding Acknowledgement
This material is based upon work supported by The Foundation for Food & Agriculture Research (FFAR). Any opinions, findings, conclusions, or recommendations expressed in this publication are those of the author(s) and do not necessarily reflect the views of FFAR. In addition, any reference to specific brands or types of products or services does not constitute or imply an endorsement by FFAR for those products or services.
References
- G. Nichols and S. Gailans, “Can We Reduce N Rates and Improve ROI?,” Practical Farmers of Iowa, 2023. Accessed: Mar. 28, 2024. [Online]. Available: https://practicalfarmers.org/resources/research-reports/can-we-reduce-n-rates-and-improve-roi
- G. Nichols and S. Gailans, “Can We Reduce N Rates to Corn and Improve ROI?,” Practical Farmers of Iowa, 2024. Accessed: Mar. 18, 2025. [Online]. Available: https://practicalfarmers.org/resources/research-reports/can-we-reduce-n-rates-to-corn-and-improve-roi/
- R. Bianchin Rebesquini and S. Gailans, “Can We Reduce N Rates to Corn and Improve ROI?,” Practical Farmers of Iowa, 2025. Accessed: Feb. 25, 2026. [Online]. Available: https://practicalfarmers.org/research/can-we-reduce-n-rates-to-corn-and-improve-roi-2024/
- “Can We Reduce N Rates to Corn and Improve ROI? - Practical Farmers of Iowa.” Accessed: Aug. 11, 2026. [Online]. Available: https://practicalfarmers.org/resources/research-reports/can-we-reduce-n-rates-to-corn-and-improve-roi-2/
- S. Archontoulis and M. Baum, “Optimum Nitrogen Fertilizer Rates for Corn following Soybean and Corn following Corn in Northeast Iowa”.
- G. P. Fontes, “Nitrogen fertilizer and soybean yield: what we learned from multi-year trials in Illinois,” farmdoc. Accessed: Apr. 27, 2026. [Online]. Available: https://farmdoc.illinois.edu/field-crop-production/nitrogen-fertilizer-and-soybean-yield-what-we-learned-from-multi-year-trials-in-illinois.html
- A. Sparks, nasapower: NASA-POWER Data from R. (2024). [Online]. Available: https://CRAN.R-project.org/package=nasapower
- A. H. Sparks, “nasapower: A NASA POWER Global Meteorology, Surface Solar Energy and Climatology Data Client for R,” J. Open Source Softw., vol. 3, no. 30, p. 1035, Oct. 2018, doi: 10.21105/joss.01035.