

In a Nutshell
- Successfully raising corn after a cover crop requires timely cover crop termination and N fertilization. Commonly, farmers terminate a cover crop 2-3 weeks prior to planting corn but generally do not need to apply any more N than if they did not use a cover crop.
- Farmer-cooperators Dick Sloan and Tim Sieren compared terminating their cover crops approx. 3 weeks prior to planting corn with terminating their cover crops within 3 days of planting corn. They also investigated N fertilizer timing and rates across the cover crop termination dates.
Key Findings
- Delaying cover crop termination until a few days before planting corn increased cover crop biomass production in the spring.
- Terminating the cover crop a few days before planting corn generally resulted in reduced yields at both farms regardless of N strategy.
- Fall manure with 35 lb N/ac at corn planting and 90 lb N/ac at side-dress resulted in no yield drag at Sloan’s when the cover crop was terminated 3 days before planting corn.
A strip at Dick Sloan’s where the cover crop was terminated 3 days before planting corn on May 8. Photo taken on June 15 during side-dress N application.
Background
Recent work by Practical Farmers of Iowa (Gailans et al., 2014) and researchers at Iowa State University (Pantoja et al., 2015) have found that corn following a cereal rye cover crop does not need more N fertilization than corn following no cover crop. In these cases, the cover crop was terminated 7-14 days prior to corn being planted. Last year, PFI farmer-cooperator Dick Sloan attempted “planting green”: planting his corn into a cereal rye cover crop that was terminated just two days prior. In Sloan’s case, he saw a 5 bu/ac yield reduction compared to where he terminated the cover crop two weeks prior to planting corn yet stands were equal between the two treatments (Gailans and Sloan, 2016). Recent research in Iowa has found increased disease pressure on corn seedlings when narrowing the time between cover crop termination and corn planting (Acharya et al., 2017). Previous research in North Carolina has also documented corn yield reductions with a cover crop termination within a few days of corn planting due to soil and N fertilizer immobilization by the cover crop (Vaughn and Evanylo, 1998). This work, however, has not deterred PFI farmer-cooperators who want to reap more cover crop growth and environmental benefit ahead of their corn crops in the spring.
The objective of this research project was identify possible N fertilizer strategies for successfully growing corn following a cover crop terminated near the time of corn planting. Both farmer-cooperators involved in this project compared cover crop termination dates and N application strategies for corn. Tim Sieren participated and said, “I have multiple sources and methods of N application, and this will help determine which is most profitable. I want to learn more about fine tuning N applications to corn following rye, and learn more about terminating rye to get the maximum biomass ahead of corn planting. I hope to gain more experience with rye as a cover crop, and give me more confidence in terminating taller rye.” Dick Sloan participated again and added, “I want to achieve maximum growth and benefits [from my cover crop] without limiting corn yield. I hope others will gain confidence to add cover crops to their farm systems if we share practical management tips and lessons.”
Methods
This study was conducted by Dick Sloan near Rowley in Buchanan County and Tim Sieren near Keota in Washington County.
Sloan conducted the trial in two separate fields: one that was previously in corn and one that was previously in soybeans. Treatments at the Sloan farm included cover crop termination date and N application rate (Table 1). In both fields, cover crops were either terminated 21 days before planting corn (DBP) or 3 DBP. In the field previously in corn, the total amount of N applied amounted to 181 and 201 lb N/ac. This was achieved with 3,600 gal/ac hog manure (76 lb N/ac) injected in November 2016; 35 lb N/ac as UAN applied at the time of corn planting; and side-dress applications of 70 or 90 lb N/ac as UAN in June. In the field previously in soybeans, the total amount of N applied amounted to 150 and 170 lb N/ac. This was achieved with 15 lb N/ac as MAP applied before planting; 35 lb N/ac as UAN applied at the time of corn planting; and side-dress applications of 100 or 120 lb N/ac as UAN in June. In both fields, treatments were arranged in a randomized complete block split plot design. Cover crop termination date was the main plot factor and N fertilizer rate comprised the sub-plots. Each cover crop termination date x N fertilizer rate combination was replicated four times. Strips ran the length of the field.

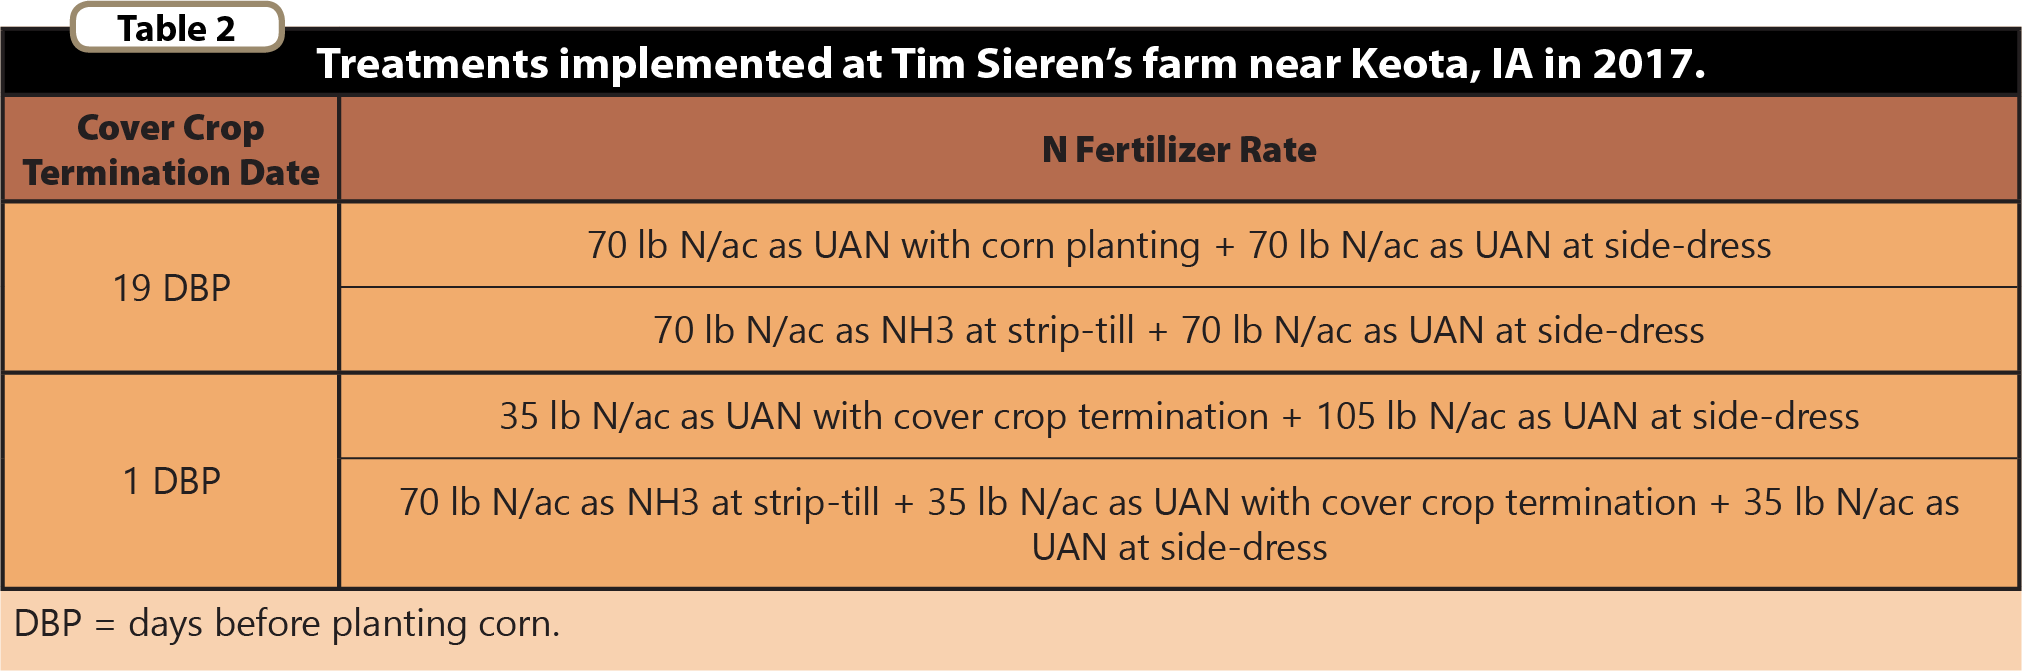
Sieren conducted the trial in a field previously sown to soybeans. Treatments at the Sieren farm comprised four cover crop termination date × N fertilizer strategy systems (Table 2). Similar to the Sloan farm, cover crops were either terminated 19 DBP or 1 DBP. Where cover crops were terminated 19 DBP, N fertilizer was applied in one of two ways: 70 lb N/ac as UAN with the corn planter + 70 lb N/ac as UAN at side-dress or 70 lb N/ac as anhydrous ammonia at the time of strip-tilling + 70 lb N/ac as UAN at side-dress. Where cover crops were terminated 1 DBP, N fertilizer was applied in one of two other ways: 35 lb N/ac as UAN at the time of cover crop termination (carrier with herbicide burndown) + 105 lb N/ac as UAN at side-dress or 70 lb N/ac as anhydrous ammonia at the time of strip-tilling + 35 lb N/ac as UAN at the time of cover crop termination (carrier with herbicide burndown) + 35 lb N/ac as UAN at side-dress. Regardless of when the cover crop was terminated, a total of 140 lb N/ac was applied to the corn in all treatments. The four cover crop termination date × N fertilizer strategy systems were replicated four times and arranged in a randomized complete block design. Strips ran the length of the field.
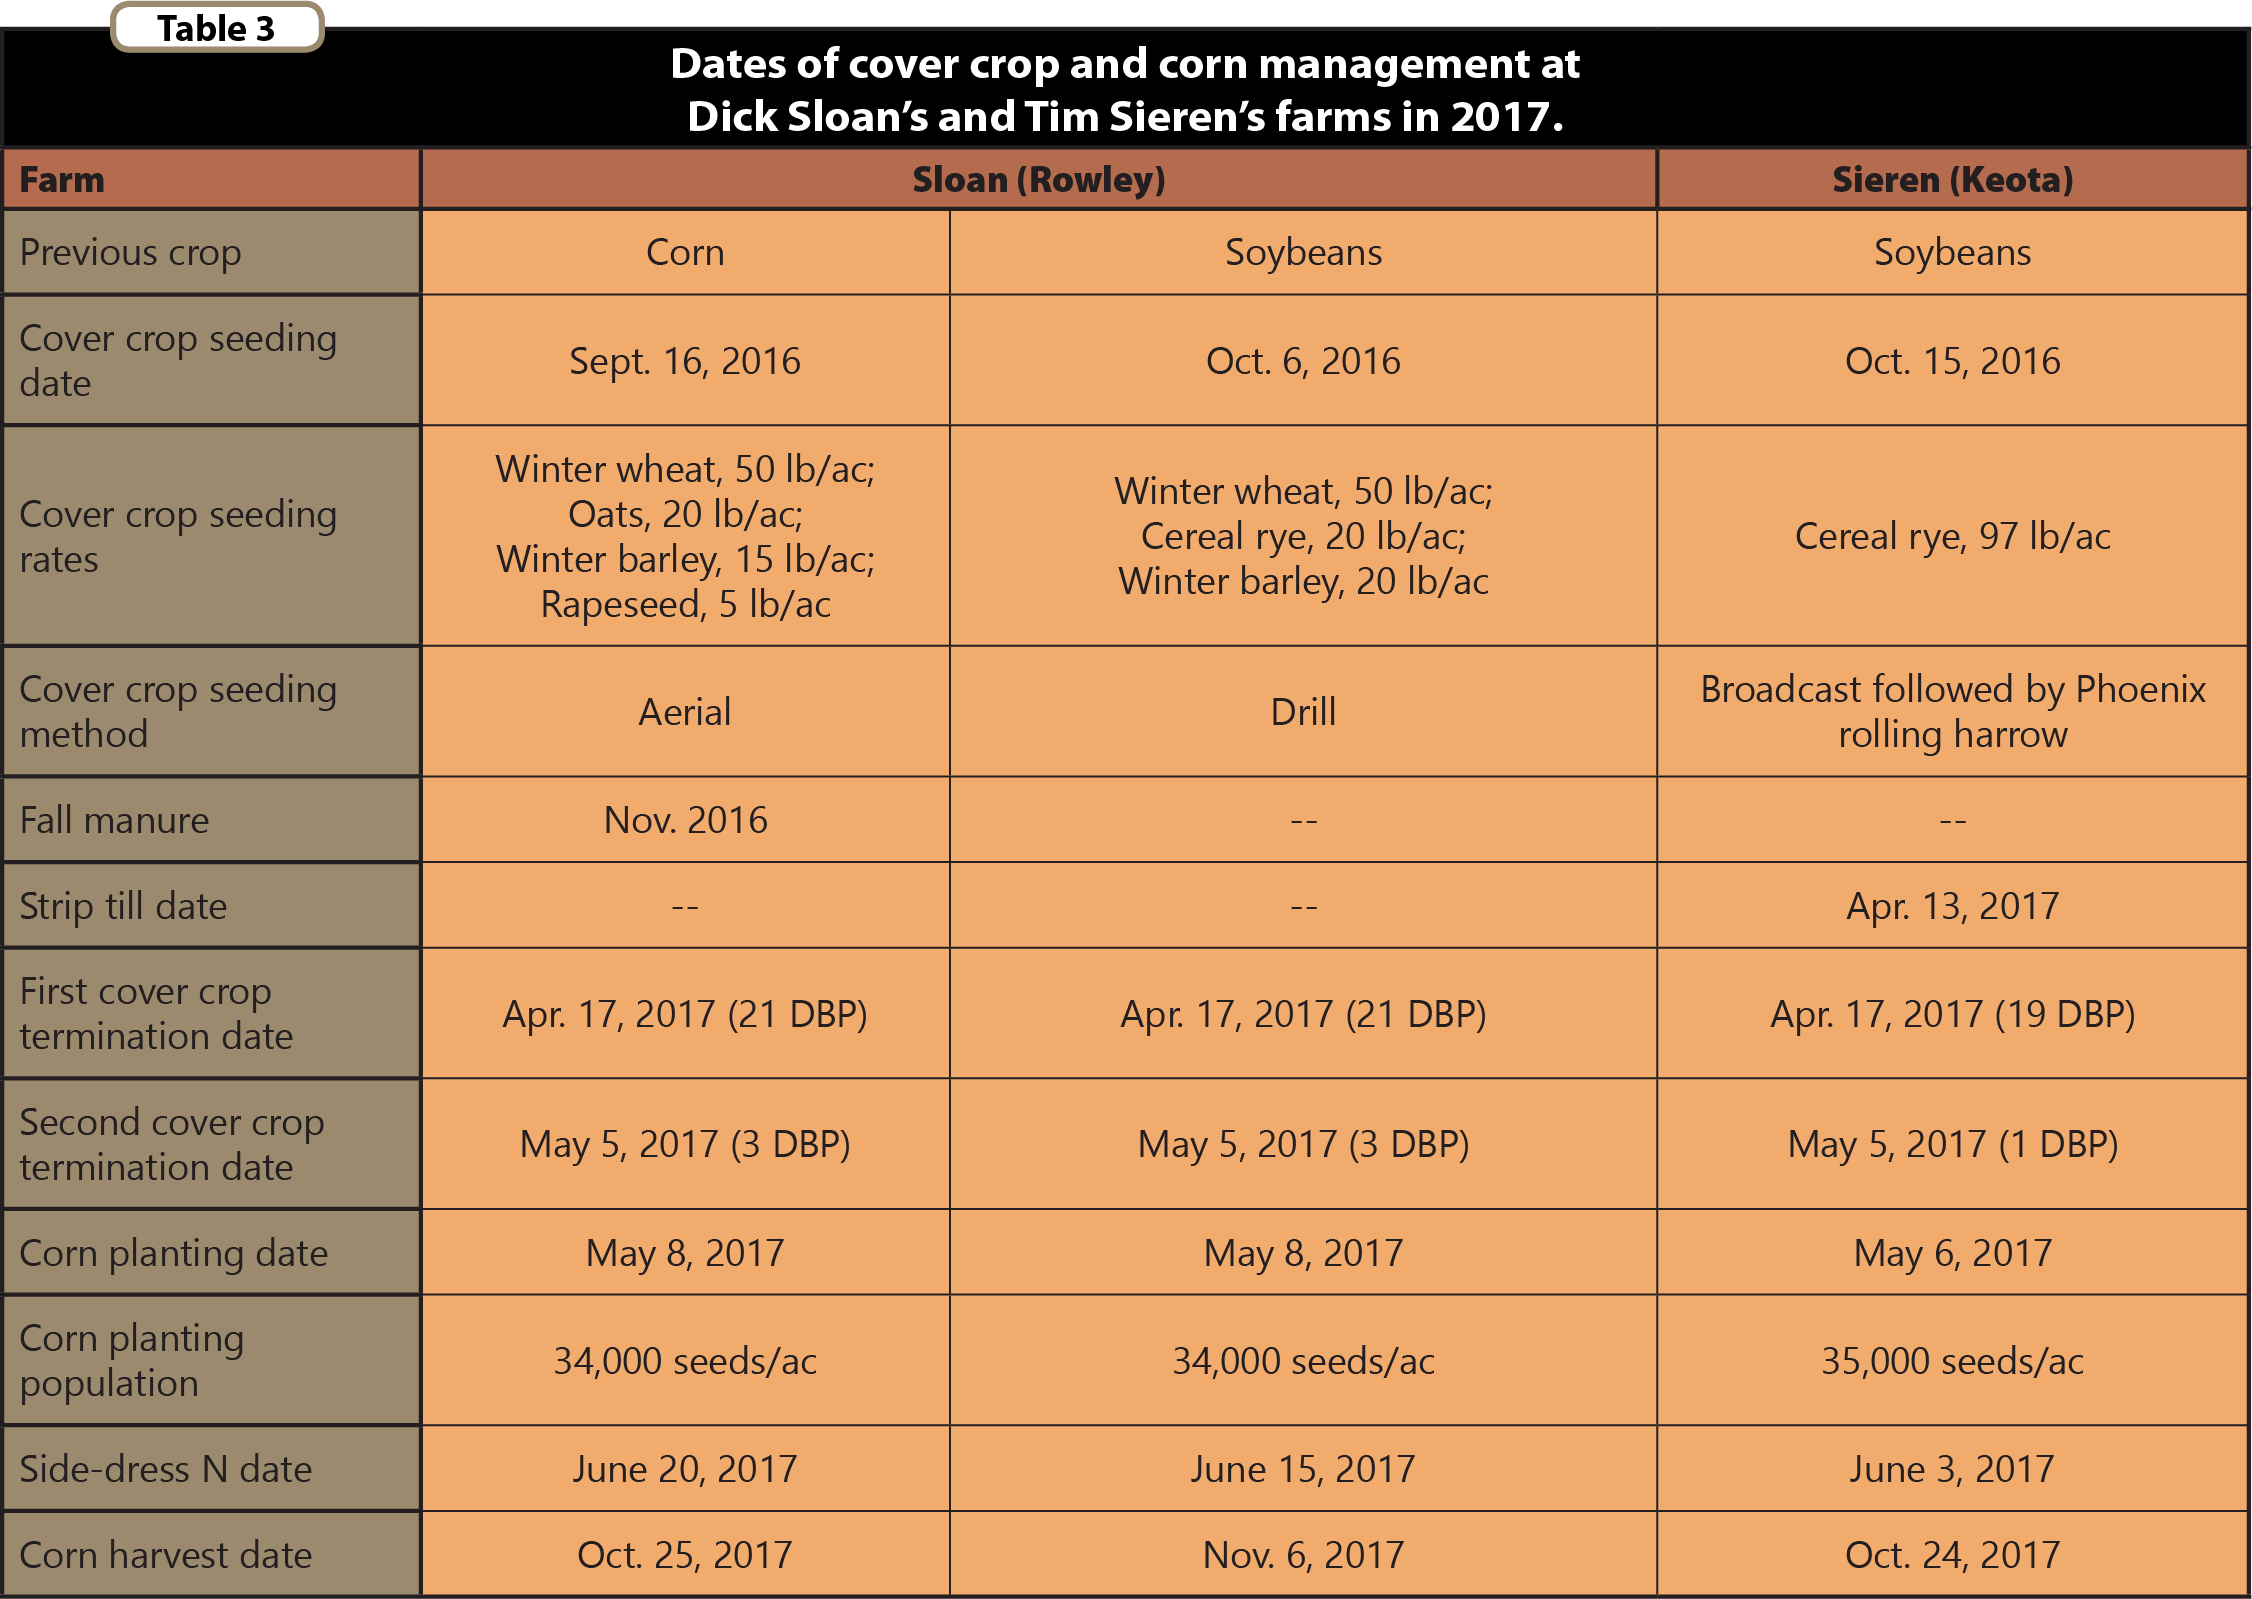
Cover crop and corn management for the two farms is presented in Table 3. Sloan aerially seeded a mix of winter wheat, oats, winter barley and rapeseed to the field previously in corn and drilled a mix of winter wheat, winter barley and cereal rye in the field previously in soybeans. Sieren broadcast and incorporated bin run cereal rye that he raised on his farm. Sieren strip-tilled and applied liquid P and K fertilizer to the entire site with a narrow anhydrous ammonia knife prior to the first cover crop termination date (19 DBP). Nitrogen fertilizer at strip-till was only applied to specified strips.
Cover crops were terminated at Sloan’s in both fields and at both dates with Gramoxone (2 pt/ac), LV-4 (1 pt/ac) and Atrazine 90 DF (1 lb/ac). Sieren terminated his cover crop with Glystar 5: 32 oz/ac for the Apr. 17 date; 35 oz/ac for the May 5 date.
Corn was planted on the same date by farm into all treatments. In-season weed control at Sloan’s was achieved with Breakfree ATZ Lite (4 pt/ac) and Durango (48 oz/ac) as well as Asana XL (9.6 oz/ac) to control army worms on May 26 in all strips in both fields. Sieren applied Trizmet II (2.1 qt/ac), metolachlor (1 pt/ac) and 2,4-D LV-6 (0.5 pt/ac) on May 9 and Callisto (3.0 oz/ac) and Atrazine 90 DF (0.4 lb/ac) on June 8 to control weeds in all strips.

Dick Sloan planting corn into a strip where the cover crop was terminated 3 days prior. Strips on either side are those where the cover crop was terminated 21 days prior. Photo taken on May 8.
Aboveground cover crop biomass was assessed at both termination dates at both farms by clipping shoot material from quadrats (one ft x one ft) placed in each strip. Samples were air-dried for three weeks and weighed.
Stand counts in each strip in both fields on the Sloan farm on Oct. 1 and 9. From one position in each strip, Sloan counted the number of corn plants in a length of row measuring 17 ft 5 in. Sieren also conducted stand counts on Sept. 24.
Cornstalk samples were collected on Oct. 1 and 9 (Sloan) and Sept. 24 (Sieren) for the purposes of a fall stalk nitrate test in accordance with Blackmer et al. (1996). Samples at Sloan’s were bulked across replications for each treatment which precluded statistical analysis.
Corn was harvested individually from each strip on both farms and corrected to 15.5% moisture.
Data were analyzed using JMP Pro 12 (SAS Institute Inc., Cary, NC). Statistical significance is determined at the P ≤ 0.05 level. Means separations are reported using Tukey’s Least Significant Difference (LSD).
Results and Discussion
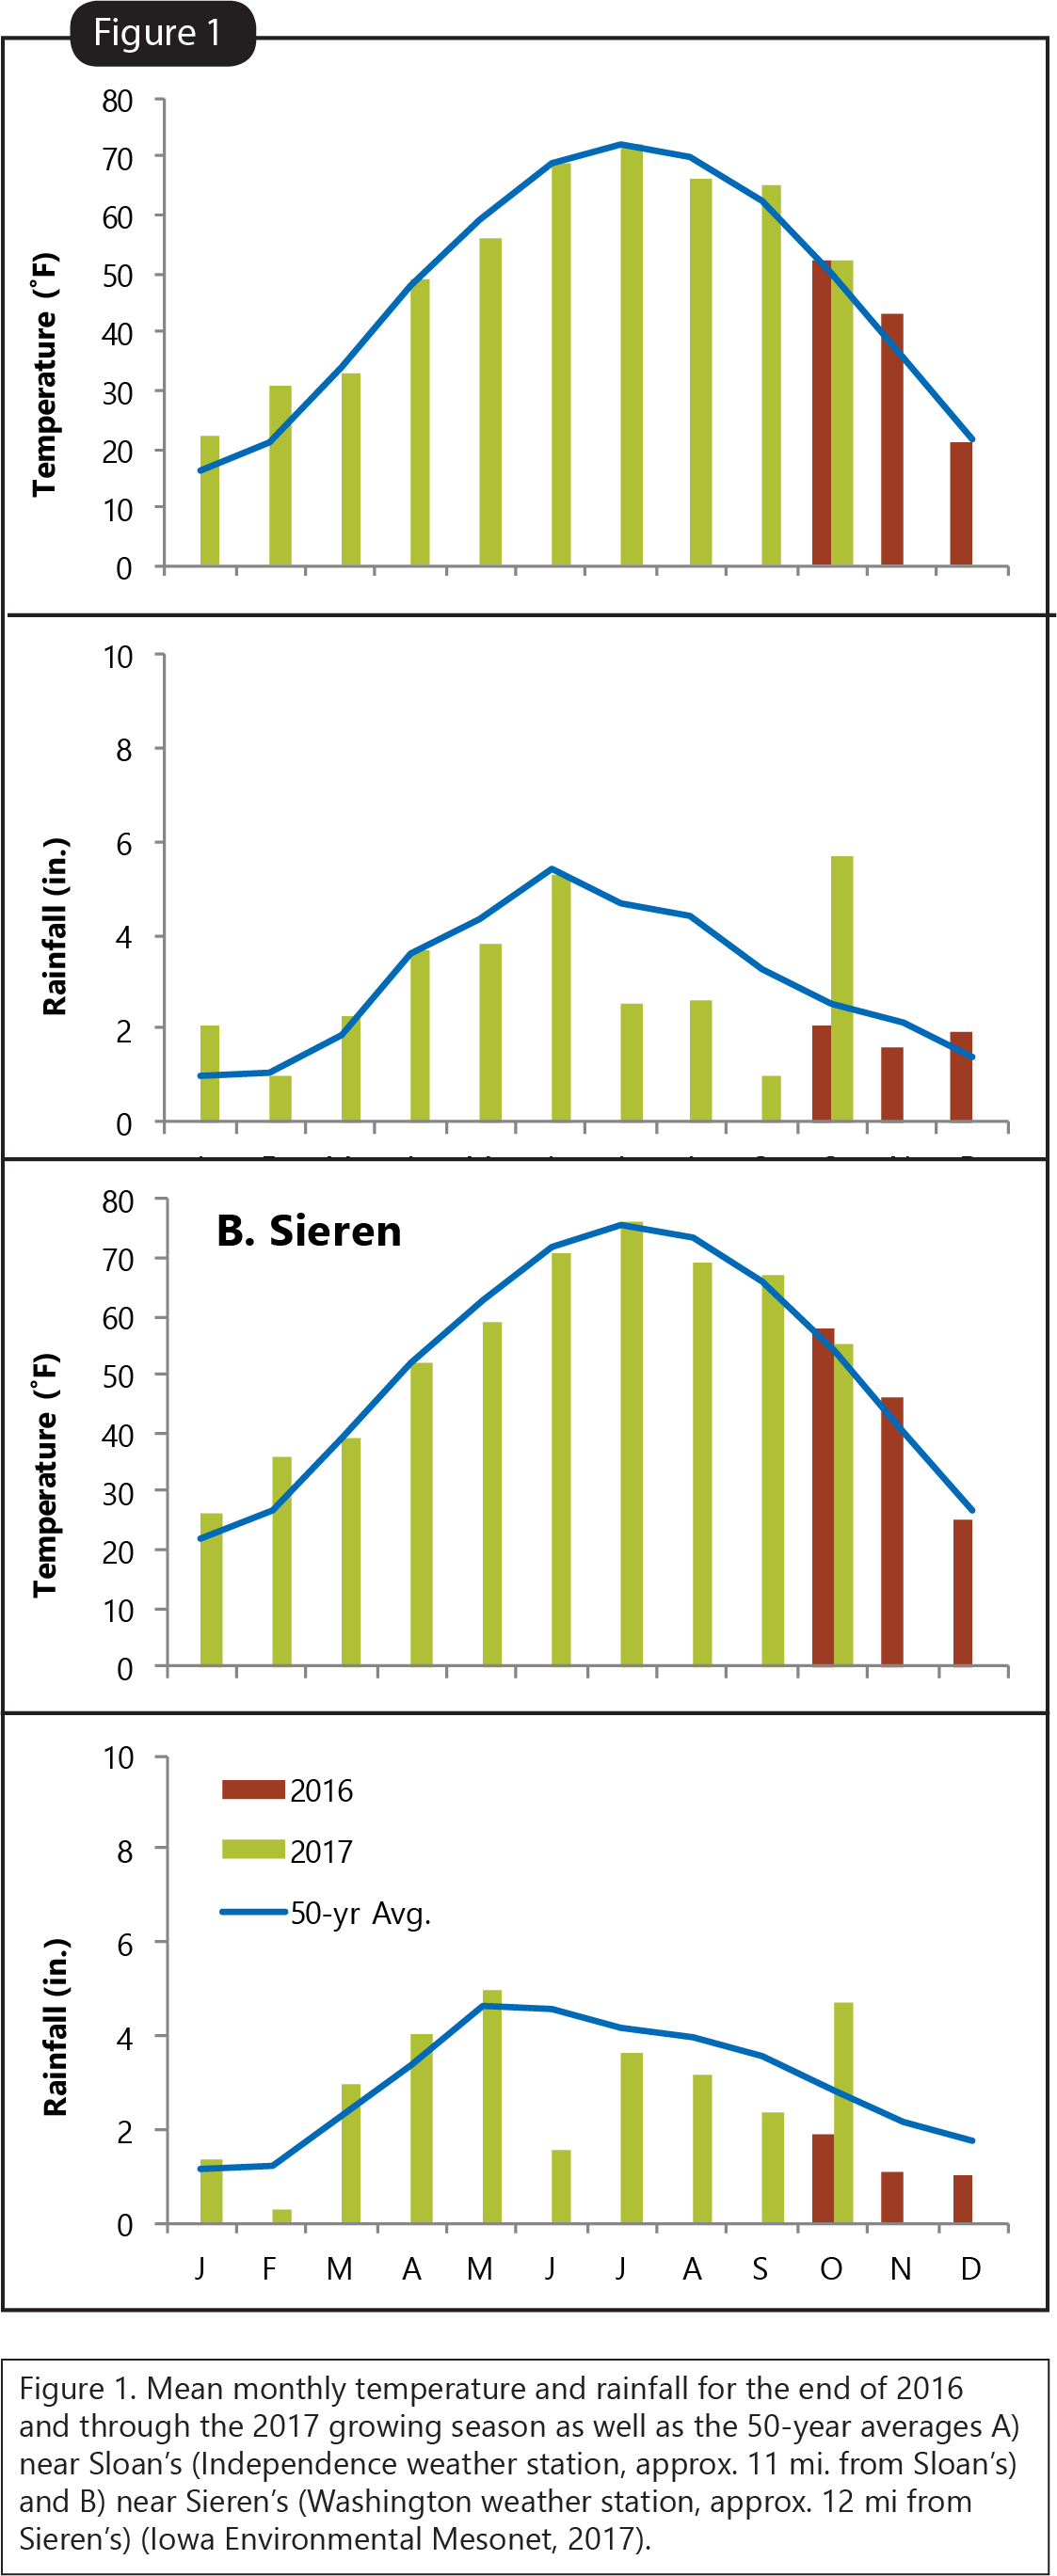
Mean monthly temperature and total monthly rainfall for late 2016 through 2017 near Sloan’s and Sieren’s farms compared to the 50-year averages are presented in Figure 1. At Sloan’s, warmer and wetter than average conditions during the Fall of 2016 and Winter of 2017 made for favorable conditions for cover crop establishment and survival. At Sieren’s, fall and winter temperatures were near or slightly above average with below average precipitation. Spring 2017 temperatures and rainfall did not deviate from the long-term averages at both locations until the summer when conditions were much drier than normal.
 Cover crop growth
Prior to each cover crop termination, Sloan and Sieren collected samples of aboveground cover crop biomass. At either farm, when the cover crops were allowed to grow until the May 5 termination, the cover crops produced over twice as much aboveground biomass as the cover crops terminated on Apr. 17 (Figure 2). “Some of the residue from the May termination was still there at corn harvest!” Sieren said. Sloan observed a similar persistence of cover crop residue.

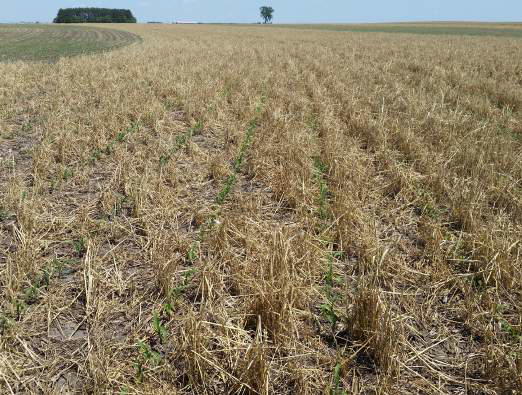
Corn emerging from a strip where the cover crop was terminated 3 days before planting corn on May 8 at Dick Sloan’s. Photo taken on June 2.
Corn—Sloan Farm
Sloan conducted corn stand counts on Oct. 1 and 9. In either field, there was no difference in plant population among the cover crop termination date and N rate treatments (Tables 4 and 5). In the field previously in corn, the average population was 32,063 plants per acre (Table 4); in the field previously in soybean, 30,688 plants per acre (Table 5). Sloan’s target planting population was 34,000 seeds per acre (Table 3).
Stalk nitrate concentrations in early October fell in the “low” (<250 ppm) and “marginal” (250–700 ppm) categories in the field previously in corn (Table 4) and in the “excessive” (>2,000 ppm) category in the field previously in soybean (Table 5) (Blackmer et al., 1996). These would suggest that the corn following corn might have benefited from more N while the corn following soybean had more than enough available N. It is important to note the excessive stalk nitrate concentrations in the field previously in soybean (Table 5) in light of the drier-than-normal July–September period at Sloan’s (Figure 1A). This might suggest that moisture at the Sloan farm did not limit corn N uptake and was not the culprit for the low stalk nitrates in the field previously in corn (Table 4).
Corn yields at Sloan’s were affected by cover crop termination date in both fields (Tables 4 and 5). On average, corn yields were 235 vs. 229 bu/ac for the 21 DBP and 3 DBP cover crop termination dates, respectively, when corn followed corn (Table 4). When corn followed soybeans, corn yields were 245 vs. 230 bu/ac for the 21 DBP and 3 DBP cover crop termination dates, respectively (Table 5). In the field previously in corn, which received fall manure, the higher N rate (90 lb N/ac side-dress) was enough to overcome any yield drag from the 3 DBP cover crop termination date (Table 4). In the field previously in soybeans, which did not receive fall manure, the higher N rate (120 lb N/ac side-dress) was not enough to overcome the effect of terminating the cover crop 3 DBP (Table 5). Despite the very dry summer (Figure 1A), corn yields from both treatments in both fields at Sloan’s were well above the 3-year corn yield average for Buchanan County of 189 bu/ac (USDA-NASS, 2017).
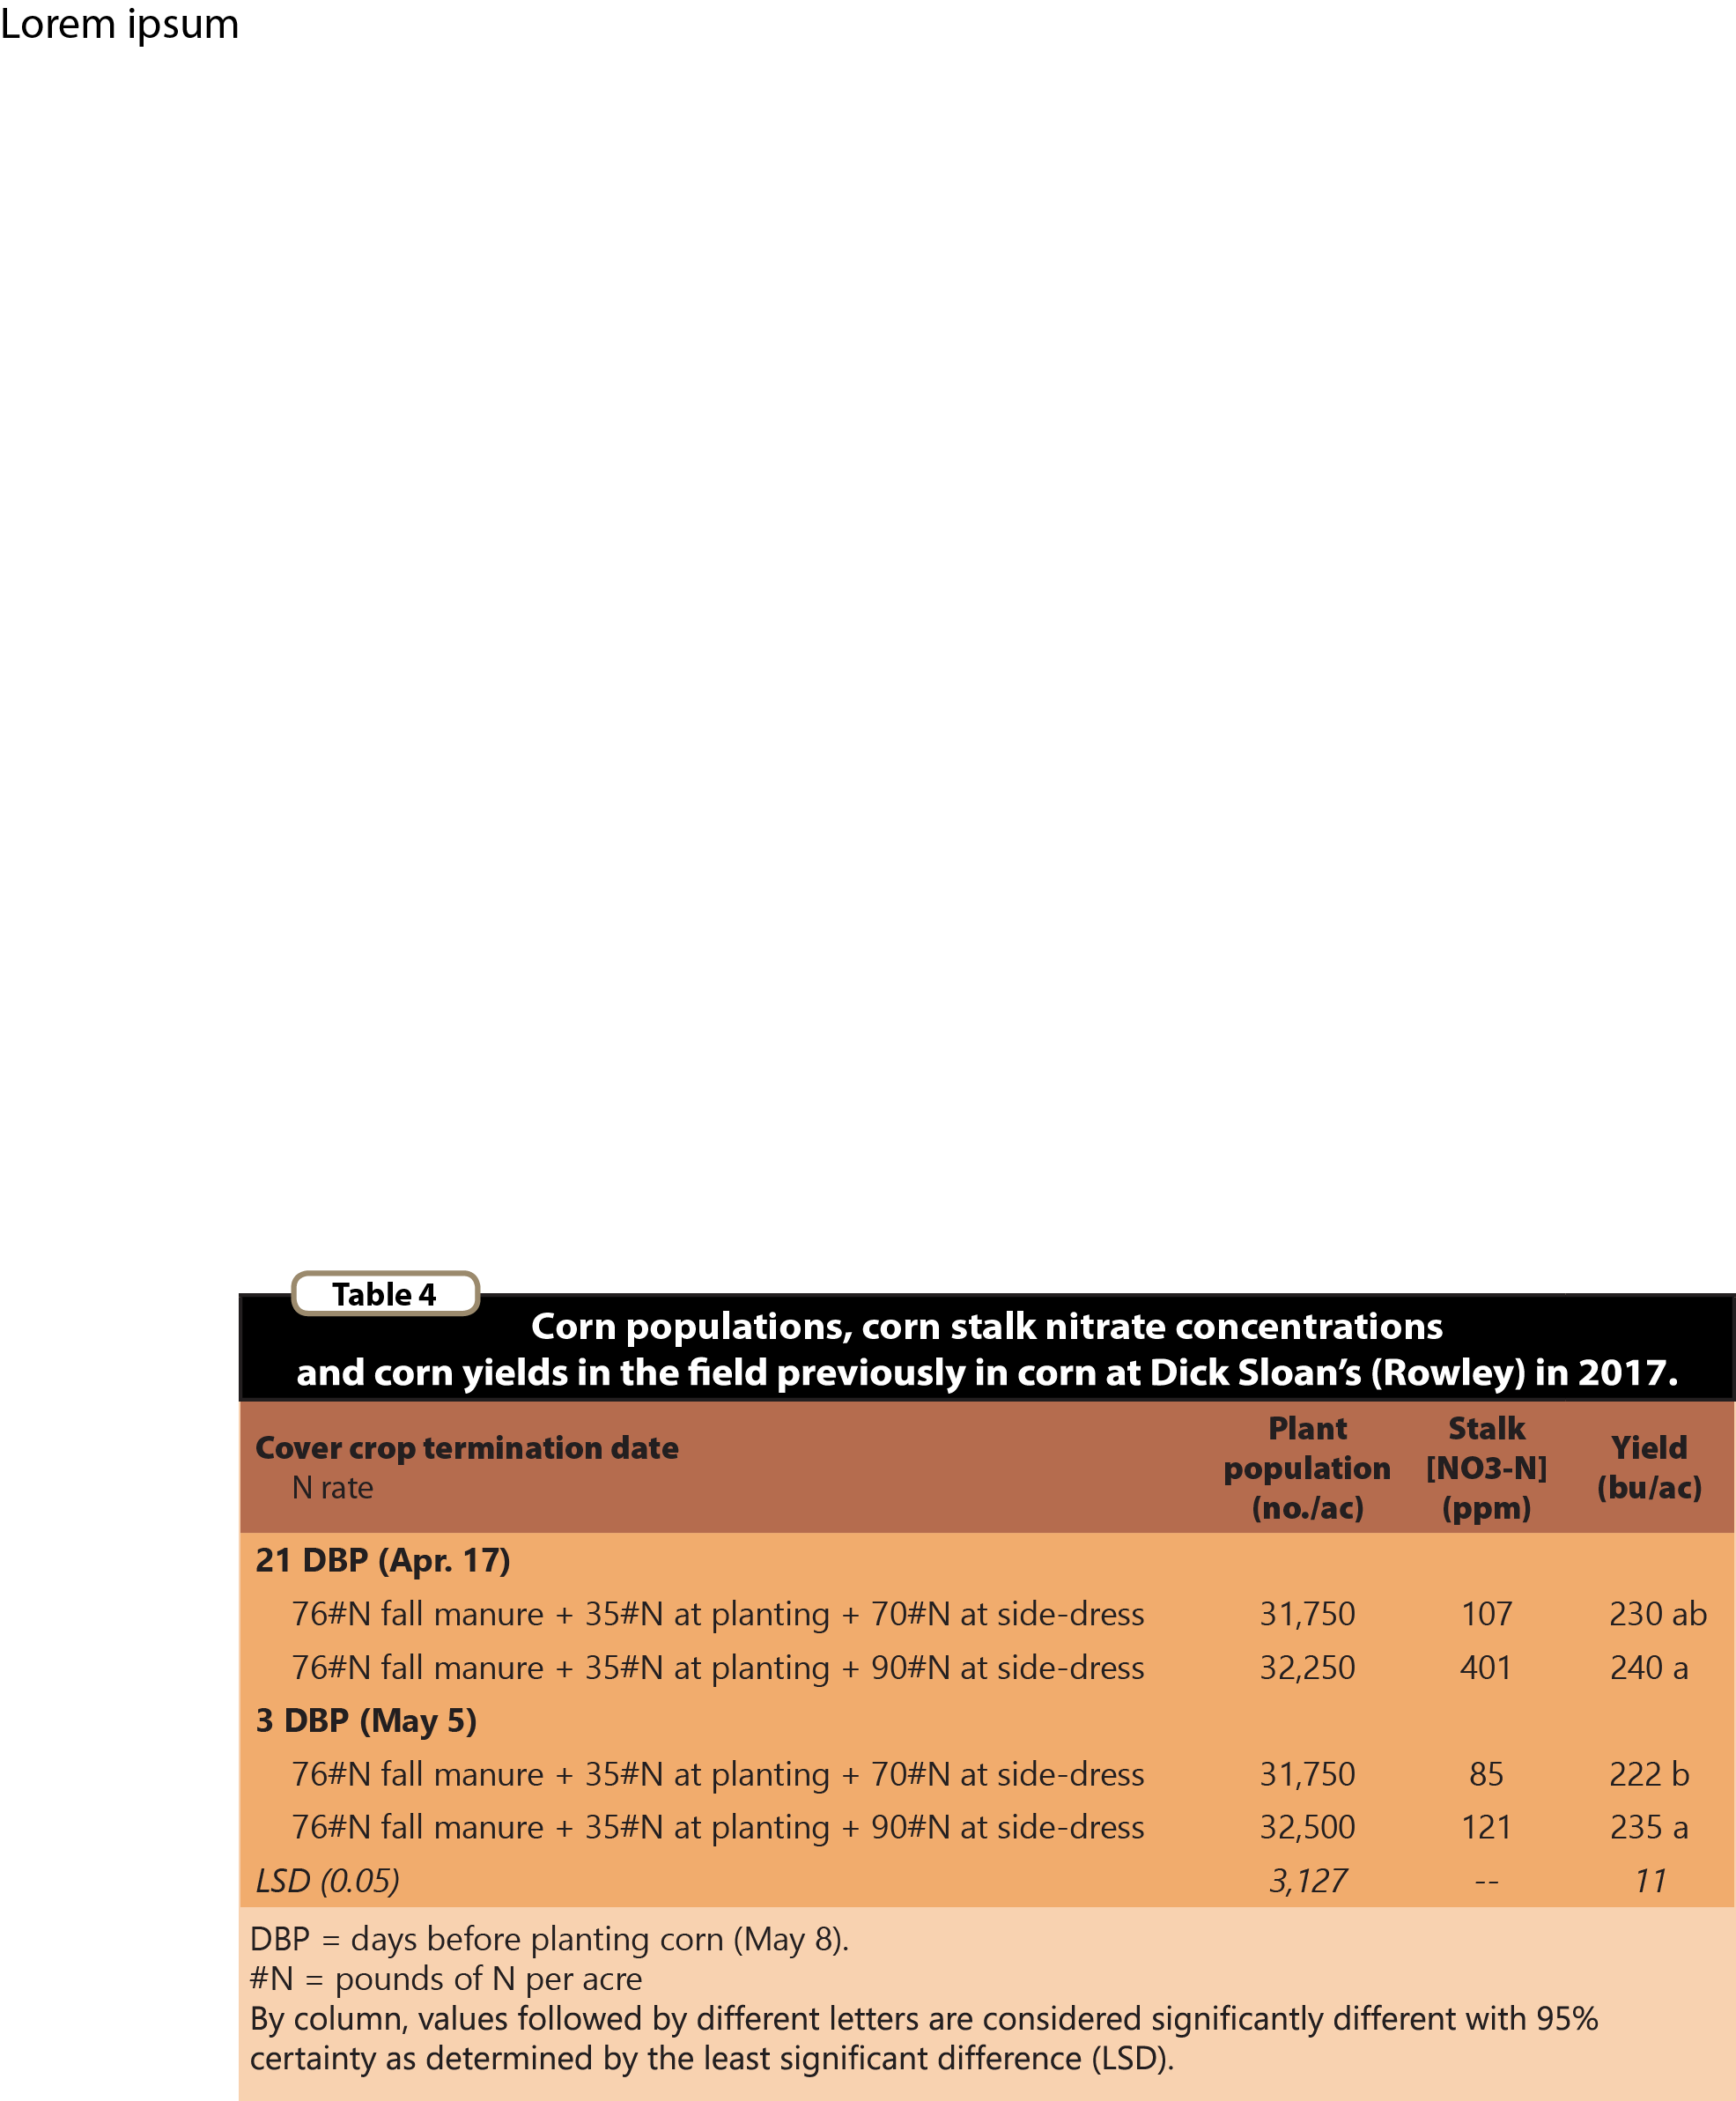
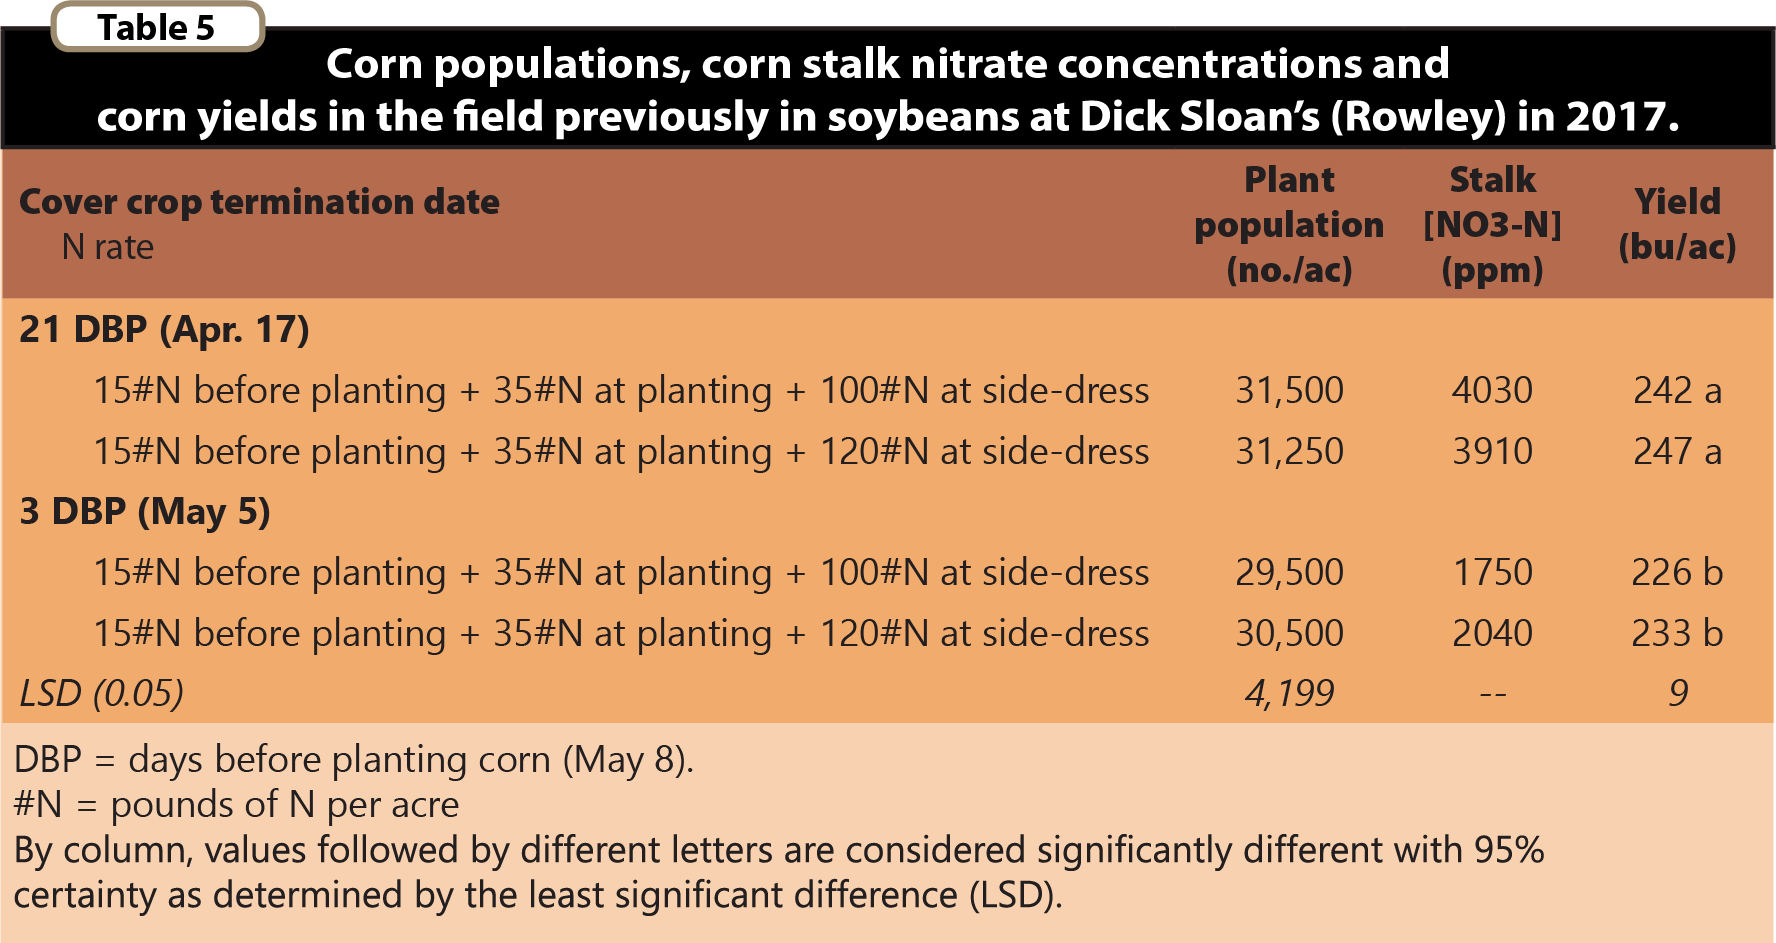 Interestingly, in the field previously in soybeans, corn yields were reduced with the 3 DBP cover crop termination date but populations were not affected and corn stalk nitrate concentrations were excessive (Table 5). This would suggest ample availability of N but an inability by the corn to sufficiently use the N to reach maximum yield. It is possible that terminating the cover crop near the time of corn planting stressed that corn early in the season: either by limiting early N uptake (Vaughn and Evanylo, 1998) and/or by providing a “green bridge” for corn seedling diseases (Acharya et al., 2017). In the field previously in corn, the corn that received 201 lb N/ac (as fall manure and fertilizer) resulted in equivalent yields when the cover crops were terminated 21 DBP or 3 DBP (Table 4). The application of fall manure may have helped that corn overcome any early season N deficiency or disease pressure that might have occurred with the 3 DBP cover crop termination date. The maximum N rate in the field previously in soybean was 170 lb N/ac and was probably not enough to overcome early season stress on the corn in the 3 DBP cover crop termination date.
Cover crop species composition between the two fields at Sloan’s could have also played a role in the cover crop’s affect on corn yields. The cover crop in the field previously in corn did not contain cereal rye, whereas the cover crop in the field previously in soybean did contain cereal rye (Table 3). In 2016, Sloan also saw a corn yield reduction when terminating a cover crop that included cereal rye two days before planting corn (Gailans and Sloan, 2016). Some farmers have claimed that a winter wheat cover crop is less aggressive in the spring than a cereal rye cover crop. Indeed, the cover crop in the field previously in corn (winter wheat, oats, winter barley, rapeseed) produced less biomass than the cover crop in the field previously in soybeans (winter wheat, cereal rye, winter barley) by the 3 DBP (May 5) termination date (Figure 2). “The corn after corn plot did not have the same level of competition between covers and corn as the corn that followed soybeans,” Sloan said. This occurred despite the cover crop in the field previously in corn receiving fall manure and being seeded three weeks earlier than the cover crop seeded in the field previously in soybean (Table 3). Thus, lower yields in the present study with the 3 DBP cover crop termination date in the field previously in soybean may have resulted from 1) not enough N applied and/or 2) increased cover crop growth, possibly due to the inclusion of cereal in the mix.
Corn—Sieren Farm
Sieren conducted corn stand counts on Sept. 24. On average, he reported populations in all strips to be 34,000 plants/ac. His target planting population was 35,000 seeds per acre (Table 3).
Stalk nitrate concentrations in late September fell in the “low” category (<250 ppm; Blackmer et al., 1996) for all treatments at the Sieren farm (Table 6). These would suggest that the corn in all treatments would have likely benefited from more N—either added as fertilizer or made more available from the soil. The drier-than-normal June–September period (Figure 1B) may have also limited corn N uptake from the soil at Sieren’s and contributed to the low stalk nitrate concentrations.
Corn yields at Sieren’s were most affected by cover crop termination date (Table 6). On average, corn yields were 228 bu/ac vs. 200 bu/ac for the 19 DBP and 1 DBP cover crop termination dates, respectively. Recall that all treatments received 140 lb N/ac, but this came in different forms and at different times among the treatments. Sieren achieved the best yields in this trial when terminating the cover crop 19 DBP and applying half the N either with the strip-till pass (just before cover crop termination) or with the corn planter and applying the remaining half as side-dress. Applying N during cover crop termination (UAN as carrier), when the cover crop was terminated 1 DBP, was not as effective a strategy.
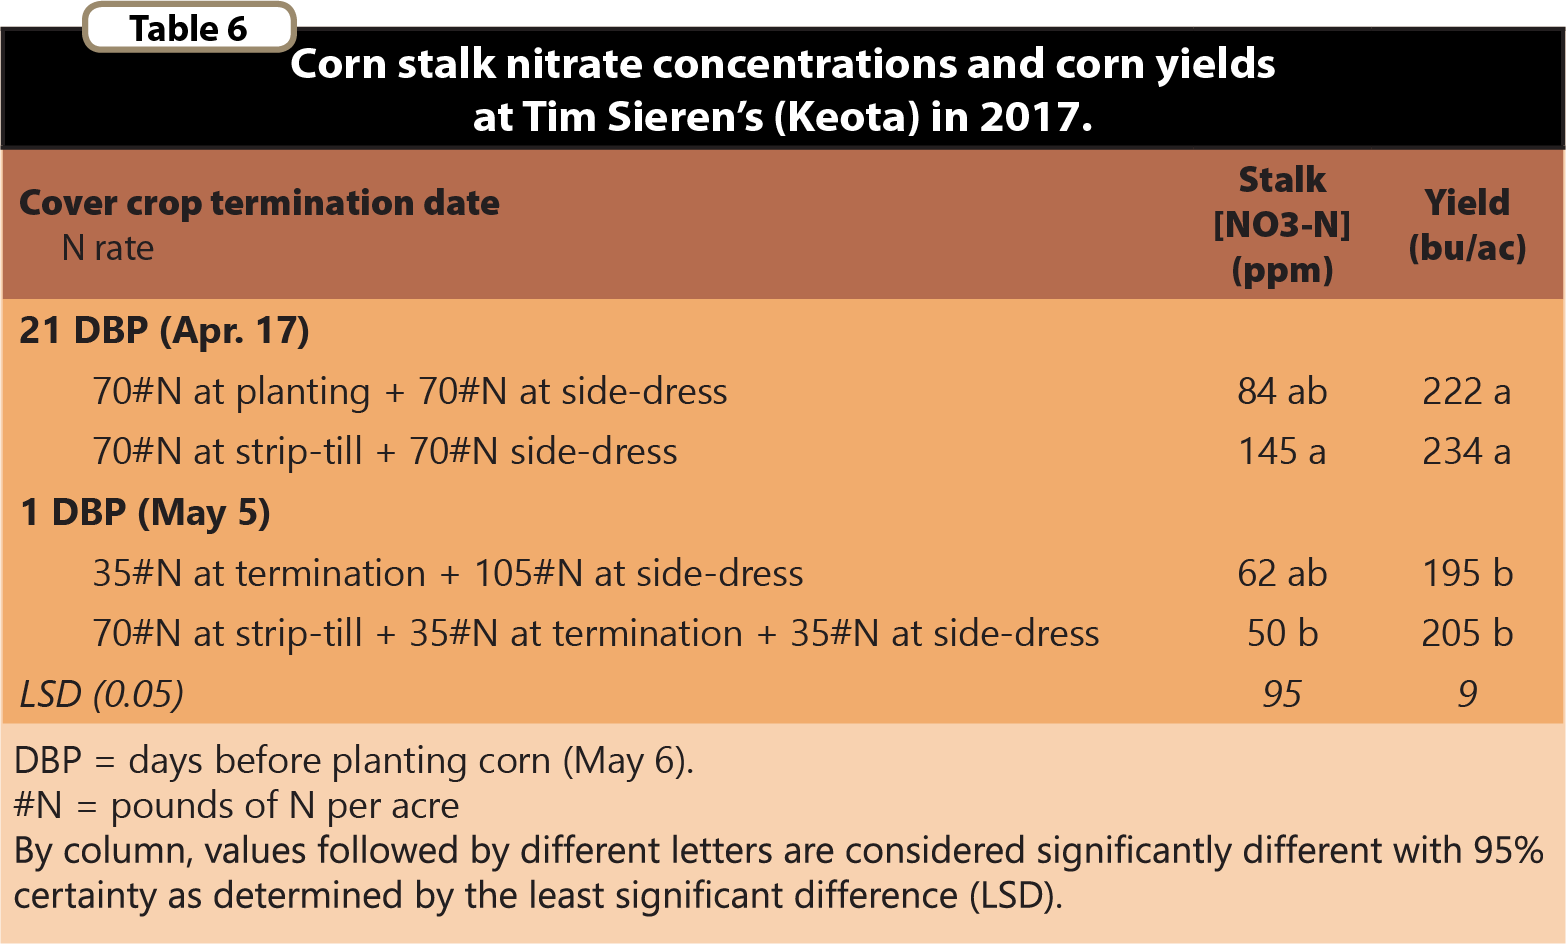
Previous research has documented corn yield reductions of 15 bu/ac with a cover crop termination date two days before corn planting (Vaughn and Evanylo, 1998). The authors of that study attributed the yield reductions to soil N depletion by the cover. In the present study, the amount of cover crop growth between the two cover crop termination dates at Sieren’s was likely a factor (Figure 2) and may have contributed to early-season N deficiency. Allowing the cover crop to grow until 1 DBP probably resulted in the cover crop sequestering soil N from the corn seedlings: the N applied with strip-till could have been taken up by the still-living cereal rye; the N applied at termination would have entered a high-residue and high C:N soil environment. “That’s the ‘carbon penalty’ of cover crops,” Sieren said. “This shows how important it is to have enough N available early [for the corn].” Indeed, when the cover crop was terminated 19 DBP, the N applied at strip-till or corn planting was probably in less danger of being tied up by the cover crop because the cover crop was either soon dead or already dead. Side-dress N applications in all treatments occurred during the June dry spell (Figure 1B) and likely limited corn N uptake during the summer months. If so, this probably affected the corn in the 1 DBP termination treatments that was likely suffering from early-season N deficiency. Sieren wondered if closer-to-normal precipitation during the summer would have helped corn N uptake in all of the treatments.
Despite below-average summer rainfall, Sieren’s corn yields (Table 6) were either similar to or greater than the three-year Washington County average of 198 bu/ac (USDA-NASS, 2017). “I think the rye cover helped to hold onto any moisture that was available,” Sieren said. “Plus it helps to keep the soil temperatures cooler when it gets hot. I like to think of rye cover as ‘weather insurance.’” This sentiment echoes findings by researchers in Iowa who attributed a mulching effect by cover crop residue conserving soil water in summer (Daigh et al., 2014; Basche et al., 2016). In fact, Daigh et al. (2014) found greater soil moisture conservation when cover crops were used compared to when they were not used during the 2012 drought year in central Iowa.
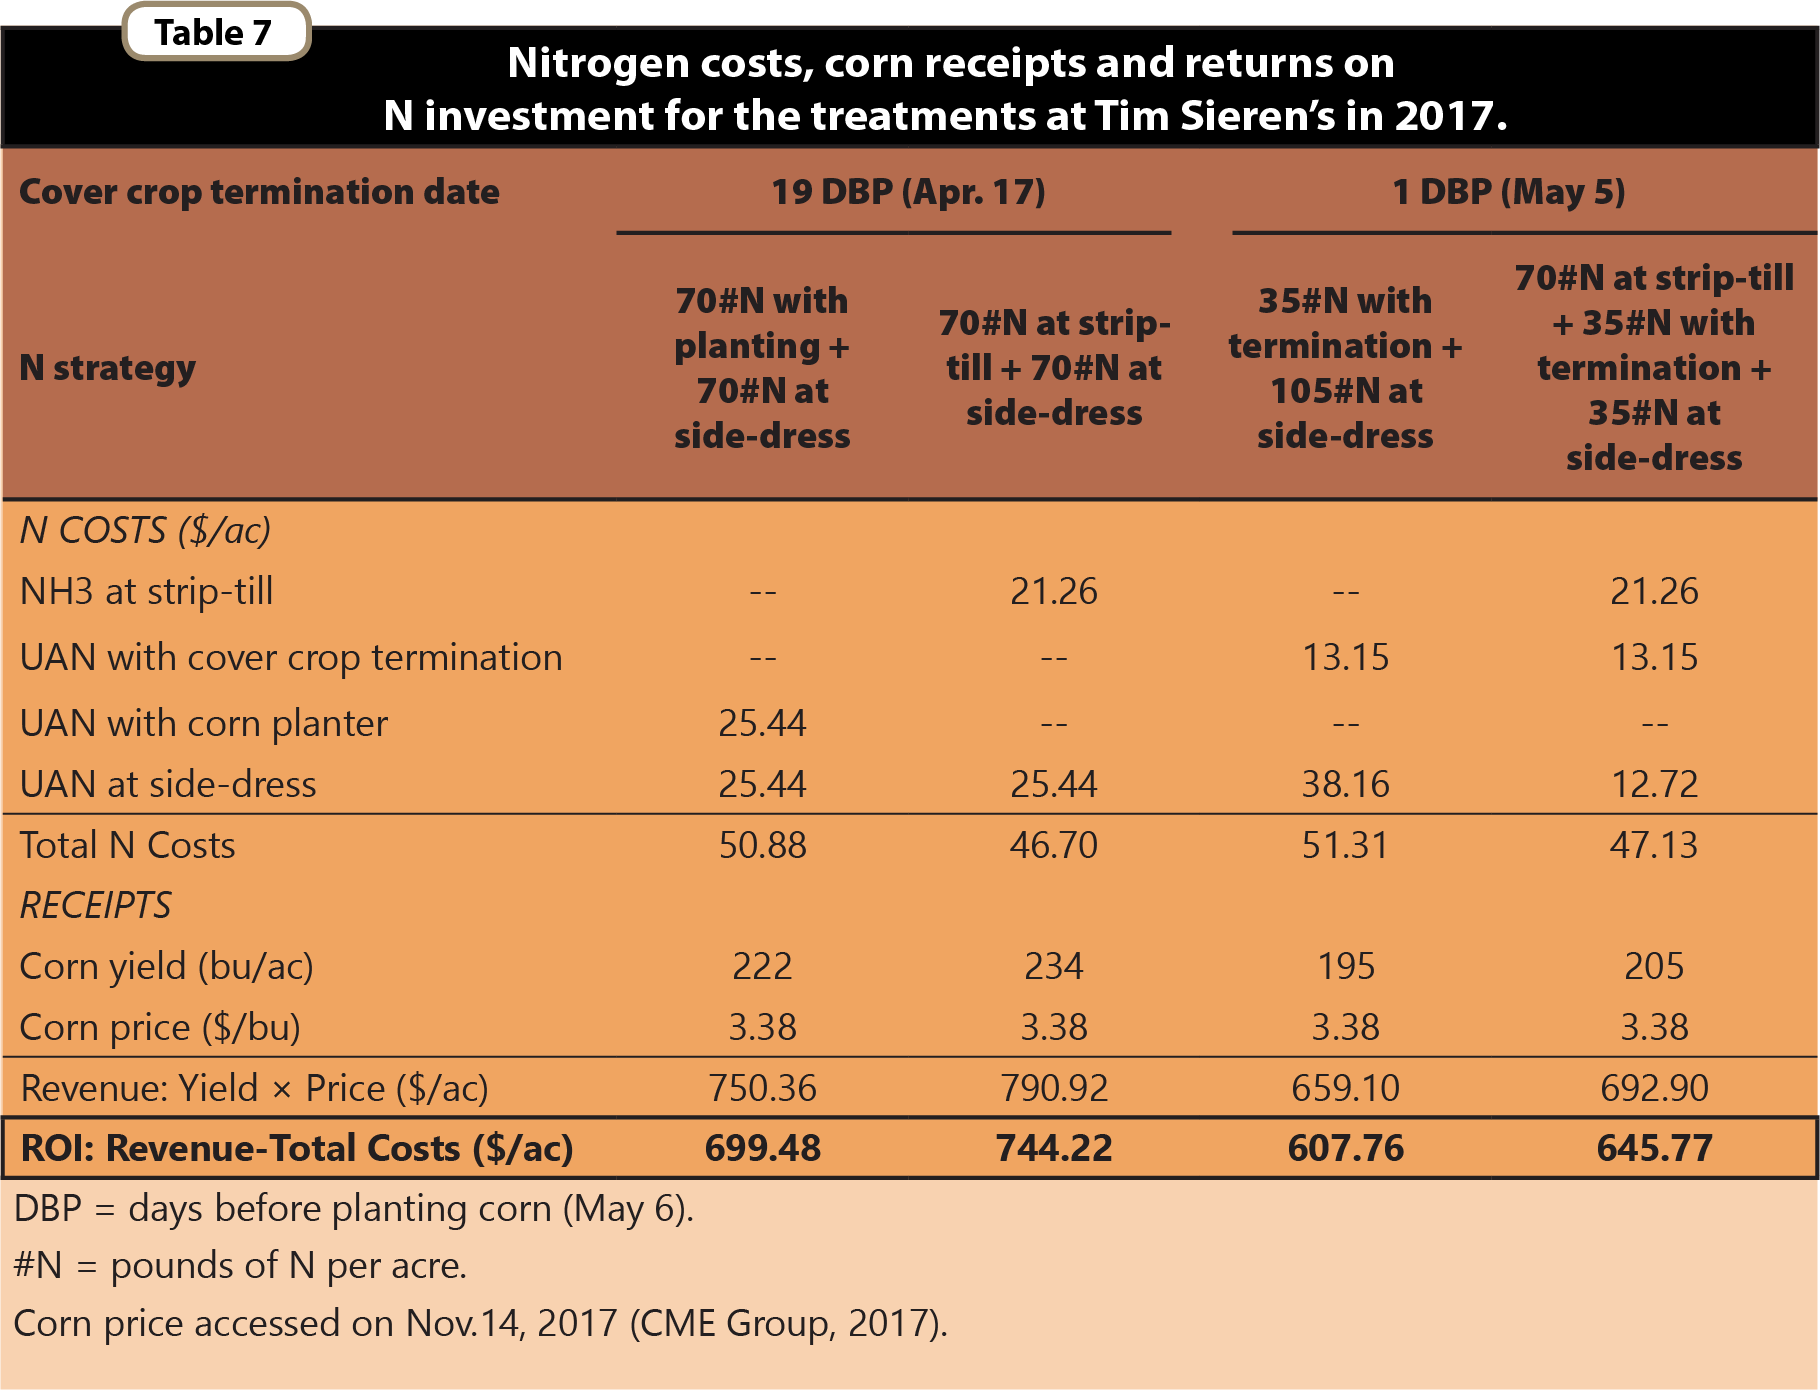
Table 7 provides a summary of N costs, corn receipts and returns on N investment for the treatments at Sieren’s. Costs associated with cover crop seeding, strip-tilling, cover crop termination, corn planting, in-season weed control, side-dressing and corn harvest were incurred among all treatments and are thus not considered when calculating the returns on investment. Rather, costs associated with N fertilizer applied were the only costs that differed among the treatments. Sieren saw greatest returns to N fertilizer strategy when the cover crops were terminated 19 DBP and yields were also greatest. Nitrogen costs were greatest and returns on investment were least when the cover crops were terminated 1 DBP. These coincided with the lowest corn yields as well (Table 6).

Corn emerging from a strip where the cover crop was terminated 21 days before planting corn on May 8 at Dick Sloan’s. Photo taken on May 18.
Conclusions and Next Steps
These trials conducted by farmer-cooperators Dick Sloan and Tim Sieren addressed N fertilizer strategies for corn that followed a cover crop that was either terminated approximately 3 weeks before corn planting or a few days before corn planting. Both cooperators were looking to produce more cover crop biomass in the spring and gain experience with planting corn shortly after terminating the cover crop. “It’s not something a farmer would normally do,” Sloan said, but that is why both cooperators saw reason for them to explore this subject.
Across both farms, terminating the cover crop near the time of corn planting (3 or 1 DBP) often resulted in a yield reduction compared to when the cover crop was terminated about 3 weeks prior to corn planting (21 or 19 DBP) (Tables 4, 5 and 6). Higher N rates or varying the N strategy at the farms did not appear to overcome the yield reducing effects of terminating the cover crop near corn planting. The exception came where Sloan followed corn with corn and applied fall hog manure in addition to applying N fertilizer at corn planting and side-dress (Table 4). In this instance, terminating the cover crop three days before planting corn resulted in no yield drag compared to when he terminated the cover crop 19 days before planting corn. It should also be noted, though, that the cover crop in this instance was made up of winter wheat, oats, winter barley and rapeseed (e.g., no cereal rye). This cover crop produced less biomass, and perhaps less early-season N stress on the corn, than the cover crop in the field previously in soybean that did include cereal rye (Figure 2). Thus, the cover crop species make up and/or the amount of cover crop growth could be a factor when terminating a cover crop just before planting corn. “It’s not the cover crop termination date, it’s the amount of biomass produced,” Sloan said. In the future, Sloan will keep a close eye on his cover crop growth: “When I have good cover crop growth, I will kill it early and plant corn early, a few days after termination, to get my corn planted earlier.”
Sieren applied 140 lb N/ac to all treatments but varied when he applied and in what form. Regardless of N strategy, he scored top returns when he terminated the cover crop 19 DBP (Table 7). In true Practical Farmer form, the results of his trial spurred several questions for Sieren: “Are all my years of rye cover starting to pay off? Is my soil biology cranking out more OM and related nutrients to feed the corn? Is the rye helping to keep the soil temperatures lower, resulting in a more favorable corn growing environment? Is the no-till/rye combo helping to use moisture more efficiently? These are all questions that need answered with proof.”
In the next few years, Practical Farmers of Iowa will be partnering with plant pathologists at Iowa State University to further explore the effects of cereal rye cover crops on corn—namely, the incidence of seedling diseases in corn building on the recent work in Iowa by Acharya et al. (2017). The project will investigate best management practices to avoid or overcome any “green bridge” the cover crop may provide for pathogens of corn. “We need to compare early kill and early plant with early kill and delayed planting,” Sloan added. “That’s the real question farmers face in the spring, and delayed planting advice is keeping farmers away from overwintering cover crops.”
References
- CME Group. 2017. Corn Futures Quotes. CME Group, Inc. Chicago, IL. http://www.cmegroup.com/trading/agricultural/grain-and-oilseed/corn.html (accessed Nov. 14, 2017).
- Acharya, J., M. Bakker, T. Moorman, T. Kaspar, A. Lenssen, and A. Robertson. 2017. Time interval between cover crop termination and planting influences corn seedling disease, plant growth, and yield. Plant Disease. 101:591–600.
- Gailans, S. and D. Sloan. 2016. Cover Crop Termination Date Ahead of Corn. Practical Farmers of Iowa Cooperators’ Program.
Ames, IA. http://practicalfarmers.org/app/uploads/2016/11/16.FC_.CC.Cover_Crop_Termination_Date_Corn.pdf (accessed Apr. 20, 2017). - Gailans, S., T. Smith, R. Stout, and J. Gustafson. 2014. Side-dressing Corn Following a Winter Rye Cover Crop—Updated 2014.
Practical Farmers of Iowa Cooperators’ Program. Ames, IA. http://practicalfarmers.org/app/uploads/2014/12/14.FC_.CC.side-dress-N_UPDATE.pdf (accessed Apr. 20, 2017). - Iowa Environmental Mesonet. 2017. Climodat Reports. Iowa State University, Ames, IA. http://mesonet.agron.iastate.edu/climodat/ (accessed Nov. 1, 2017).
- Pantoja, J., K. Woli, J. Sawyer, and D. Barker. 2015. Corn Nitrogen Fertilization Requirement and Corn–Soybean Productivity with a Rye Cover Crop. Soil Sci. Soc. Am. J. https://dl.sciencesocieties.org/publications/sssaj/articles/79/5/1482 (accessed Apr. 20, 2017).
- US Department of Agriculture-National Agricultural Statistics Service. 2016. Quick stats. USDA-National Agricultural Statistics
Service, Washington, DC. http://quickstats.nass.usda.gov/ (accessed Oct. 27, 2017). - Vaughn, J. and G. Evanylo. 1998. Corn response to cover crop species, spring desiccation time, and residue management. Agron. J. 90:536-544. https://www.researchgate.net/profile/Gregory_Evanylo/publication/237976342_Corn_Response_to_Cover_Crop_Spe-cies_Spring_Desiccation_Time_and_Residue_Management/links/548b57550cf225bf669f884d.pdf (accessed Nov. 1, 2016).