

Decomposition of Tea as a Soil Health Indicator in Agroforestry Systems
This research was funded by Ceres Trust.
In a Nutshell
- Kathy Dice assessed mass loss of green and black tea bags buried in four diverse agroforestry sites, one wooded site and one conventional crop field.
- Mass loss of plant material like tea occurs due to decomposition by soil microbial activity and serves as a proxy for soil health. Generally, the more decomposition (e.g., microbial activity), the healthier the soil.
- Assessing the mass loss of black tea relative to the mass loss of green tea provides an inexpensive measurement of a soil’s potential microbial activity independent of climate factors.
Key Findings
- The crop field resulted in the most mass loss of both teas. The native timber saw the least amount of mass loss of the green tea. Mass loss of the teas in the four agroforestry sites were often similar to the crop field.
- Using the soil decomposition index, the native timber scored the highest in terms of potential microbial activity. We saw no difference in potential microbial activity among all four agroforestry sites and the conventional crop field.
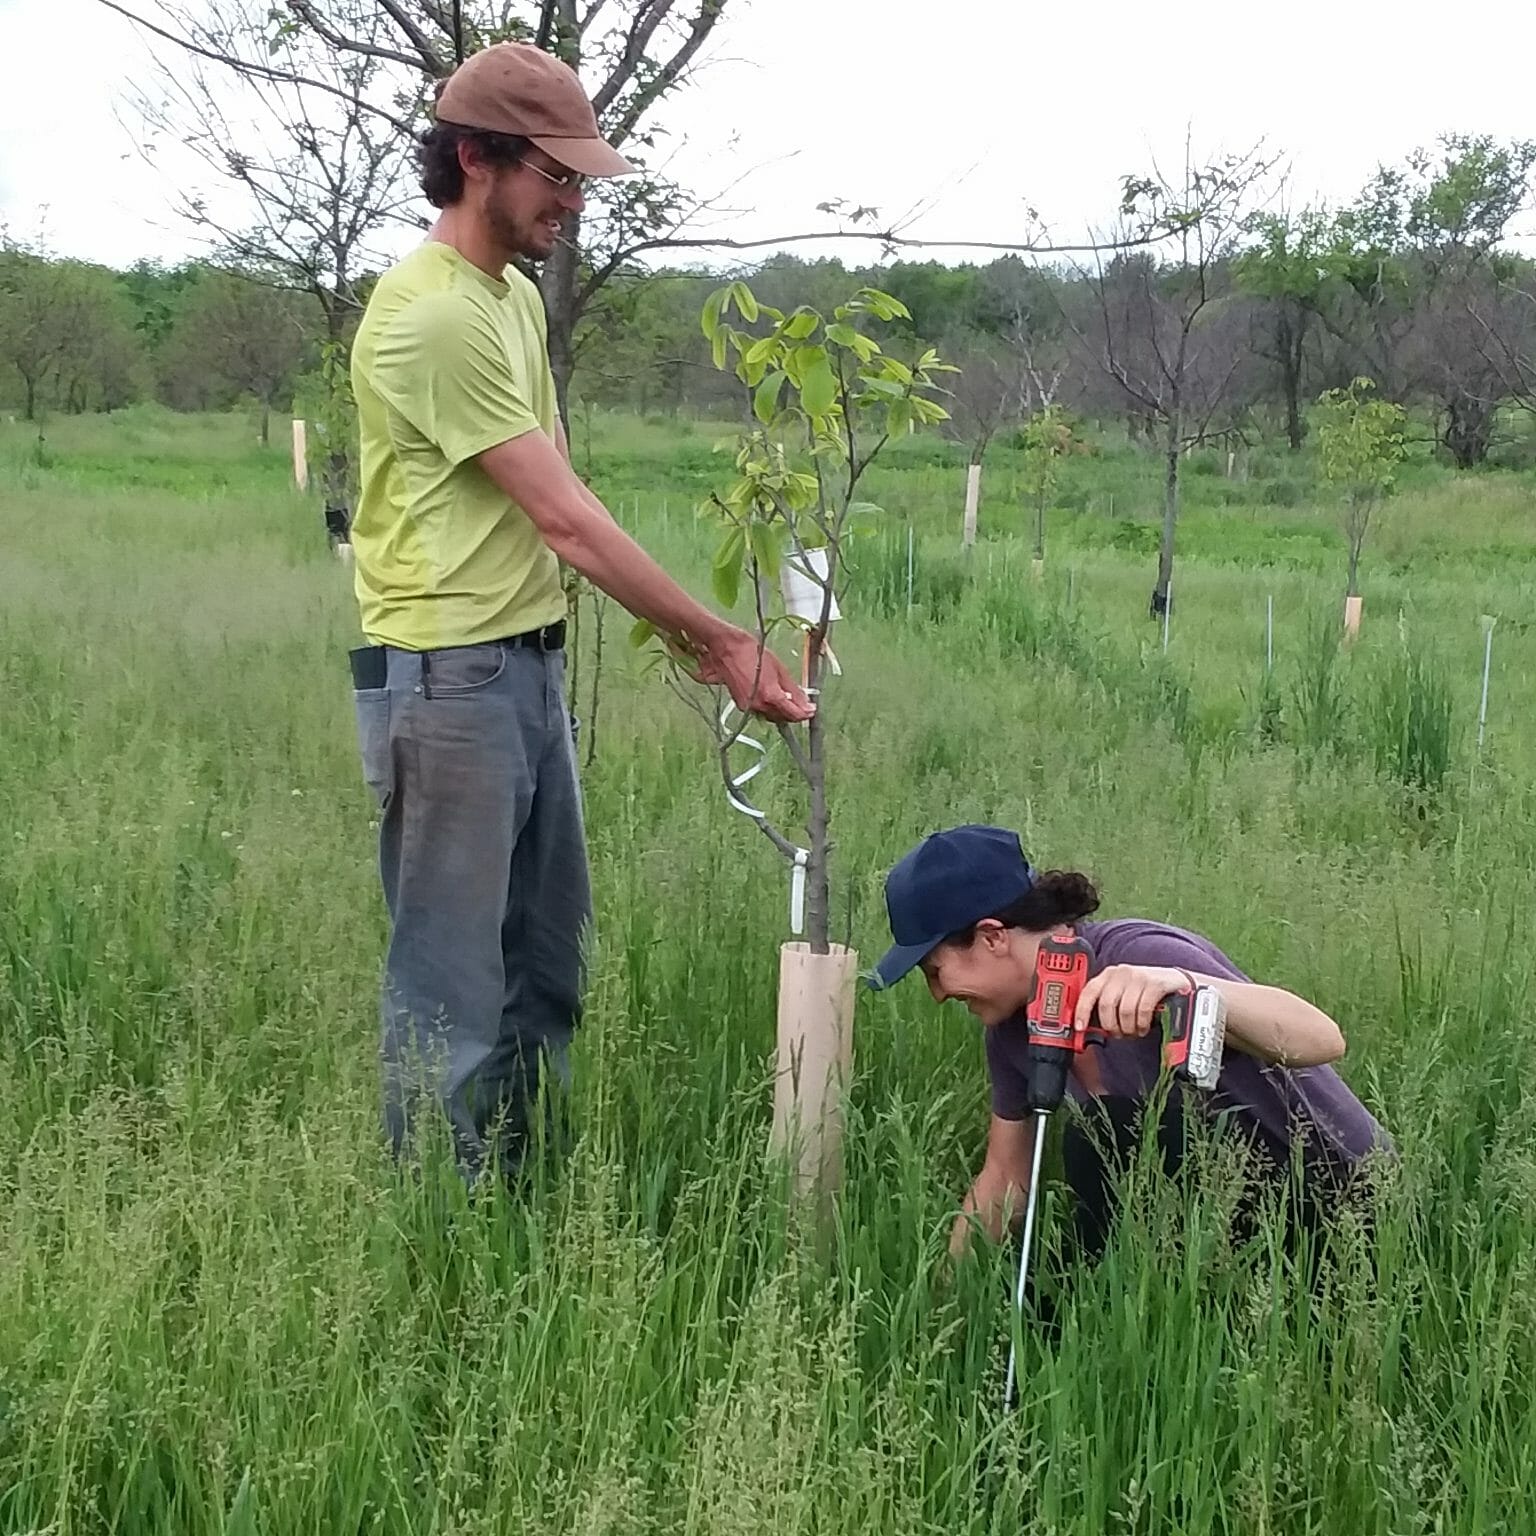
Dane Mainella and Anne Carey, interns at Red Fern Farm, burying tea bags at the base of a pawpaw tree on May 27, 2020.
Background
Several recent studies in Europe[1–3] and the U.S. Midwest[4–6] have assessed the decomposition rates of various plant litters, teas and other household items buried in soils across a range of agricultural production systems. In general, soils from more complex cropping systems involving “soil health promoting practices” like diverse rotations and cover crops increased decomposition of the materials. These accelerated decomposition rates were often associated with higher levels of common soil health indicators like organic matter and microbial biomass as well as improved crop yields.
Building on these studies, Dr. Marshall McDaniel and Teresa Middleton from the ISU Dept. of Agronomy proposed a soil decomposition index (SDI) for assessing soil health. The SDI measures the relative ability of a soil to decompose low-quality residue (C:N>30) to its ability to decompose high-quality residue (C:N<20).[6] Low-quality residue can be thought of as corn stubble or wheat straw – plant litter that is relatively high in C, which can limit availability of soil N to microbes that is necessary for decomposition. High-quality residue on the other hand can be thought of as red clover or alfalfa hay – plant litter that is readily decomposed because its relatively high N-content does not result in N-limiting conditions for microbes. If a soil can decompose low-quality residue at a similar rate it does high-quality residue, it may be safe to say the microbes in that soil are not limited by resources and are in fact operating at their highest potential. Thus, the SDI can be considered an indicator of potential soil microbial activity on a scale of 0.0 (low) to 1.0 (high).
In this study, Kathy Dice investigated soil health from a range of annual and perennial plant production sites on her agroforestry farm in southeast Iowa by measuring the decomposition of green and black tea buried at those sites. Green tea represented high-quality litter (C:N=12) and black tea represented low-quality litter (C:N=38). Using commercially available tea bags to measure soil microbial activity (decomposition) and calculate an SDI presents a low-cost method for assessing soil health compared to expensive lab test. Studies in Europe originally used rooibos tea (made from tea bark) as the low-quality litter but due to the lack of rooibos tea in nylon bags in the United States, black tea was substituted under the advice of Dr. McDaniel.
Methods
Design
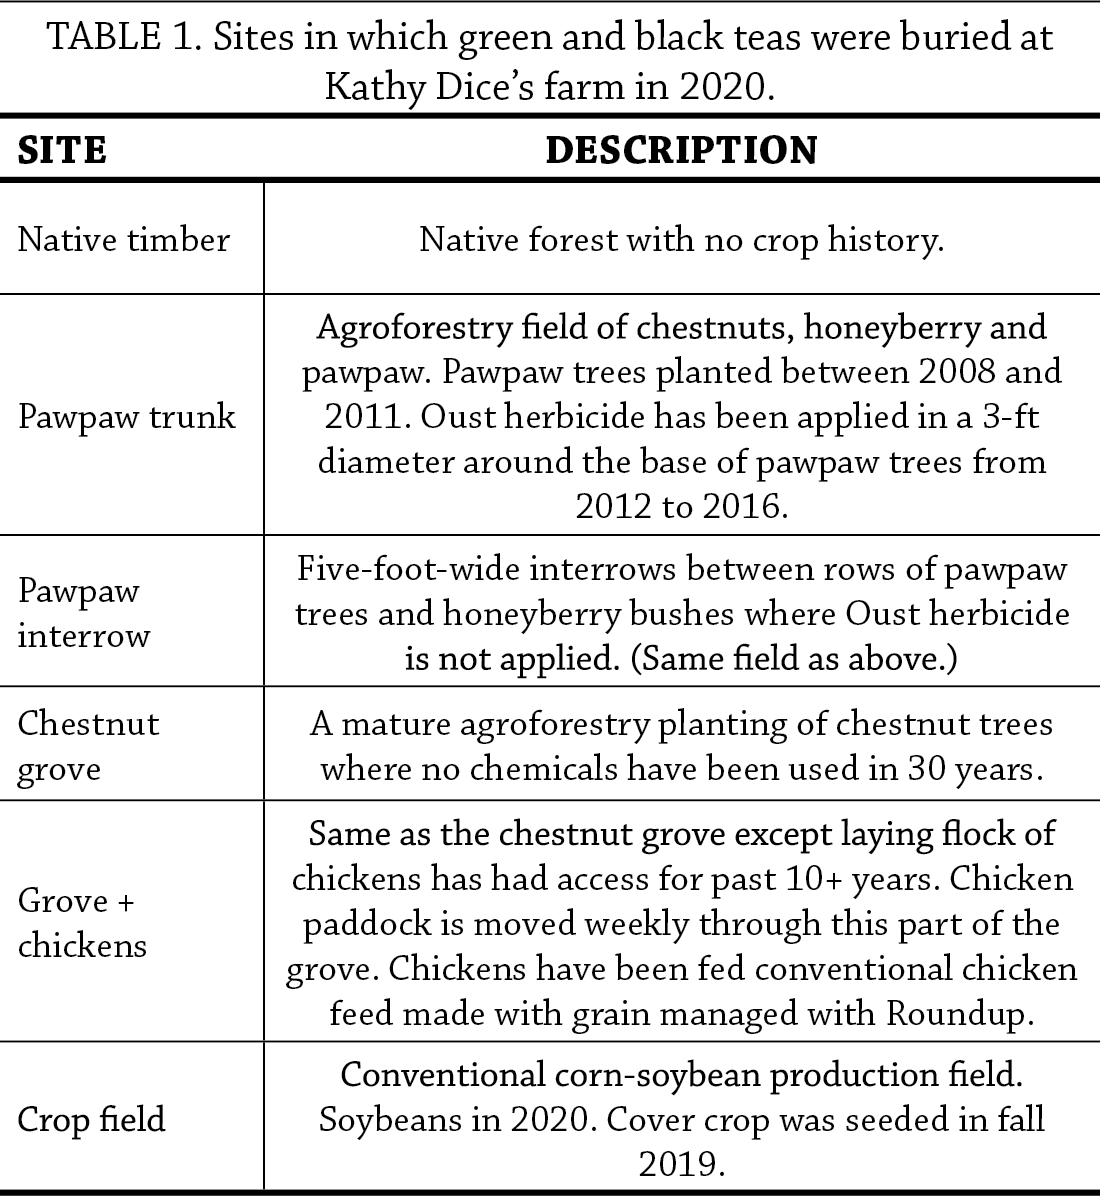
Dice chose to evaluate soil health in six sites: four different agroforestry sites, a stand of native timber and a neighbor’s conventional corn-soybean field (Table 1). The native timber and corn-soybean field represented opposite ends of a spectrum: long-term diverse perennial plant growth and annual monocrop production, respectively.
Measurements
Dice used Pure Leaf brand green and black teas which come packaged in tetrahedron-shaped nylon mesh bags (mesh size 0.25 mm). In each of the six sites, Dice buried four pairs of green and black tea bags to a depth of 4 in. on May 27, 2020. Dice retrieved all tea bags from the sites on June 7, cleaned them of debris and dried them in a food dehydrator until they reached a constant mass before recording the dry mass of each bag. Dice used a digital scale capable of 0.01-gram accuracy to record dry mass. Mass loss of each bag was calculated by subtracting the post-burial dry mass from the initial mass (recorded prior to burial). Tea bags were retrieved 11 days after being buried to avoid infiltration by plant roots; this had been a problem the previous year and in some of Dr. McDaniel’s previous experiments.
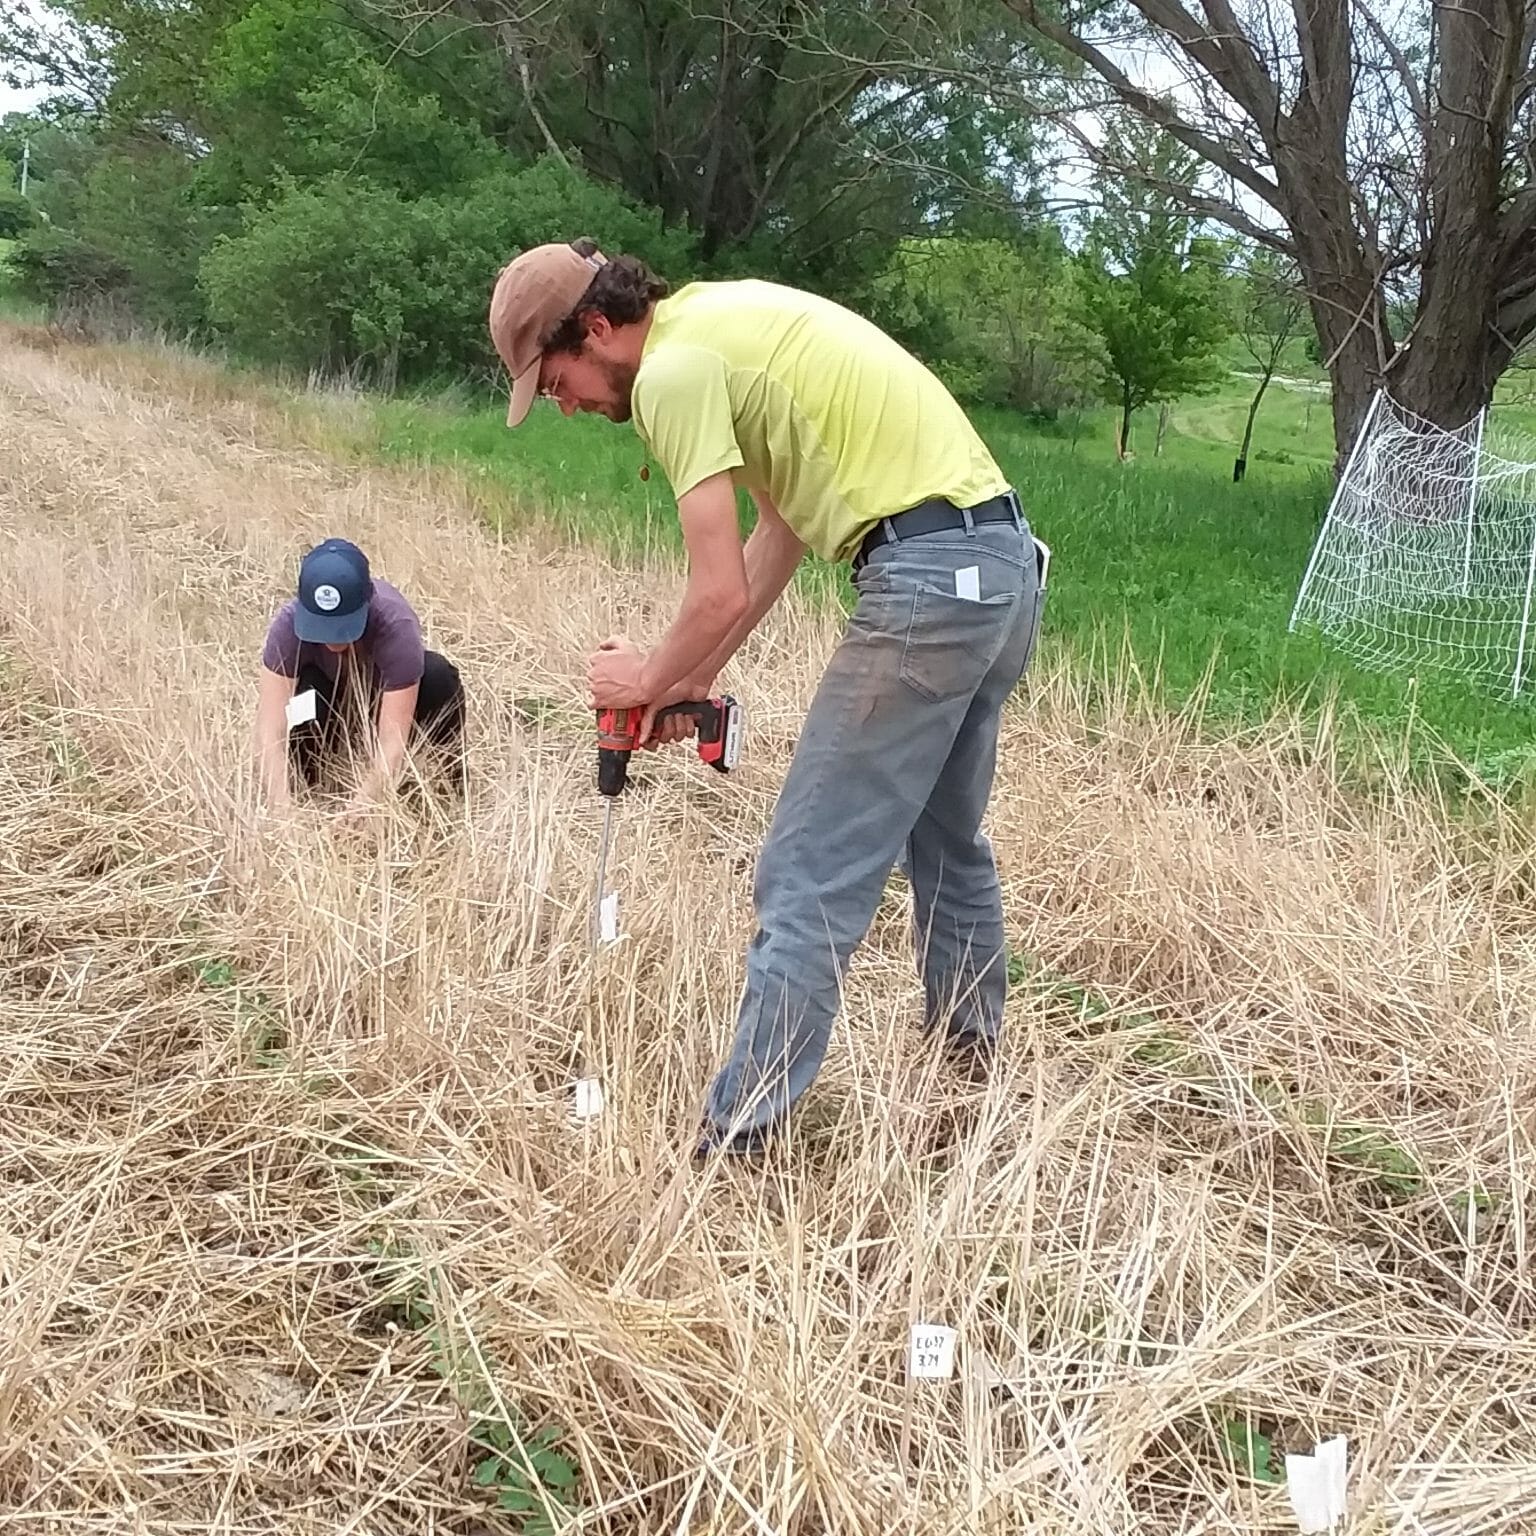
Dane Mainella and Anne Carey, interns at Red Fern Farm, burying tea bags in a conventional soybean field on May 27, 2020 (note the cover crop residue).
The soil decomposition index (SDI) considers a soil’s ability to decompose high-quality plant litter (green tea) relative to its ability to decompose low-quality plant litter (black tea). The SDI was calculated as the ratio of black tea mass loss to green tea mass loss:

Data analysis
To evaluate any soil health differences among the sites, we calculated Tukey’s least significant difference (LSD) at the 90% confidence for each metric: mass loss of green tea; mass loss of black tea; SDI. For each metric, if the average difference between any two sites was greater than the LSD, we would expect such a difference to occur 9 times out of 10 under the same conditions – we refer to this as a statistically significant effect of site on that metric. On the other hand, if the average difference between any two sites was less than the LSD, we considered the results statistically similar. We could make these statistical calculations because Dice buried multiple replicates (n=4) of the green and black tea bag pairs in each site.
Results and Discussion
Mass loss of teas
Mass loss of green and black teas varied among the sites (Table 2). In general, the crop field resulted in the most mass loss of both teas. The native timber saw the least amount of mass loss of the green tea; the chestnut grove saw the least amount of mass loss of the black tea. The use of Oust herbicide at the base of pawpaws did not affect mass loss of tea compared to the interrows where it was not used.
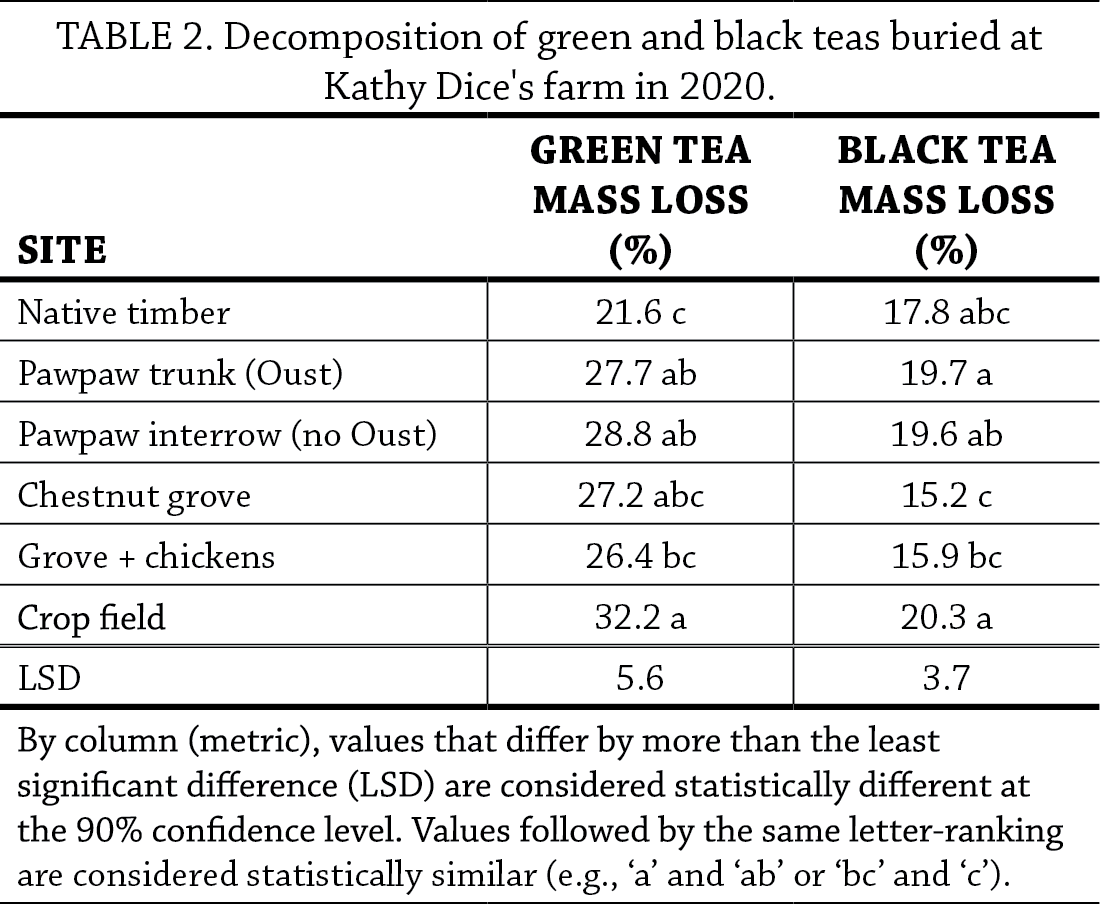
Mass loss of tea is due to decomposition by soil microbes. As such, we assumed mass loss of tea to be directly related to the amount of microbial activity in the soil – the more mass loss, the more soil microbial activity. Differences in mass loss of teas among the sites could be attributed to management but also due to soil type (i.e., texture or landscape position)[7] or temperature and moisture conditions. It is probably safe to say that the exposed soil in the crop field (soybeans) was warmer than the soil under the tree canopies in the native timber and agroforestry sites in late May/early June; and also safe to assume that moisture was not limiting given the sites experienced the same rainfall (approximately 1 in. observed during the 11-day burial period at the nearby Columbus Junction weather station[8]). Because soil microbial activity is governed by soil temperature, this may one reason the crop field (though a monocrop annual production system) saw the most mass loss of both teas among all sites.
Some research warns that comparisons of litter decomposition between ecosystems may not be prudent, due to differing temperature and moisture availability.[1] Enter the SDI, which is designed to account for these temperature and moisture differences among sites.
Soil decomposition index
The SDI is an indicator of potential soil microbial activity and is evaluated on a scale from 0.0 (low) to 1.0 (high). In a sense, when we calculate this index we are asking: “How well are the microbes in a particular soil operating relative to their maximum potential?” The SDI was calculated from the decomposition rates of green (high-quality litter) and black (low-quality litter) tea buried in the soil (Table 2). Decomposition rates of green and black teas in a particular soil are subject to the same temperature and moisture conditions which govern microbial activity. Though soil temperature and moisture can differ among sites, the SDI presents the opportunity to make climate-independent comparisons of potential microbial activity among sites.
Figure 1 displays the average SDI for each site in this study. The native timber saw the highest SDI among sites; the SDI for both pawpaw sites were statistically similar to the native timber. SDI for all four perennial agroforestry sites were statistically similar to the annual crop field.
Conclusions and Next Steps
This was the third year that Dice used tea bags to assess soil health on her farm and the second year of reporting results.[9] In particular, she wanted to know if the Oust herbicide used with the pawpaws or the chickens fed conventional grain have affected the soil in those agroforestry fields. Dice was pleased to see that neither is having an adverse effect based on the decomposition rates of green and black teas buried in the soil for 11 days.
This year we included in the study the calculation of the SDI (soil decomposition index) that is being pioneered by Dr. Marshall McDaniel at ISU. The SDI, when calculated from the decomposition rates of commercially available green and black teas, may be appealing to farmers because it is designed to be an inexpensive, do-it-yourself way to assess soil health compared to many lab methods.
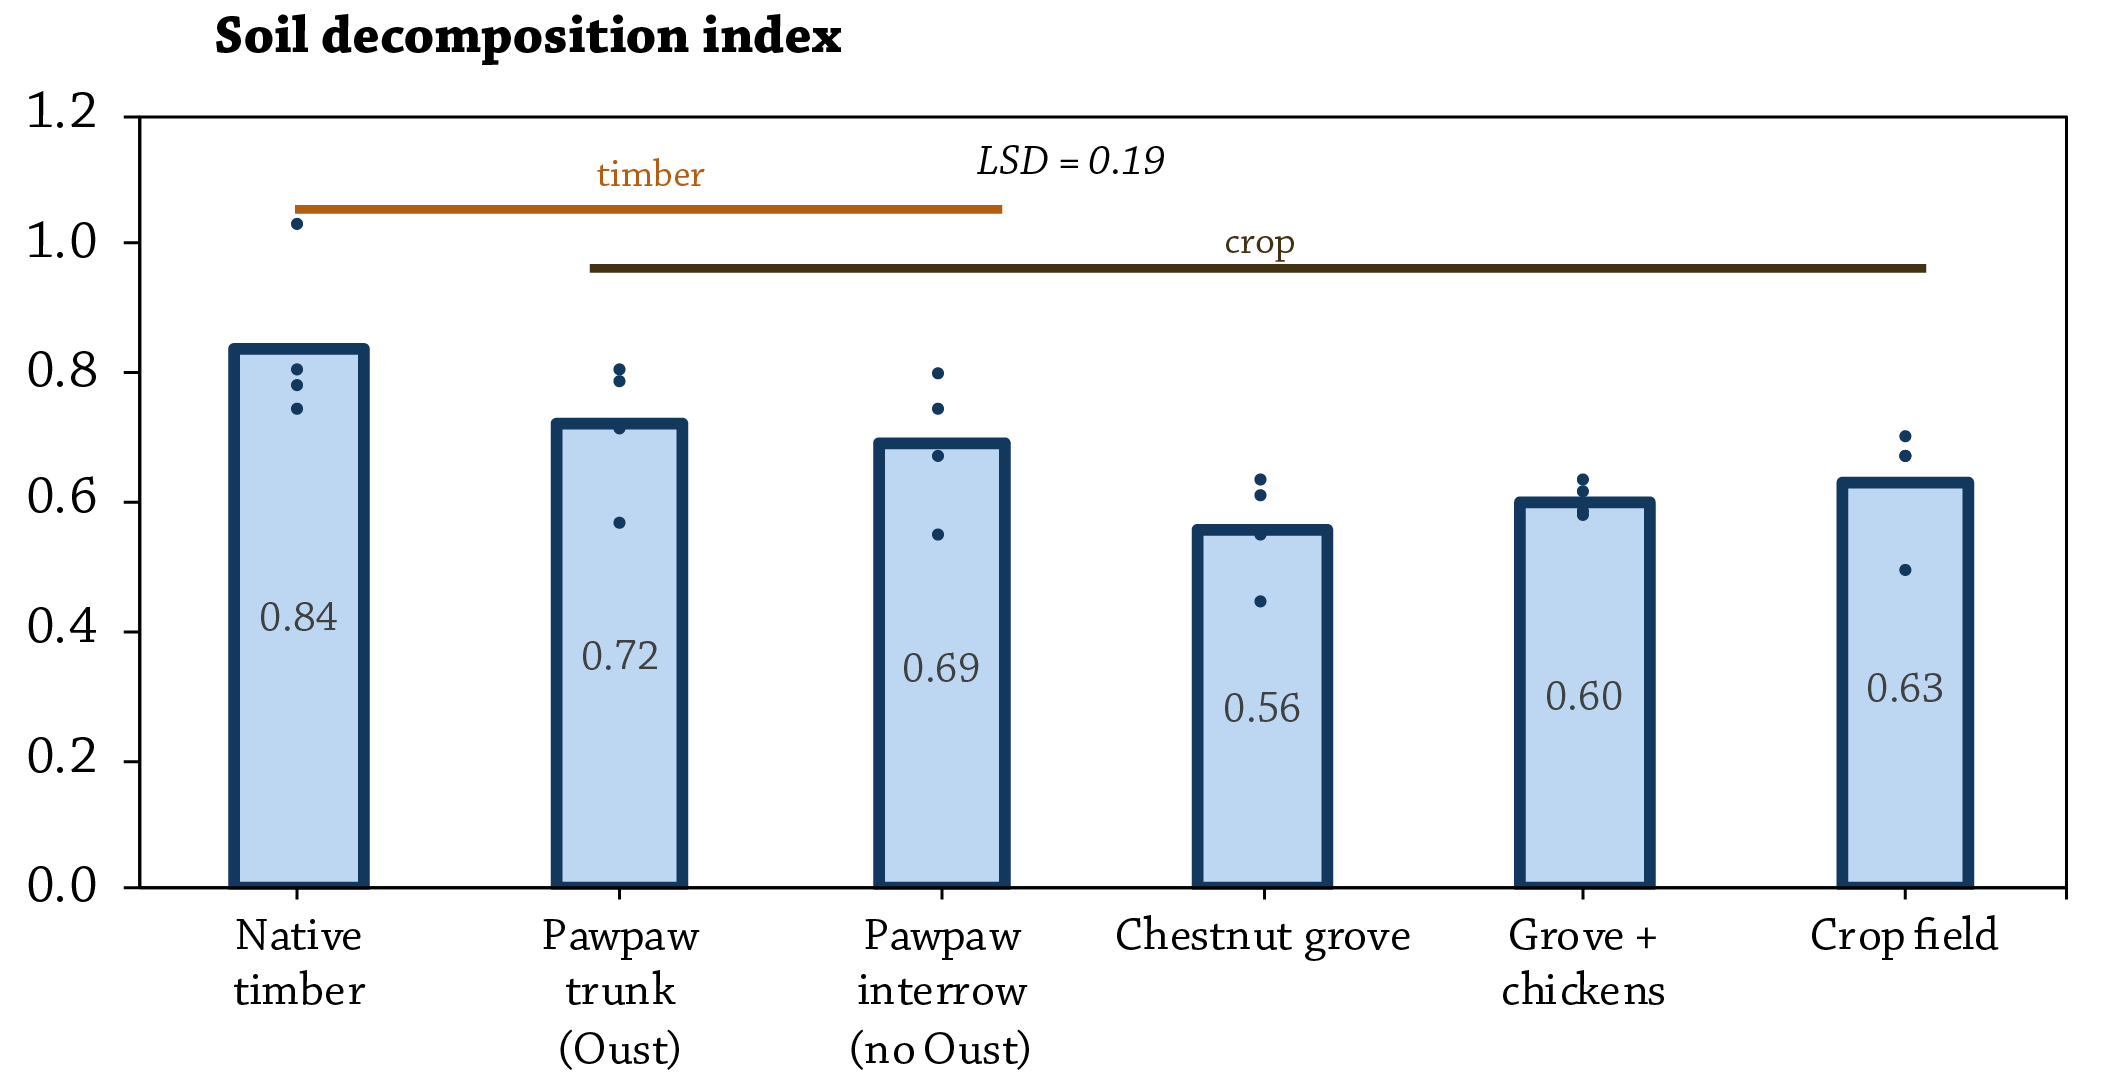
FIGURE 1. Soil decomposition index (SDI) was calculated as the ratio of black tea mass loss to green tea mass loss. Columns represent the average SDI in each site. Dots represent SDI of each pair of green and black tea bags buried in each site (n=4). Values in the columns are the average SDI for that site. Values that differ by less than the least significant difference (LSD) are considered statistically similar at the 90% confidence level. Horizontal line “timber” indicates no difference between an agroforestry site and the native timber. Horizontal line “crop” indicates no difference between an agroforestry site and the crop field.
References
- Keuskamp, J.A., B.J.J. Dingemans, T. Lehtinen, J.M. Sarneel and M.M. Hefting. 2013. Tea Bag Index: A novel approach to collect uniform decomposition data across ecosystems. Methods in Ecology and Evolution. 4:1070–1075. https://besjournals.onlinelibrary.wiley.com/doi/pdf/10.1111/2041-210X.12097 (accessed July 2021).
- Houben, D., M.P. Faucon and A.M. Mercadal. 2018. Response of organic matter decomposition to no-tillage adoption evaluated by the tea bag technique. Soil Systems. 2:1–9. https://www.mdpi.com/2571-8789/2/3/42/pdf (accessed July 2021).
- Barel, J.M., T.W. Kuyper, J. Paul, W. de Boer, J.H.C. Cornelissen and G.B. De Deyn. 2019. Winter cover crop legacy effects on litter decomposition act through litter quality and microbial community changes. Journal of Applied Ecology. 56:132–143. https://besjournals.onlinelibrary.wiley.com/doi/pdf/10.1111/1365-2664.13261 (accessed July 2021).
- McDaniel, M.D., A.S. Grandy, L.K. Tiemann and M.N. Weintraub. 2014. Crop rotation complexity regulates the decomposition of high and low quality residues. Soil Biology and Biochemistry. 78:243–254. https://www.sciencedirect.com/science/article/abs/pii/S0038071714002740 (accessed July 2021).
- Sievers, T. and R.L. Cook. 2018. Aboveground and Root Decomposition of Cereal Rye and Hairy Vetch Cover Crops. Soil Science Society of America Journal. 82:147–155. https://www.mssoy.org/uploads/files/sievers-cook-cc-decomp-sssaj-jan-2018.pdf (accessed July 2021).
- Middleton, T. 2019. Exploring decomposition of household items as an inexpensive , yet scientifically-robust , tool for assessing soil health by. Thesis. Iowa State University – Dept. of Agronomy. https://lib.dr.iastate.edu/cgi/viewcontent.cgi?article=8753&context=etd (accessed July 2021).
- De, M., J.A. Riopel, L.J. Cihacek, M. Lawrinenko, R. Baldwin-Kordick, S.J. Hall and M.D. McDaniel. 2020. Soil health recovery after grassland reestablishment on cropland: The effects of time and topographic position. Soil Science Society of America Journal. 84:568–586. https://acsess.onlinelibrary.wiley.com/doi/pdf/10.1002/saj2.20007 (accessed July 2021).
- Iowa Environmental Mesonet. 2021. Climodat Reports. Iowa State University. http://mesonet.agron.iastate.edu/climodat/ (accessed July 2021).
- Kolbe, L. and K. Dice. 2019. Tea Bag Decomposition in Agroforestry and Crop Fields. Practical Farmers of Iowa Cooperators20.H.Decomp tea soil health indicator agroforestry FINAL’ Program. https://practicalfarmers.org/wp-content/uploads/2020/06/H.19.Tea-Bag-Decomposition-in-Agroforestry-and-Crop-Fields.pdf (accessed July 2021).