

Do Cover Crops Increase the Number of Days Suitable for Field Work?
In a Nutshell:
- Fifteen farmers identified one field in their farm with a history of cover cropping and recorded throughout the growing season which days were suitable for fieldwork.
- These farmers believe they are getting into their fields earlier in the spring and gaining extra workable days in the fall—benefits they attribute to their use of cover crops.
- Most farms have routinely used cover crops in the past years, with the majority of them planting cereal rye in the fall, though some incorporated other species such as oats, clover, or radish for example.
Key Findings:
- Nearly all sites experienced a warm start and wetter-than-average growing season.
- On average, farmers reported more days suitable for fieldwork compared to their district average in 53% of the weeks in 2024.
- Farmers most frequently exceeded their district averages in June (58.3% of the weeks), September (76%), and October (60%).
Background
USDA defines a ‘suitable’ day as one where weather and field conditions allowed producers to work in fields a major portion of that day [1]. The trend over the past 60 years in Iowa shows that the window for completing spring fieldwork is shrinking significantly, resulting in fewer days suitable for fieldwork [2]. This trend can be attributed to more variable precipitation patterns, especially in the spring and fall, which coincides with the bulk of field work activities for grain farmers.
For several years, PFI has been receiving stories and anecdotes from farmers that they are getting into their fields earlier than their neighbors in the spring and not leaving ruts in the field when harvesting in the fall. These farmers attribute this to their use of cover crops. “I’ve seen enough benefits in soil structure and health over past years to continue practices without financial aid. That structure is what allows me to enter the field 1-2 days ahead of conventional tilled fields after a major rain event,” said Joe Rowe at the onset of the research.
According to a 2025 Iowa State University Extension report, the number of suitable fieldwork days in the spring is declining across Iowa. Since 1964, the trend shows a loss of one full suitable day every six years [3]. In this context, practices that improve soil structure and resilience – like cover cropping – become more important. Additionally, recent studies have illustrated that cover crops can reduce crop insurance claims and losses from prevented planting caused by excess spring moisture [4], [5].
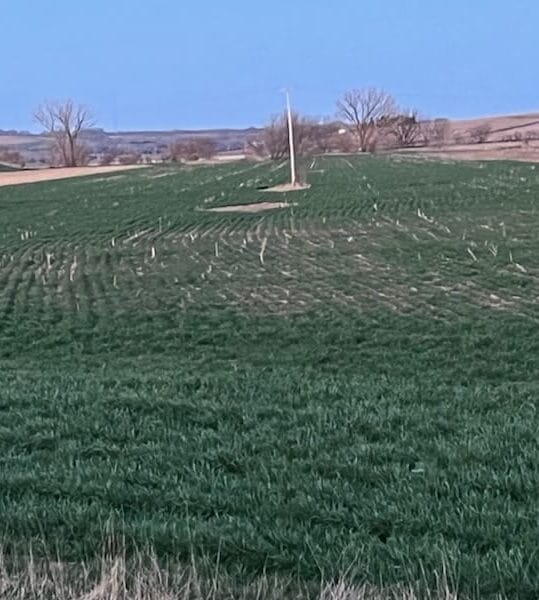
Cereal rye cover crop in Bob Sullivan’s field (Woodbine, IA). Photo taken April 15, 2024.
The purpose of this project is to determine if cover crop use increases the number of days suitable for field work compared with state agricultural district averages reported weekly in Crop Progress Reports by USDA. Because cover crops are used on relatively few acres, the weekly district averages published by USDA are largely representative of fields without cover crops and served as a ‘control’ by which we compared data collected by the cooperating farmers. We set up a simple framework for farmers to monitor and report the number of days each week they deemed suitable for fieldwork during the growing season in fields in which they use cover crops.
If cover crops prove to increase days suitable for fieldwork, this project could provide farmers with a compelling, practical way to advocate for their use. It also encourages farmers to stay more engaged in monitoring their fields. As Neil Peterson put it when asked what he hoped to gain from this research trial: “A greater understanding of how cover crops affect our farming systems. Also, just keeping a closer eye on my fields and how the crops are growing is always fun. To be more intimate with our land is good!”
Methods
Design
Cooperating farms were located across Iowa, Wisconsin, and Minnesota. Farmers were responsible for identifying at least one field in their farm with a history of cover cropping to monitor throughout the growing season.
Weekly Survey
During the growing season (April to November), farmers completed a weekly survey to evaluate the field conditions of the previous 7 days. The general questions on the survey were:
- During the past 7 days, what field activities were you trying to achieve? (e.g., tilling, planting, fertilizing, spraying, harvesting, etc.)
- If you wanted to, on which days could you have performed these activities without compromising field integrity?
This mirrors how USDA collects weekly data: People from each state district report their personal observations, which are then averaged for each district and published in weekly Crop Progress and Condition reports (personal communication, Susan Cowles, USDA-ARS).
Data analysis
Results of the monitoring by farmers were compared with the weekly state or district average number of days suitable for fieldwork published by USDA [6], [7], [8]. The weekly state averages published by USDA is largely representative of fields without cover crops and served as a ‘control’ by which we compared data collected by PFI cover crop farmers. The weekly data reported by farmers were compared with the district averages (Iowa and Wisconsin), or with the state averages (Minnesota). The deviation – which is the difference between the days farmers reported as suitable for field work and the average for the district/state – was determined week by week to visualize differences. These deviations are illustrated in graphs, highlighting trends over time and variations between individual farms and regional conditions.
Weather
To provide context for the results, weather data was downloaded from the National Aeronautics and Space Administration (NASA) Prediction of Worldwide Energy Resources (POWER) project for each farmer’s trial. More details on the weather data can be found in the Appendix P. Detailed Methods section at the end of this report.
Results and Discussion
The field history of cover crops varied from farmer to farmer. Five of them had a decade-long history of cover crop implementation, while four had been planting cover crops consistently for the past four to six years. Six had only recently adopted cover crops in the past one to three years. Most farms used cereal rye planted in the fall, though some incorporated other species such as oats, clover, or radish for example. Additional details on each cooperator’s field history are provided in Appendices A to O.
Of the 15 locations, 11 were spread across various districts in Iowa: Central (2), East Central (1), North Central (2), Northeast (2), Northwest (1), South Central (1), and West Central (2). Three farms were in Wisconsin – one in East Central and two in West Central – and one farm was in Minnesota. Because USDA reports for Minnesota only provide statewide averages, we compare the cooperator-reported days to state averages exclusively for the Minnesota site (Figure 1).

Figure 1. Trial locations across Iowa, Wisconsin, and Minnesota overlaid on USDA Agricultural Districts. Each blue dot represents a participating trial site, labeled by the farmer’s last name. District acronyms are shown within district boundaries and defined in the legend.
Weather
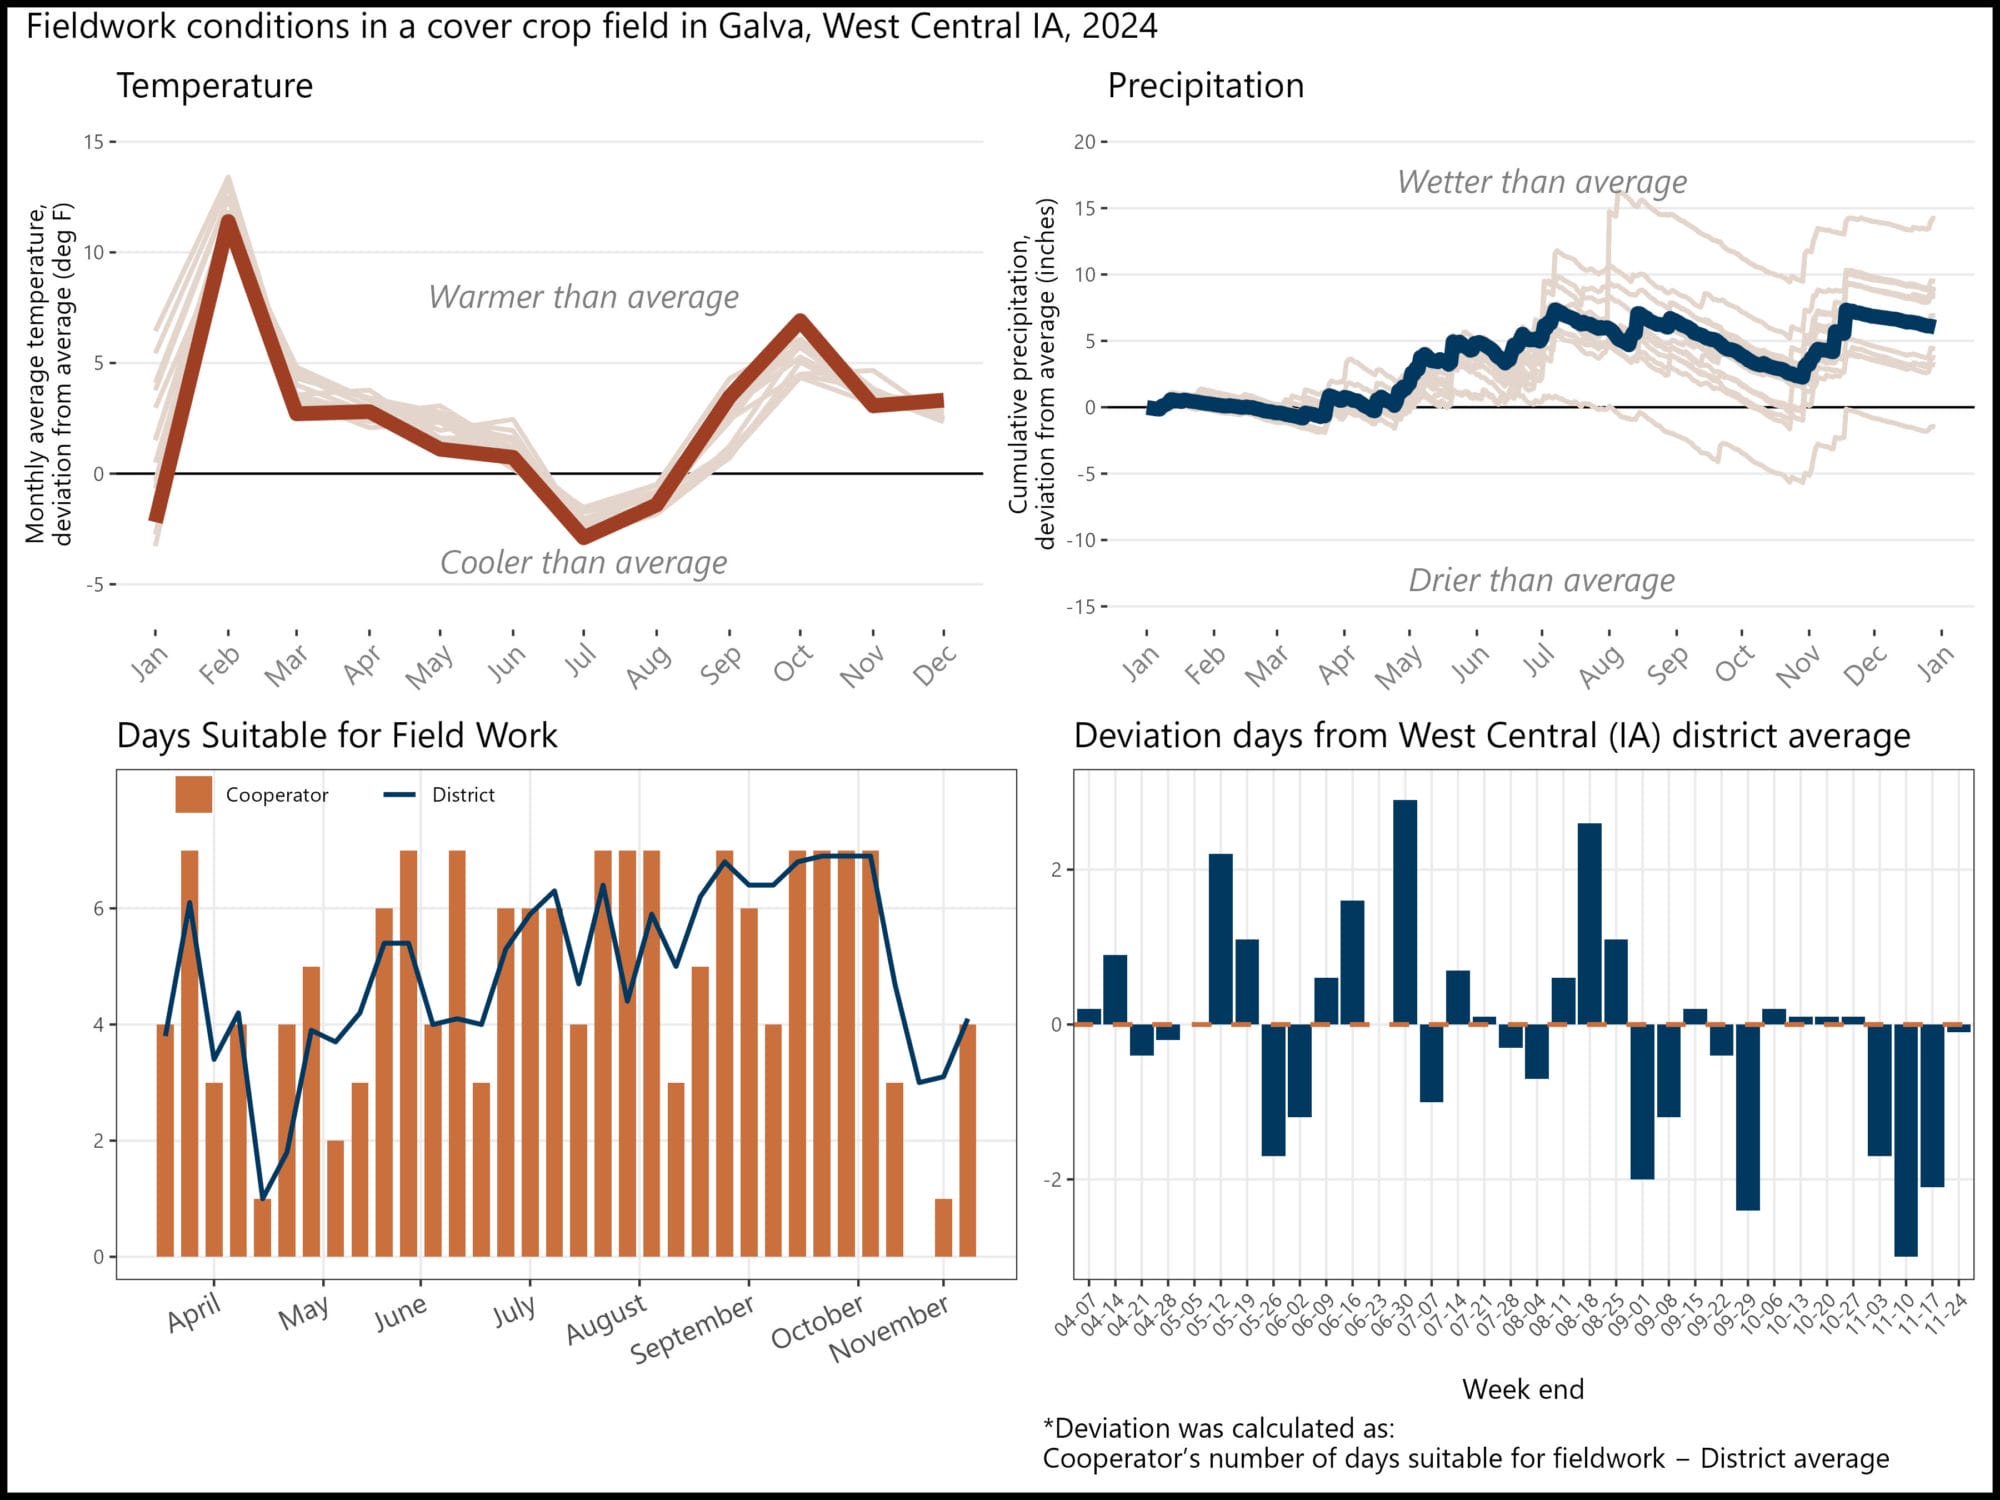
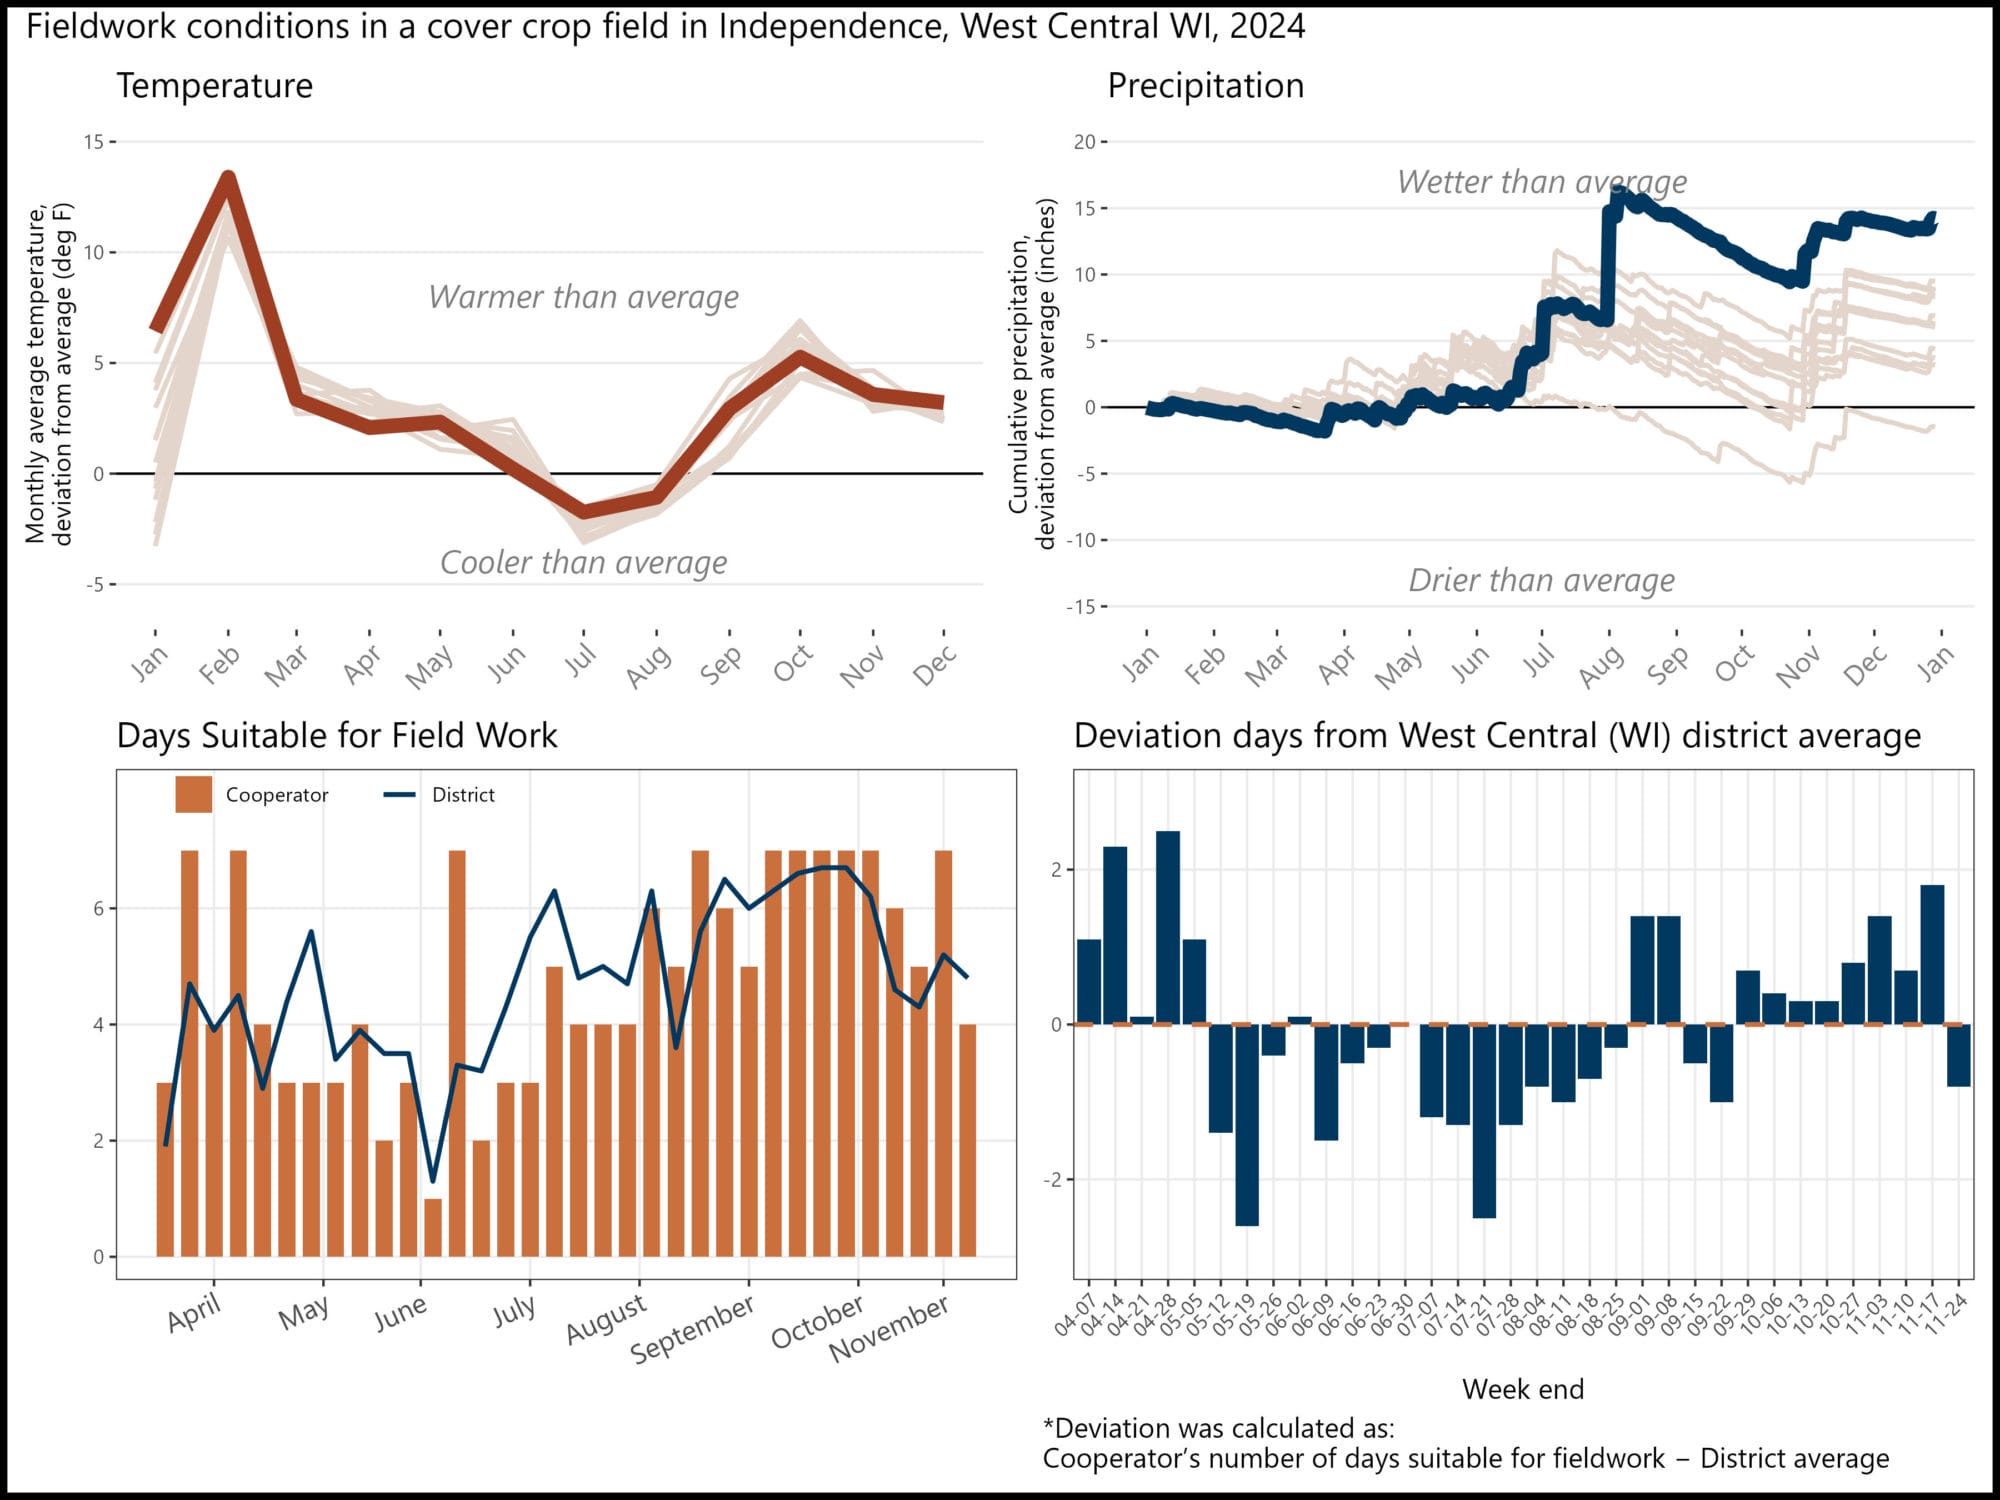
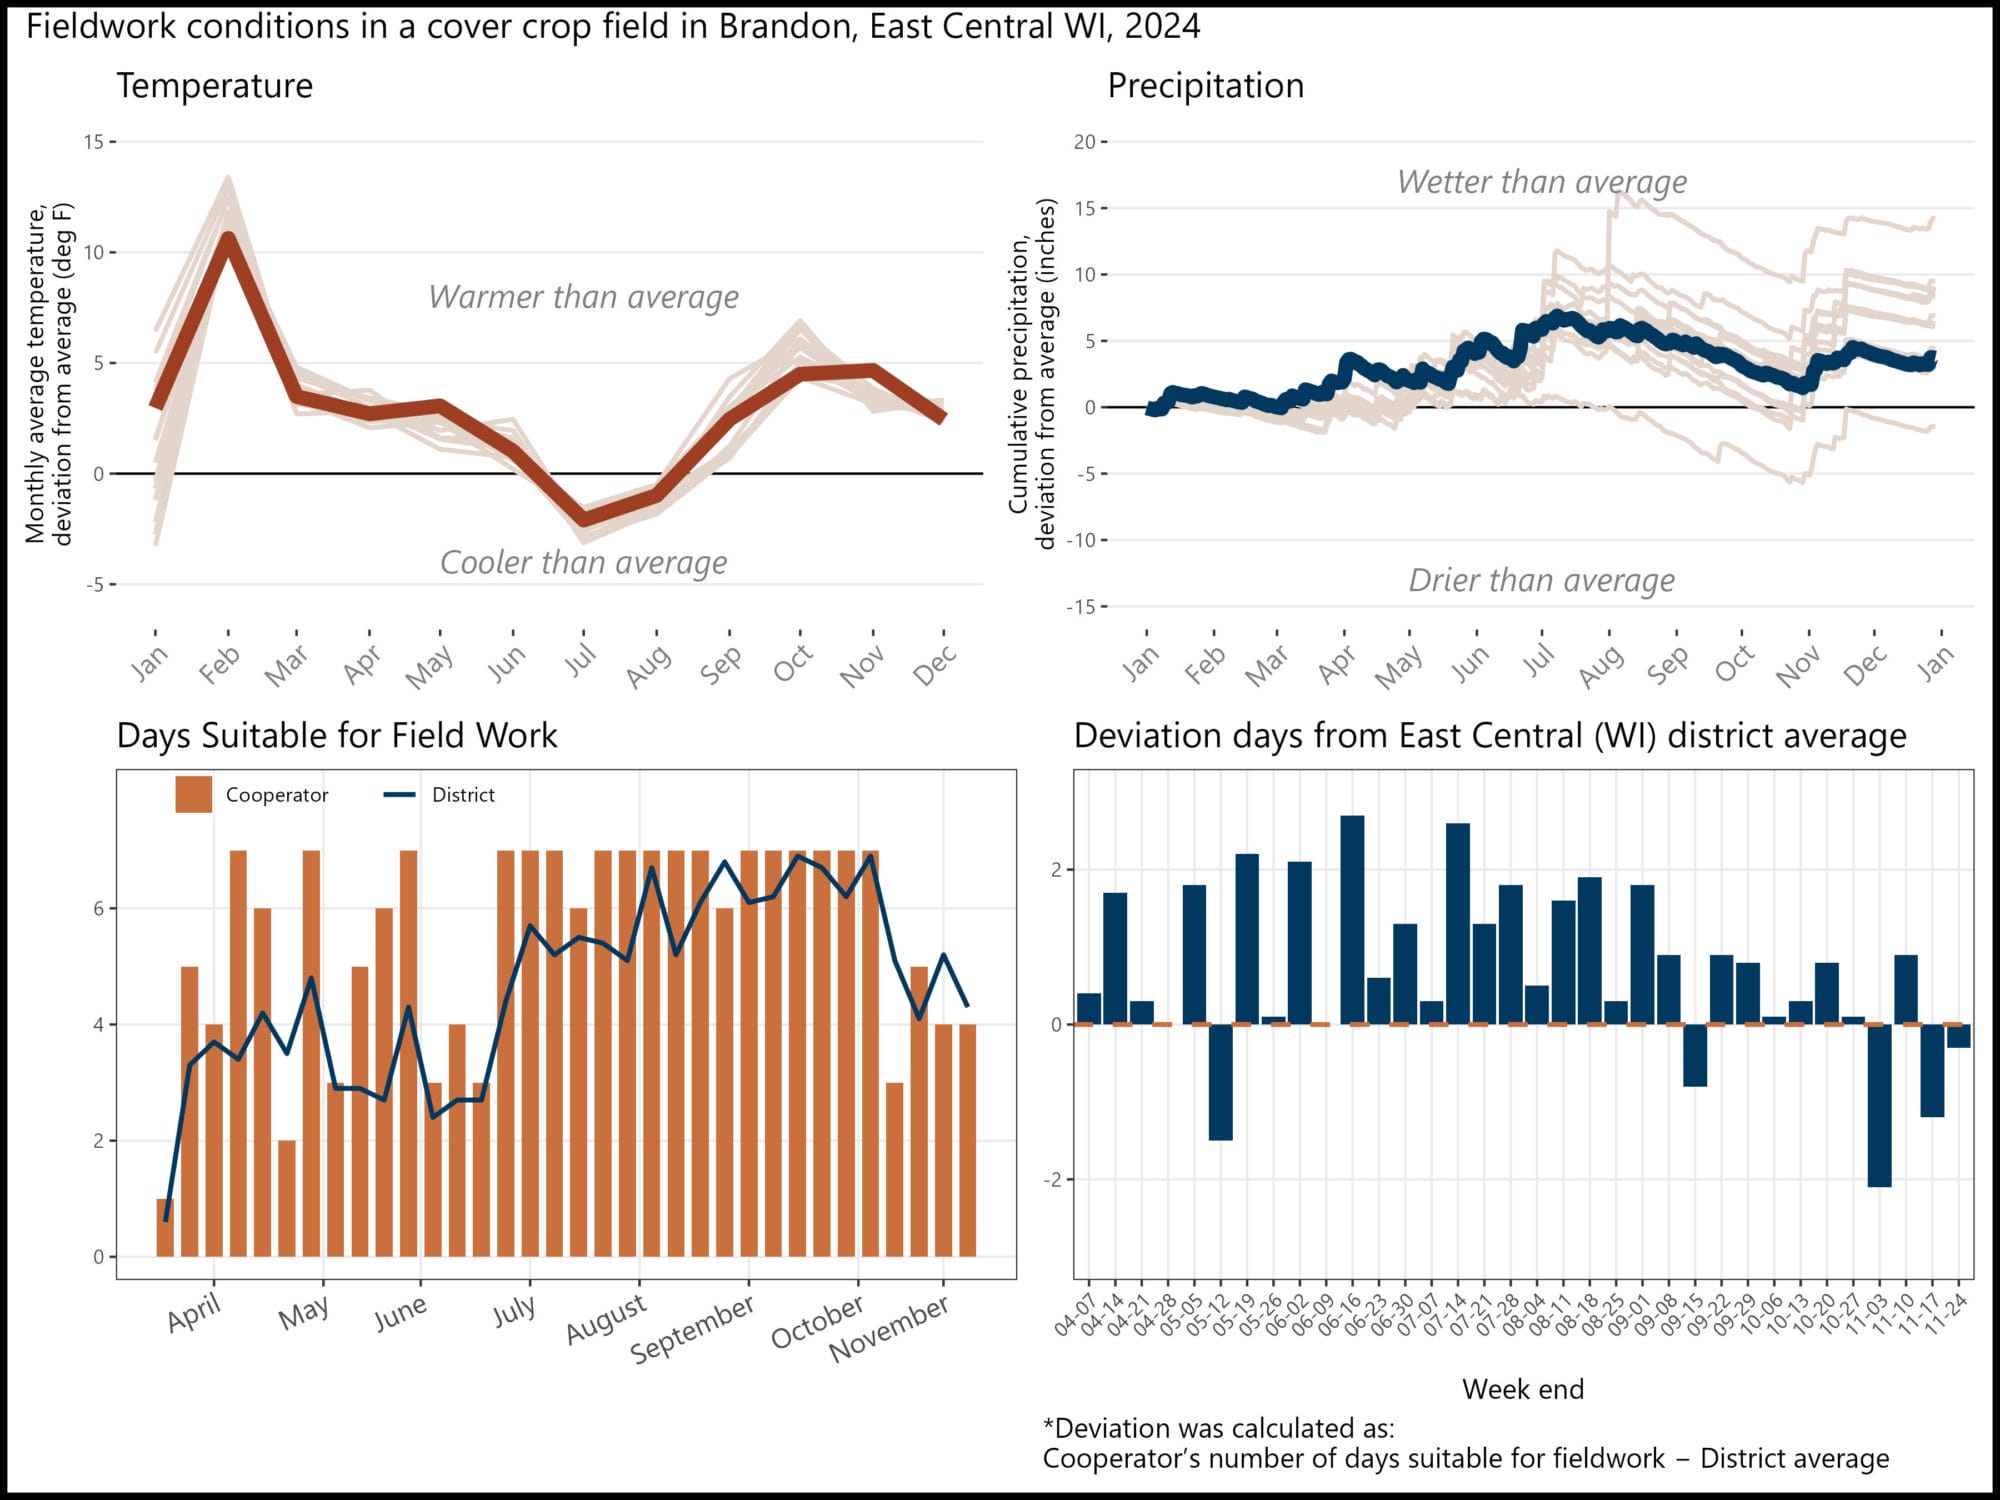
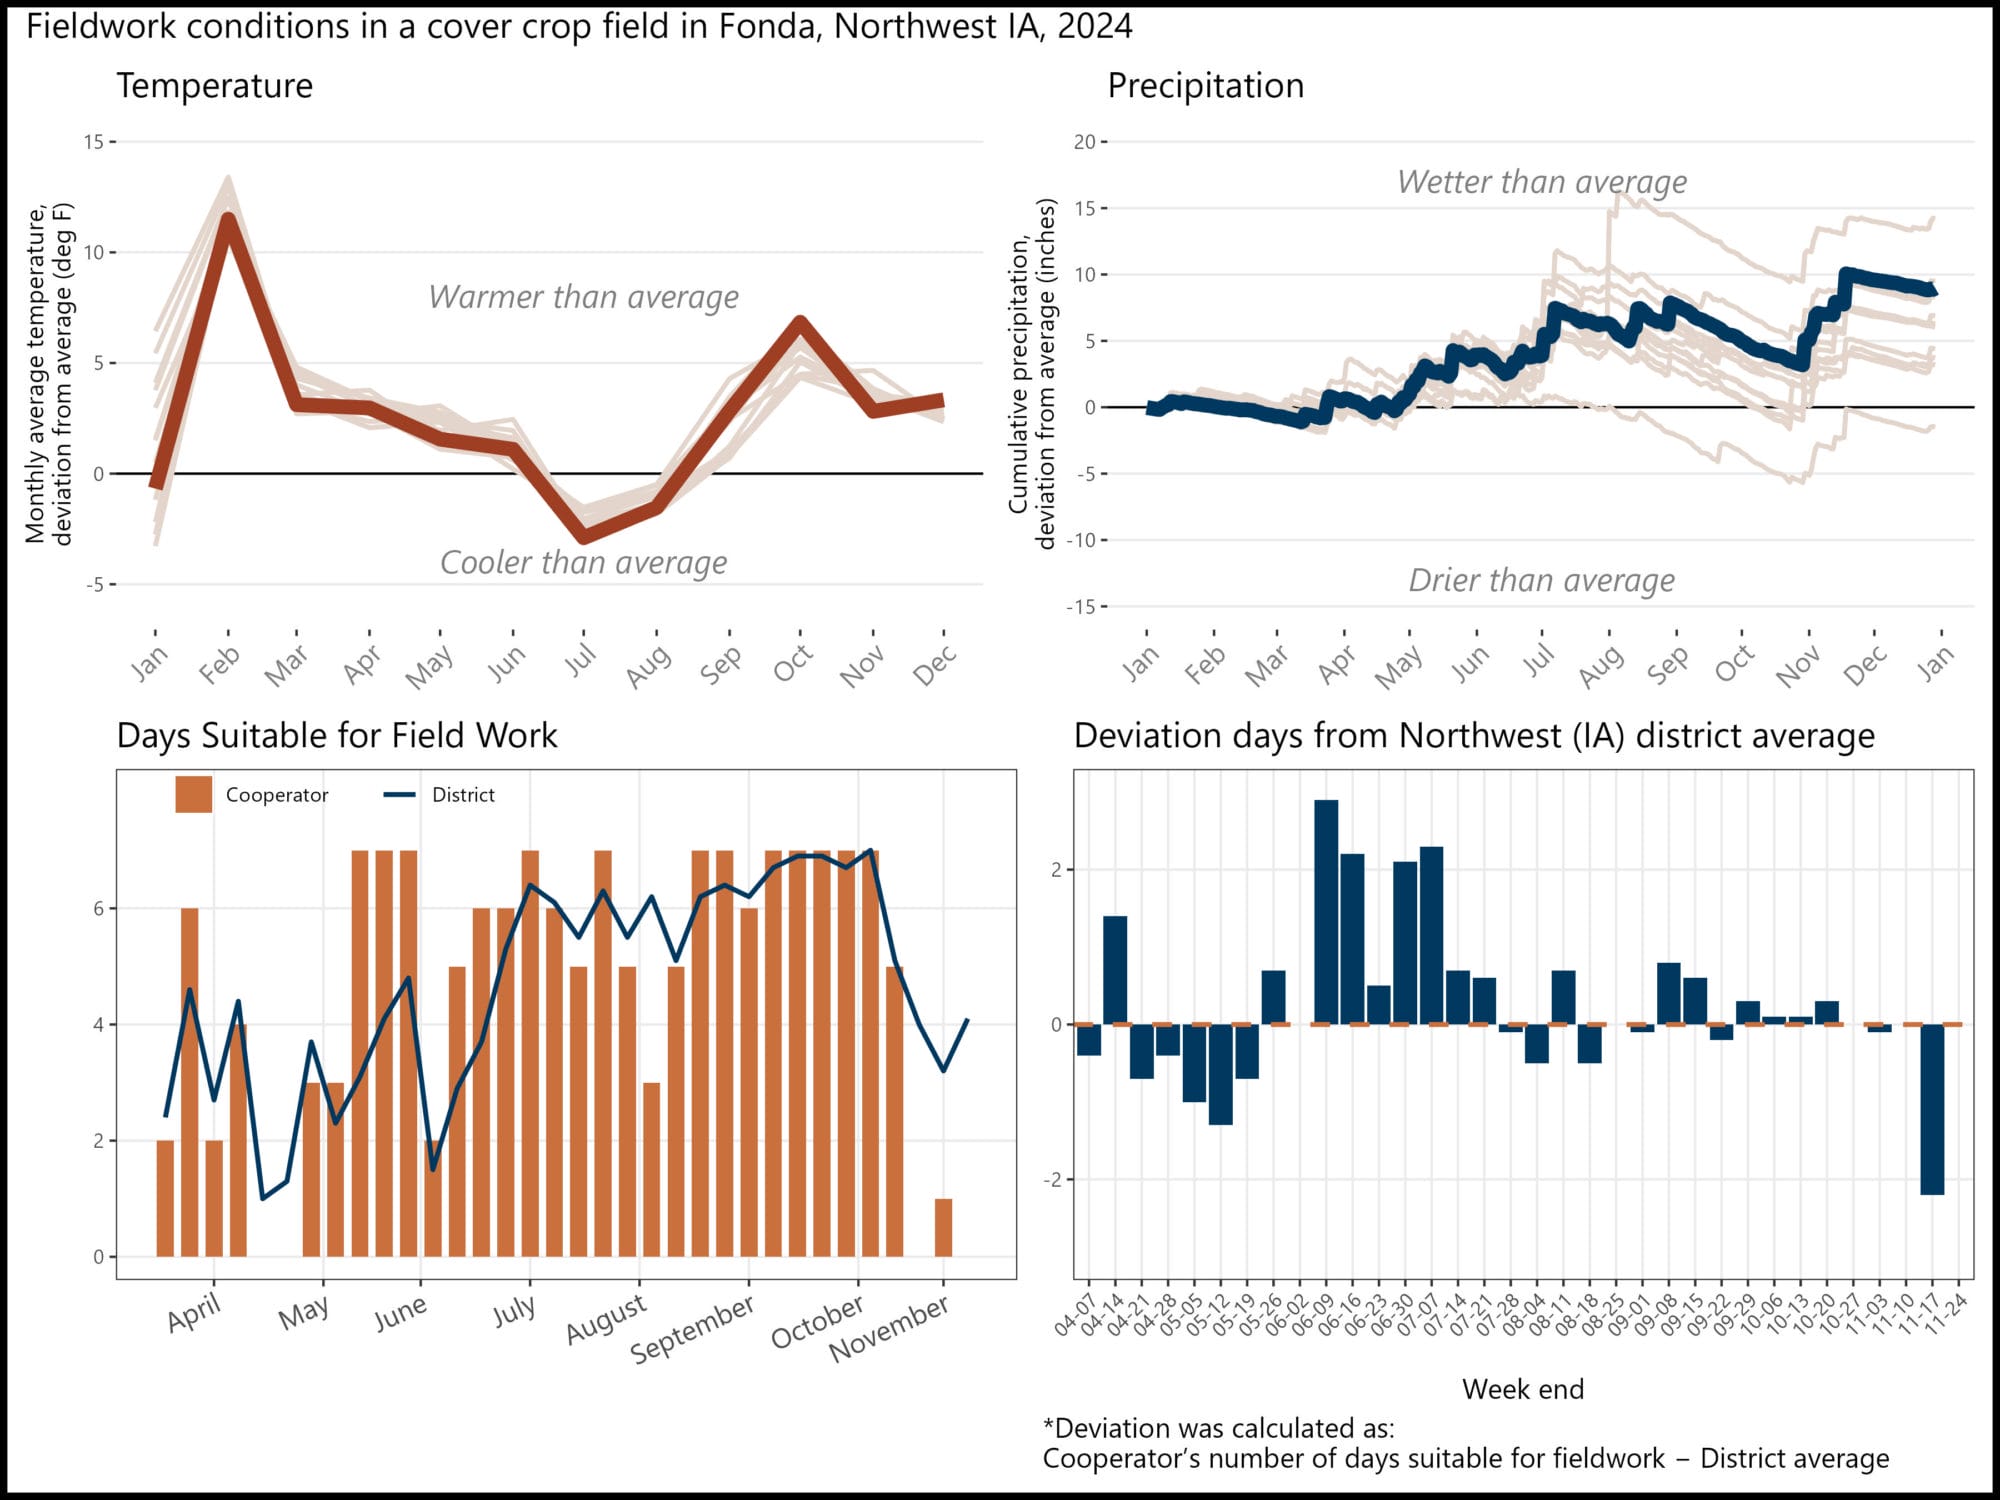
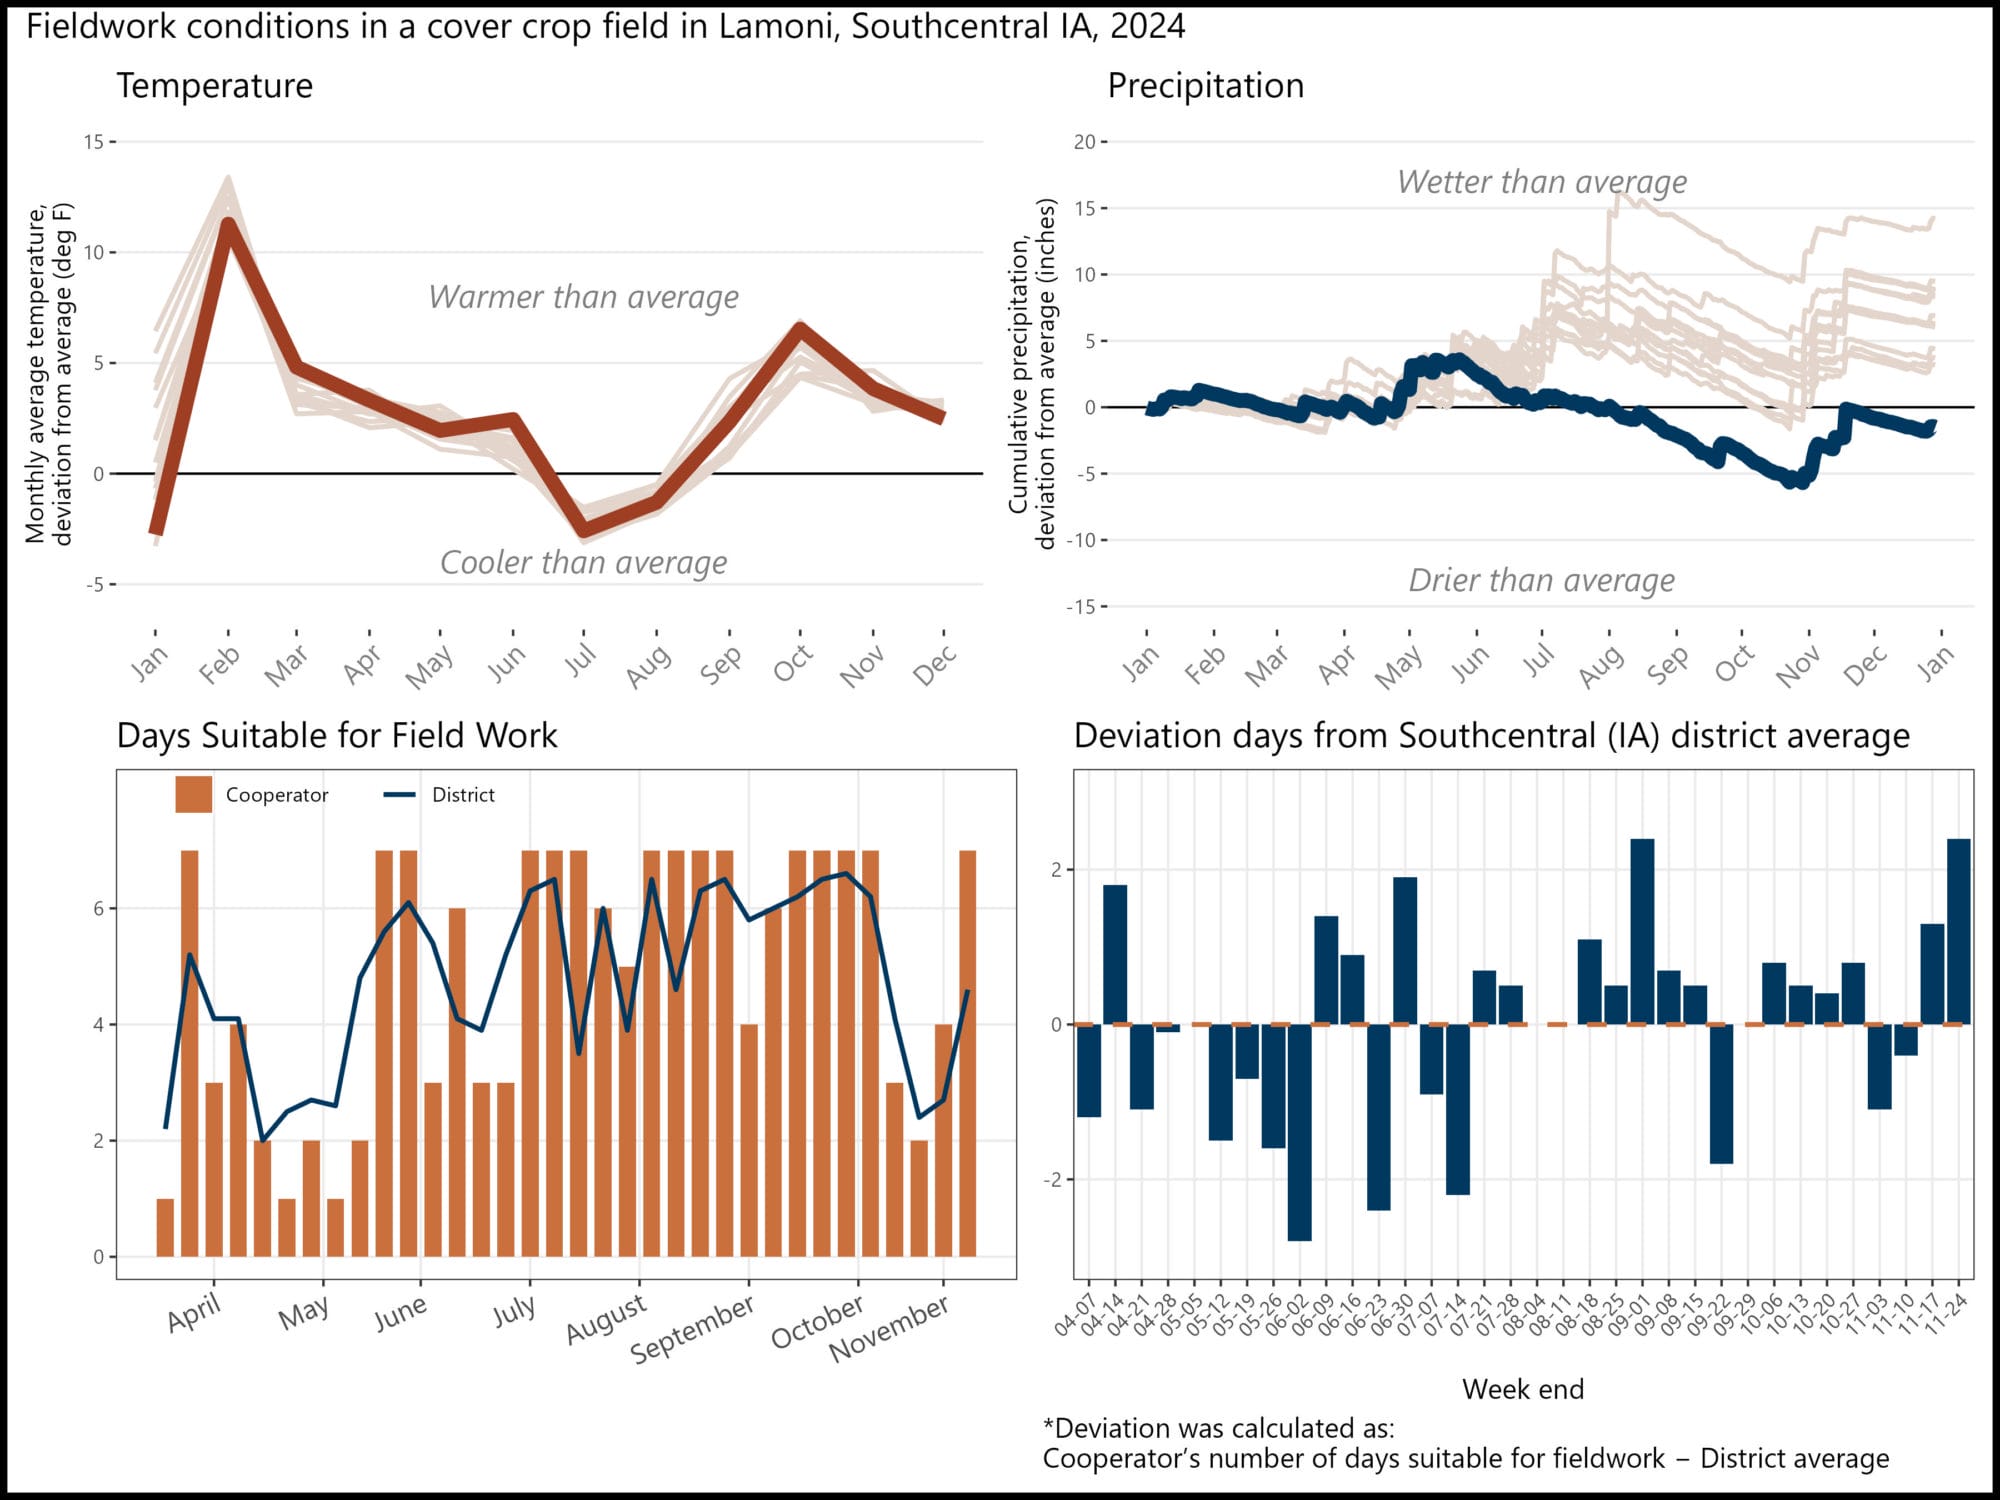
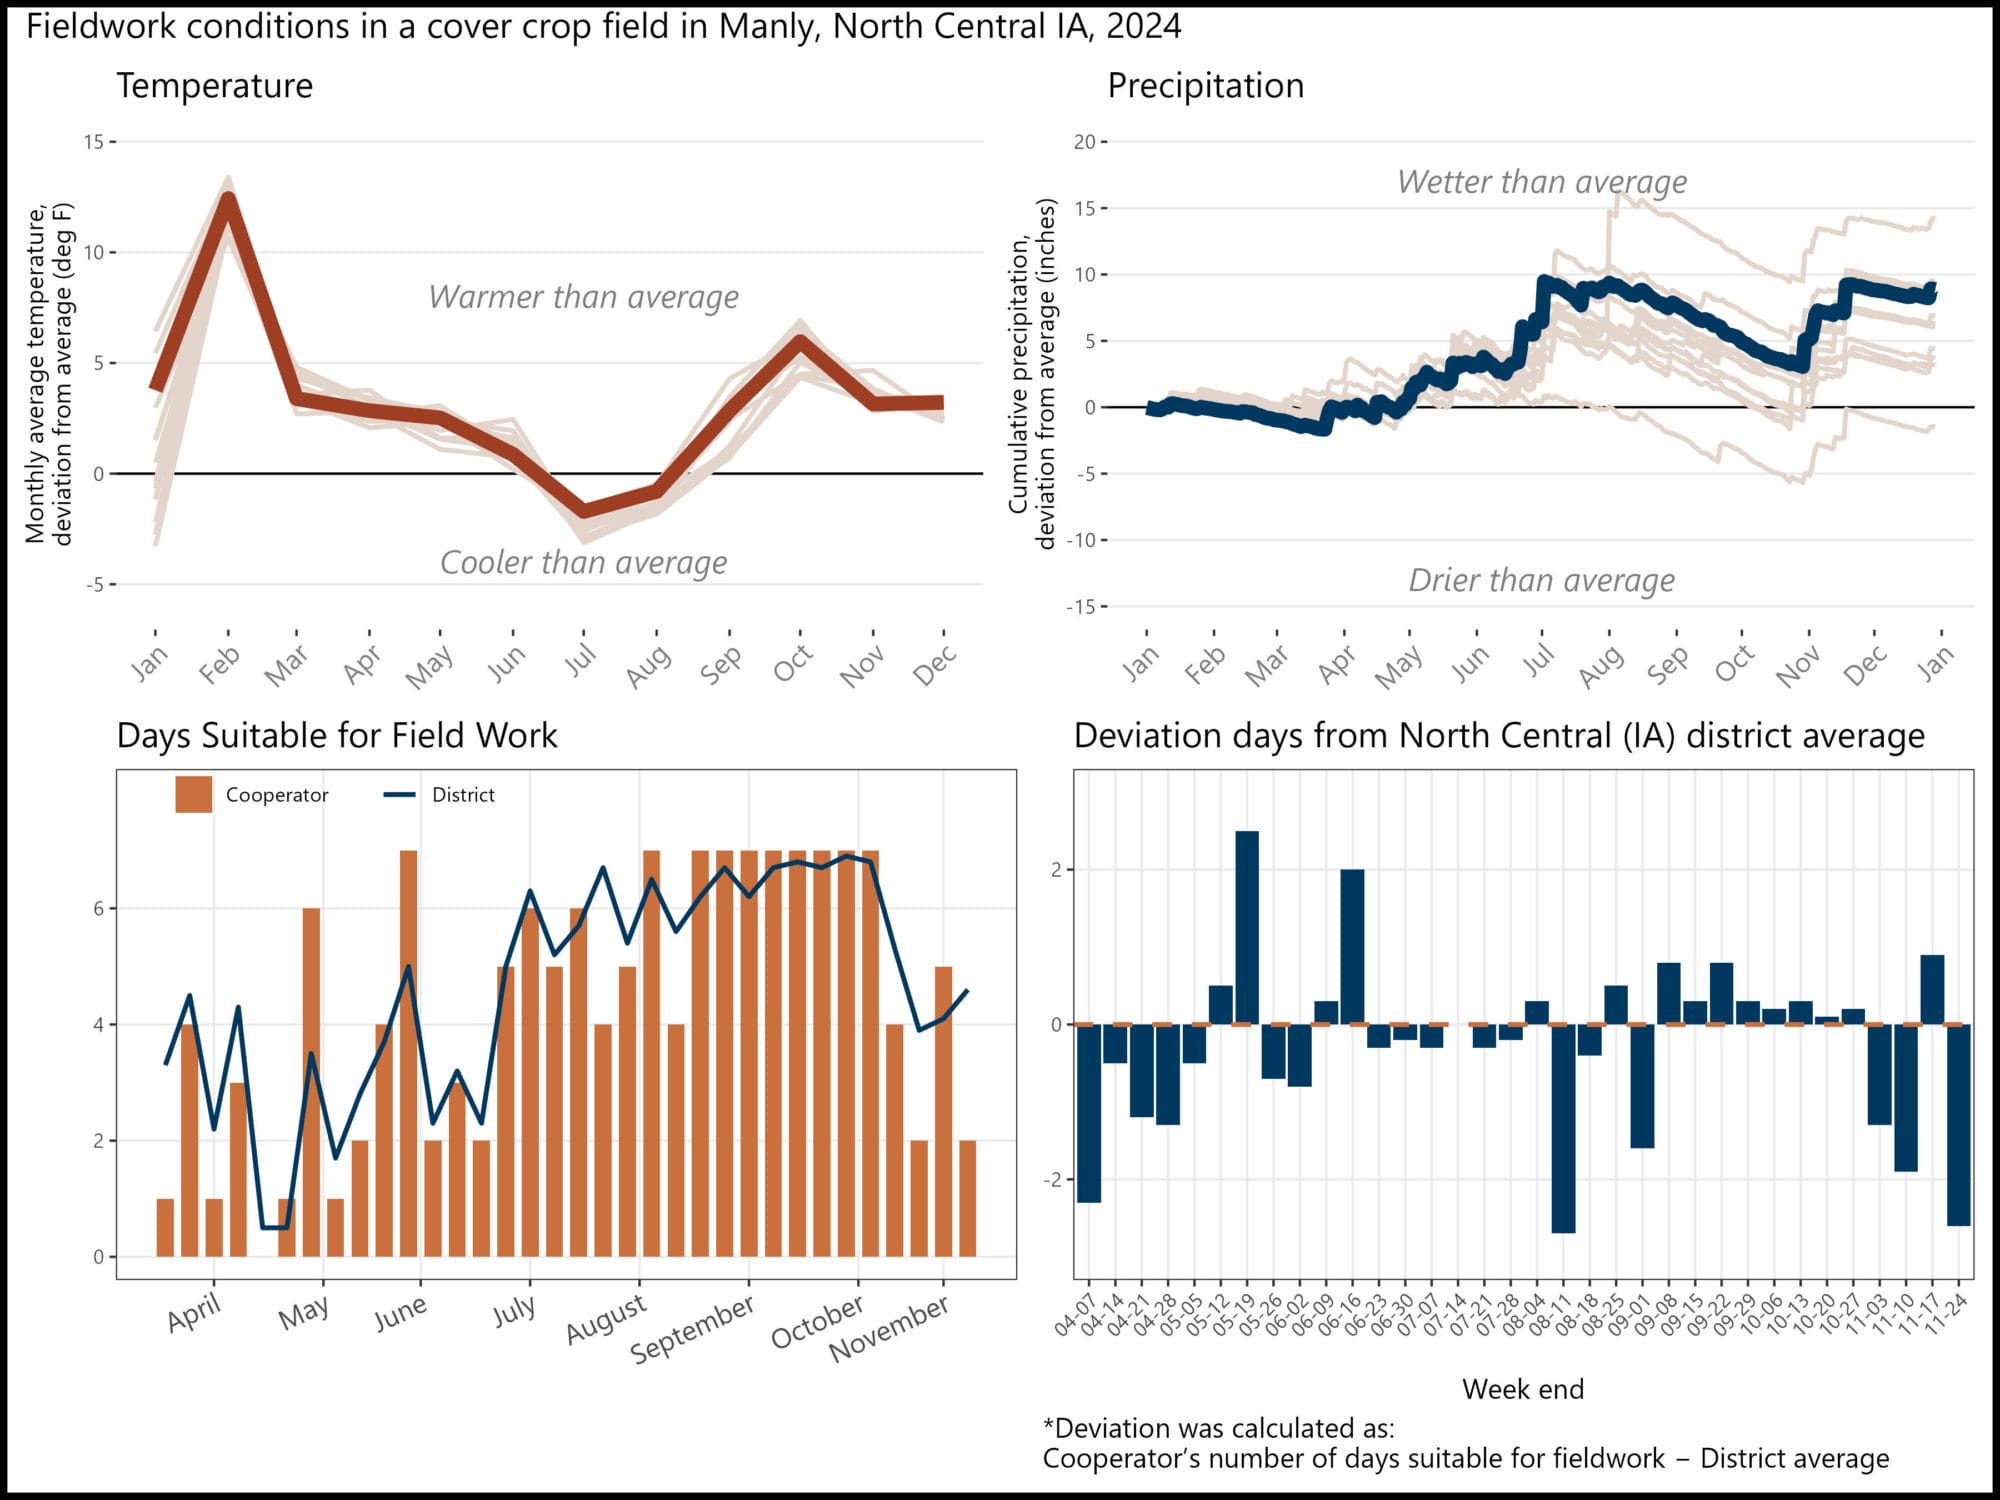
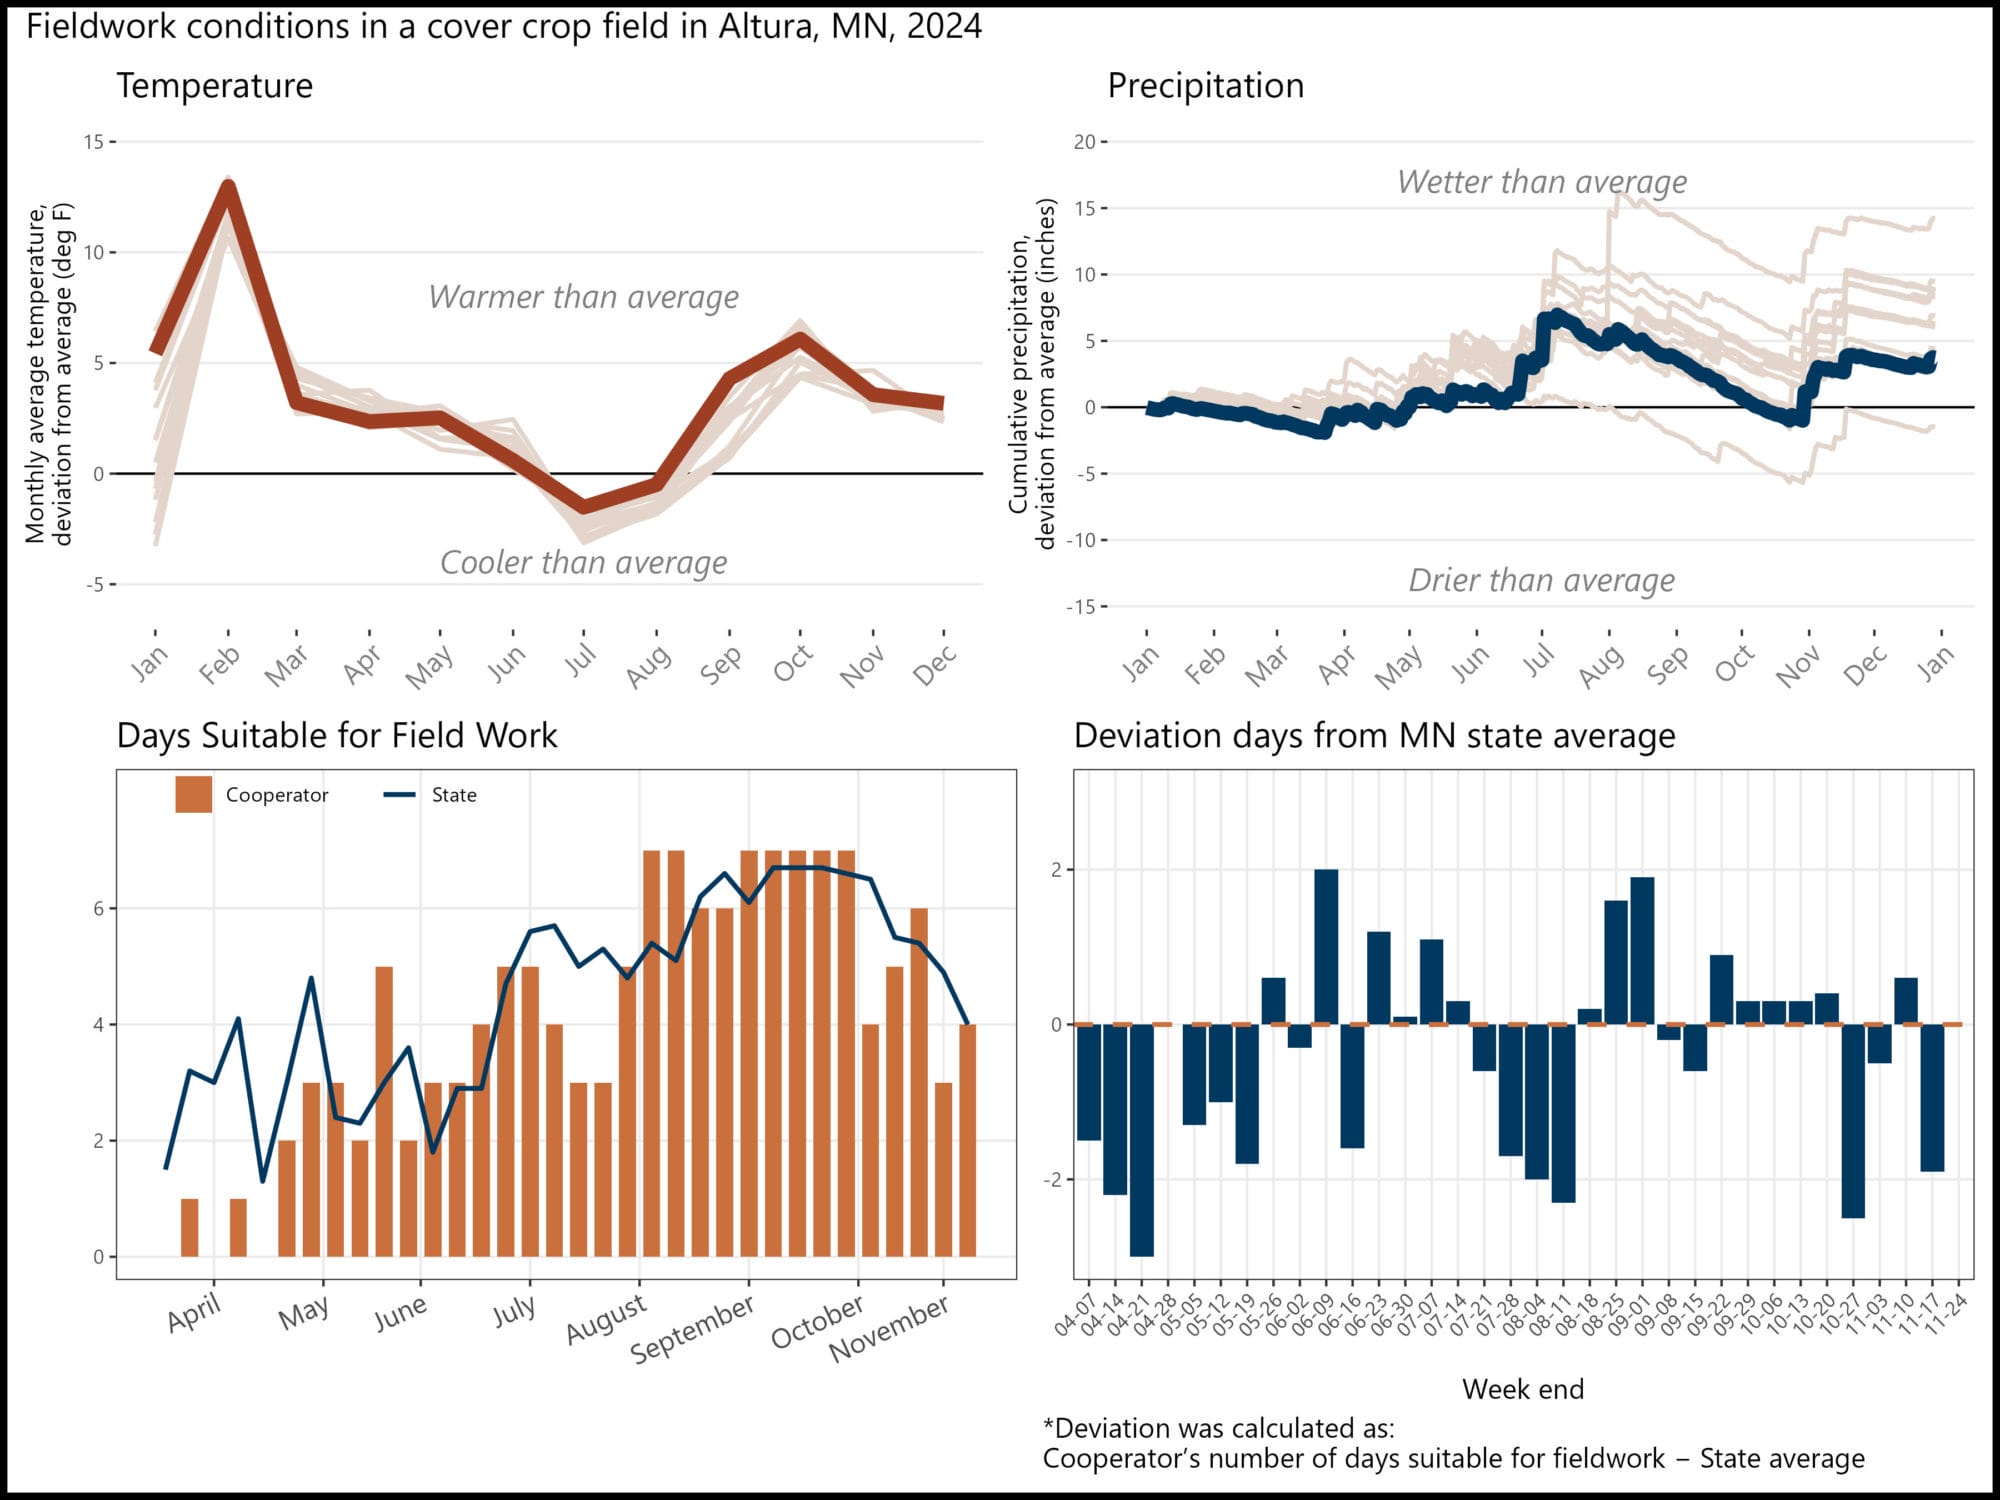
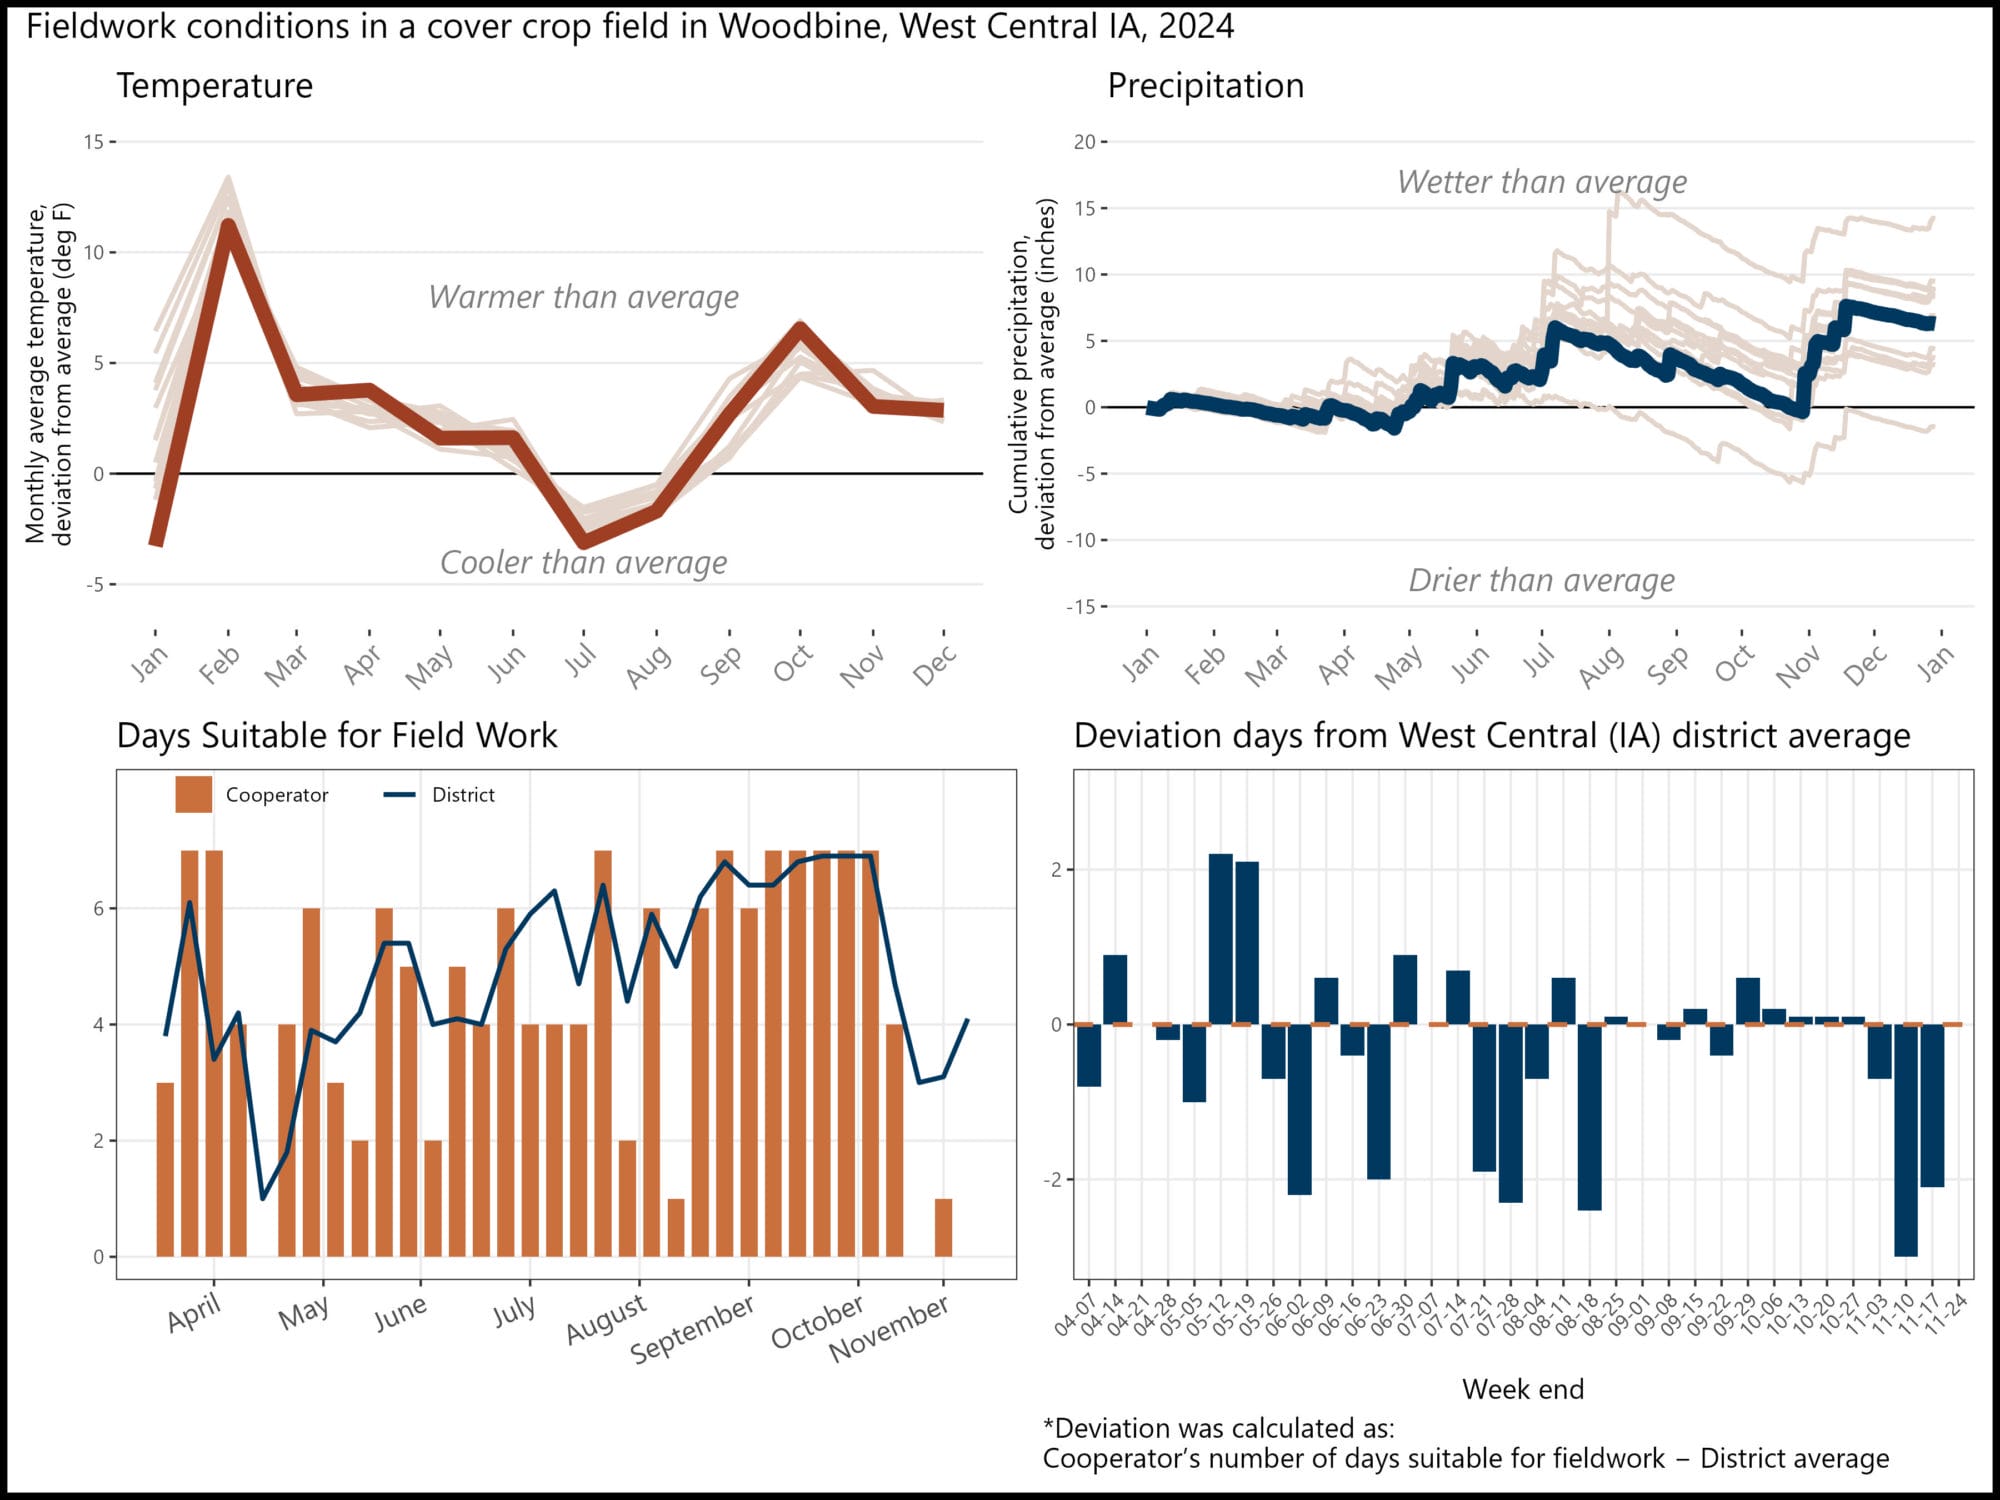
All 15 trials saw a warm start and wetter-than-average growing season (Figure 2).
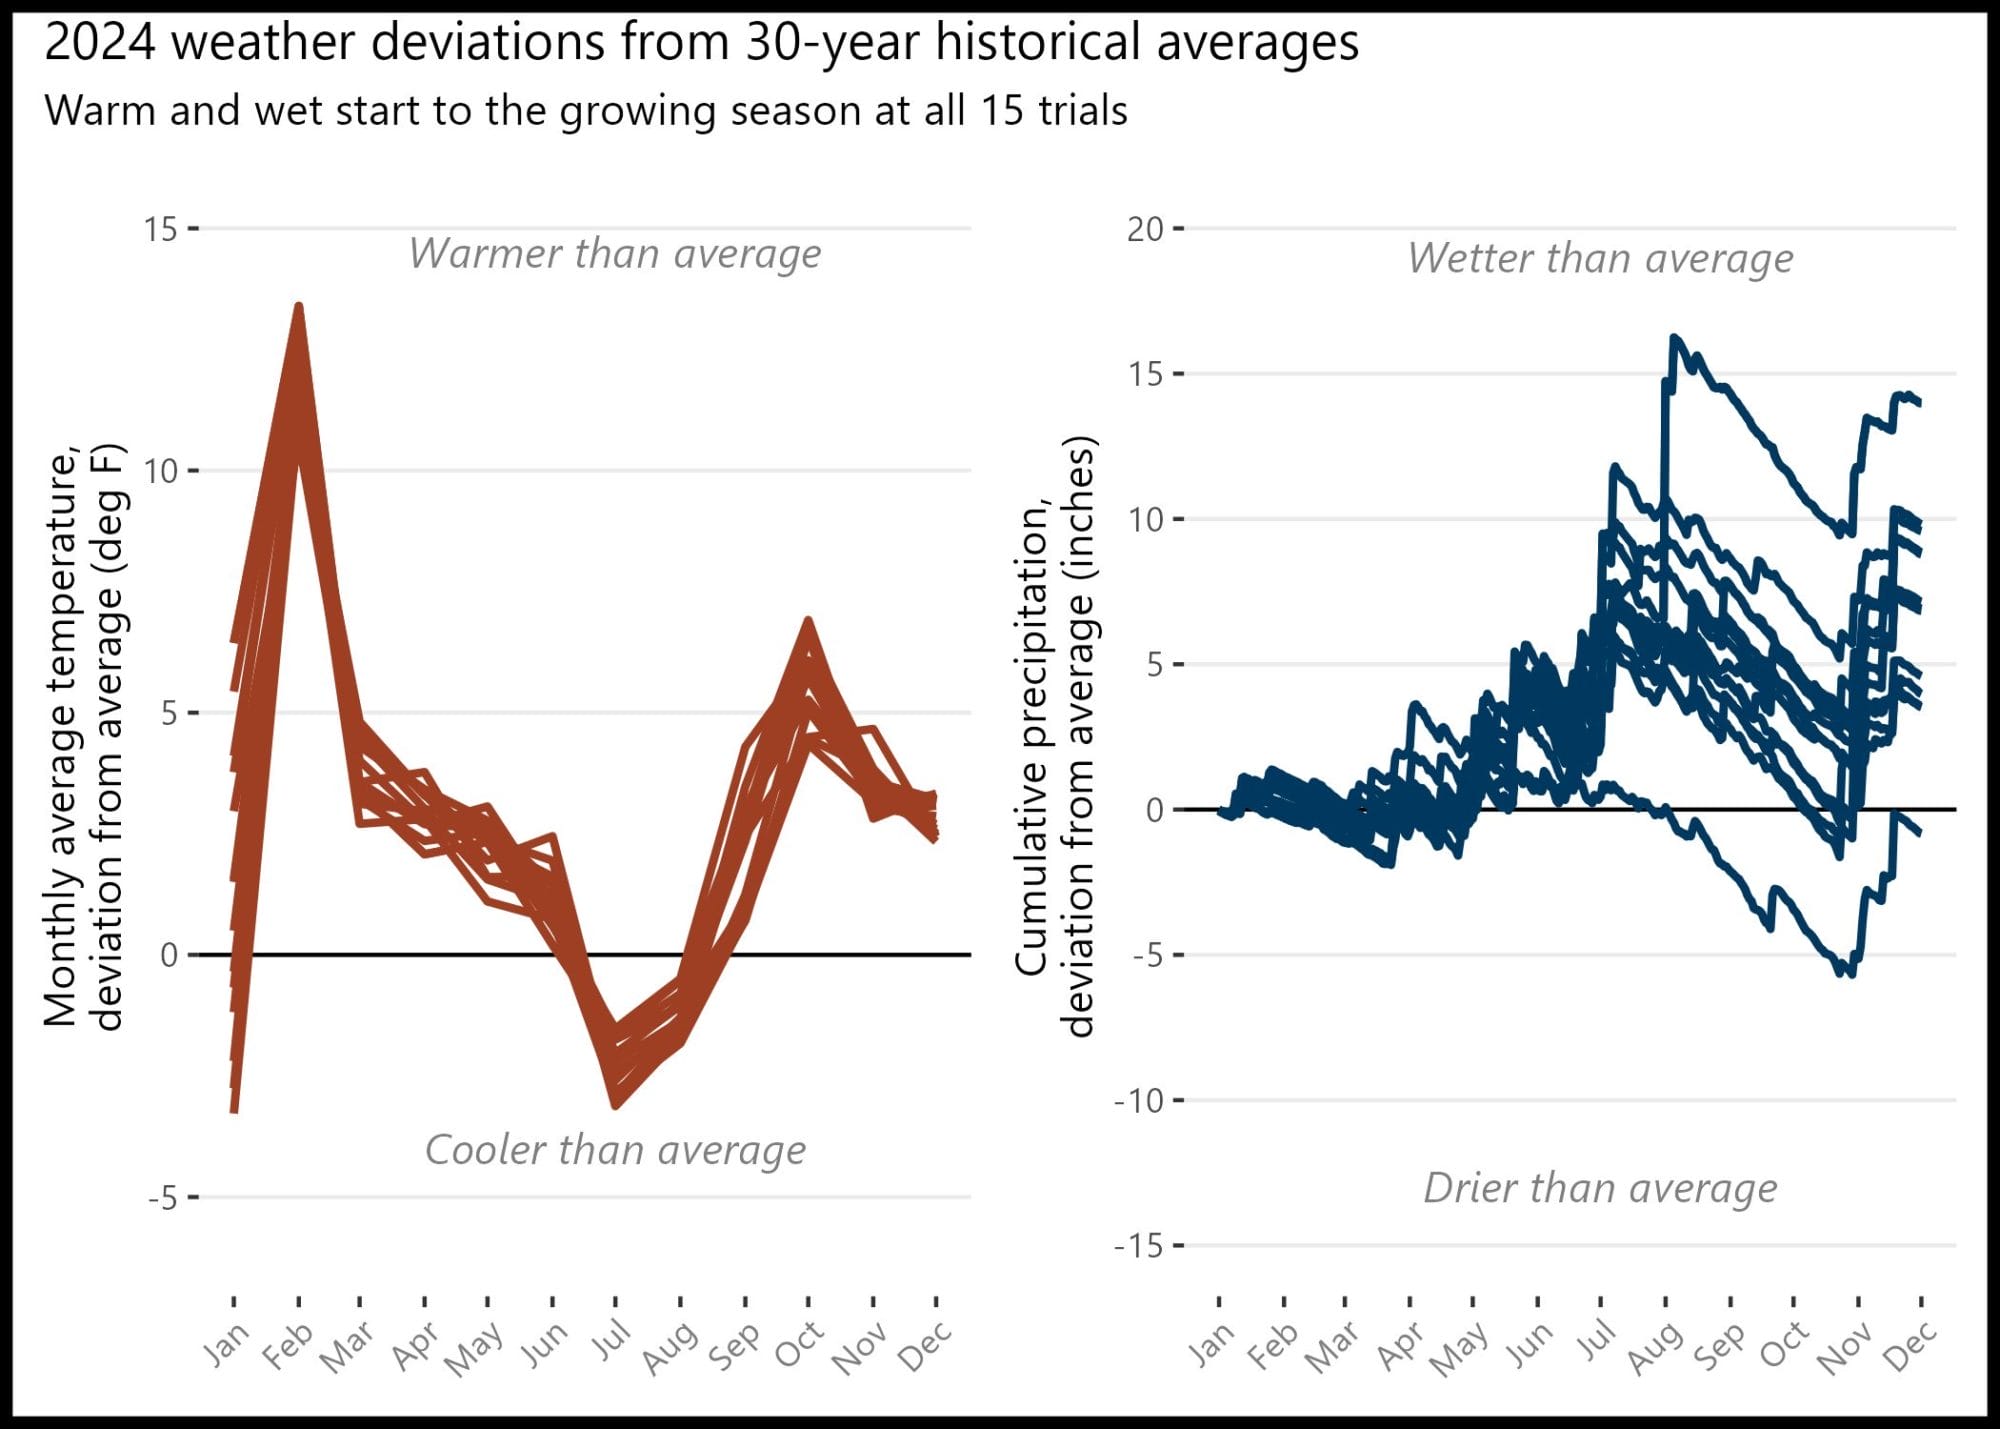
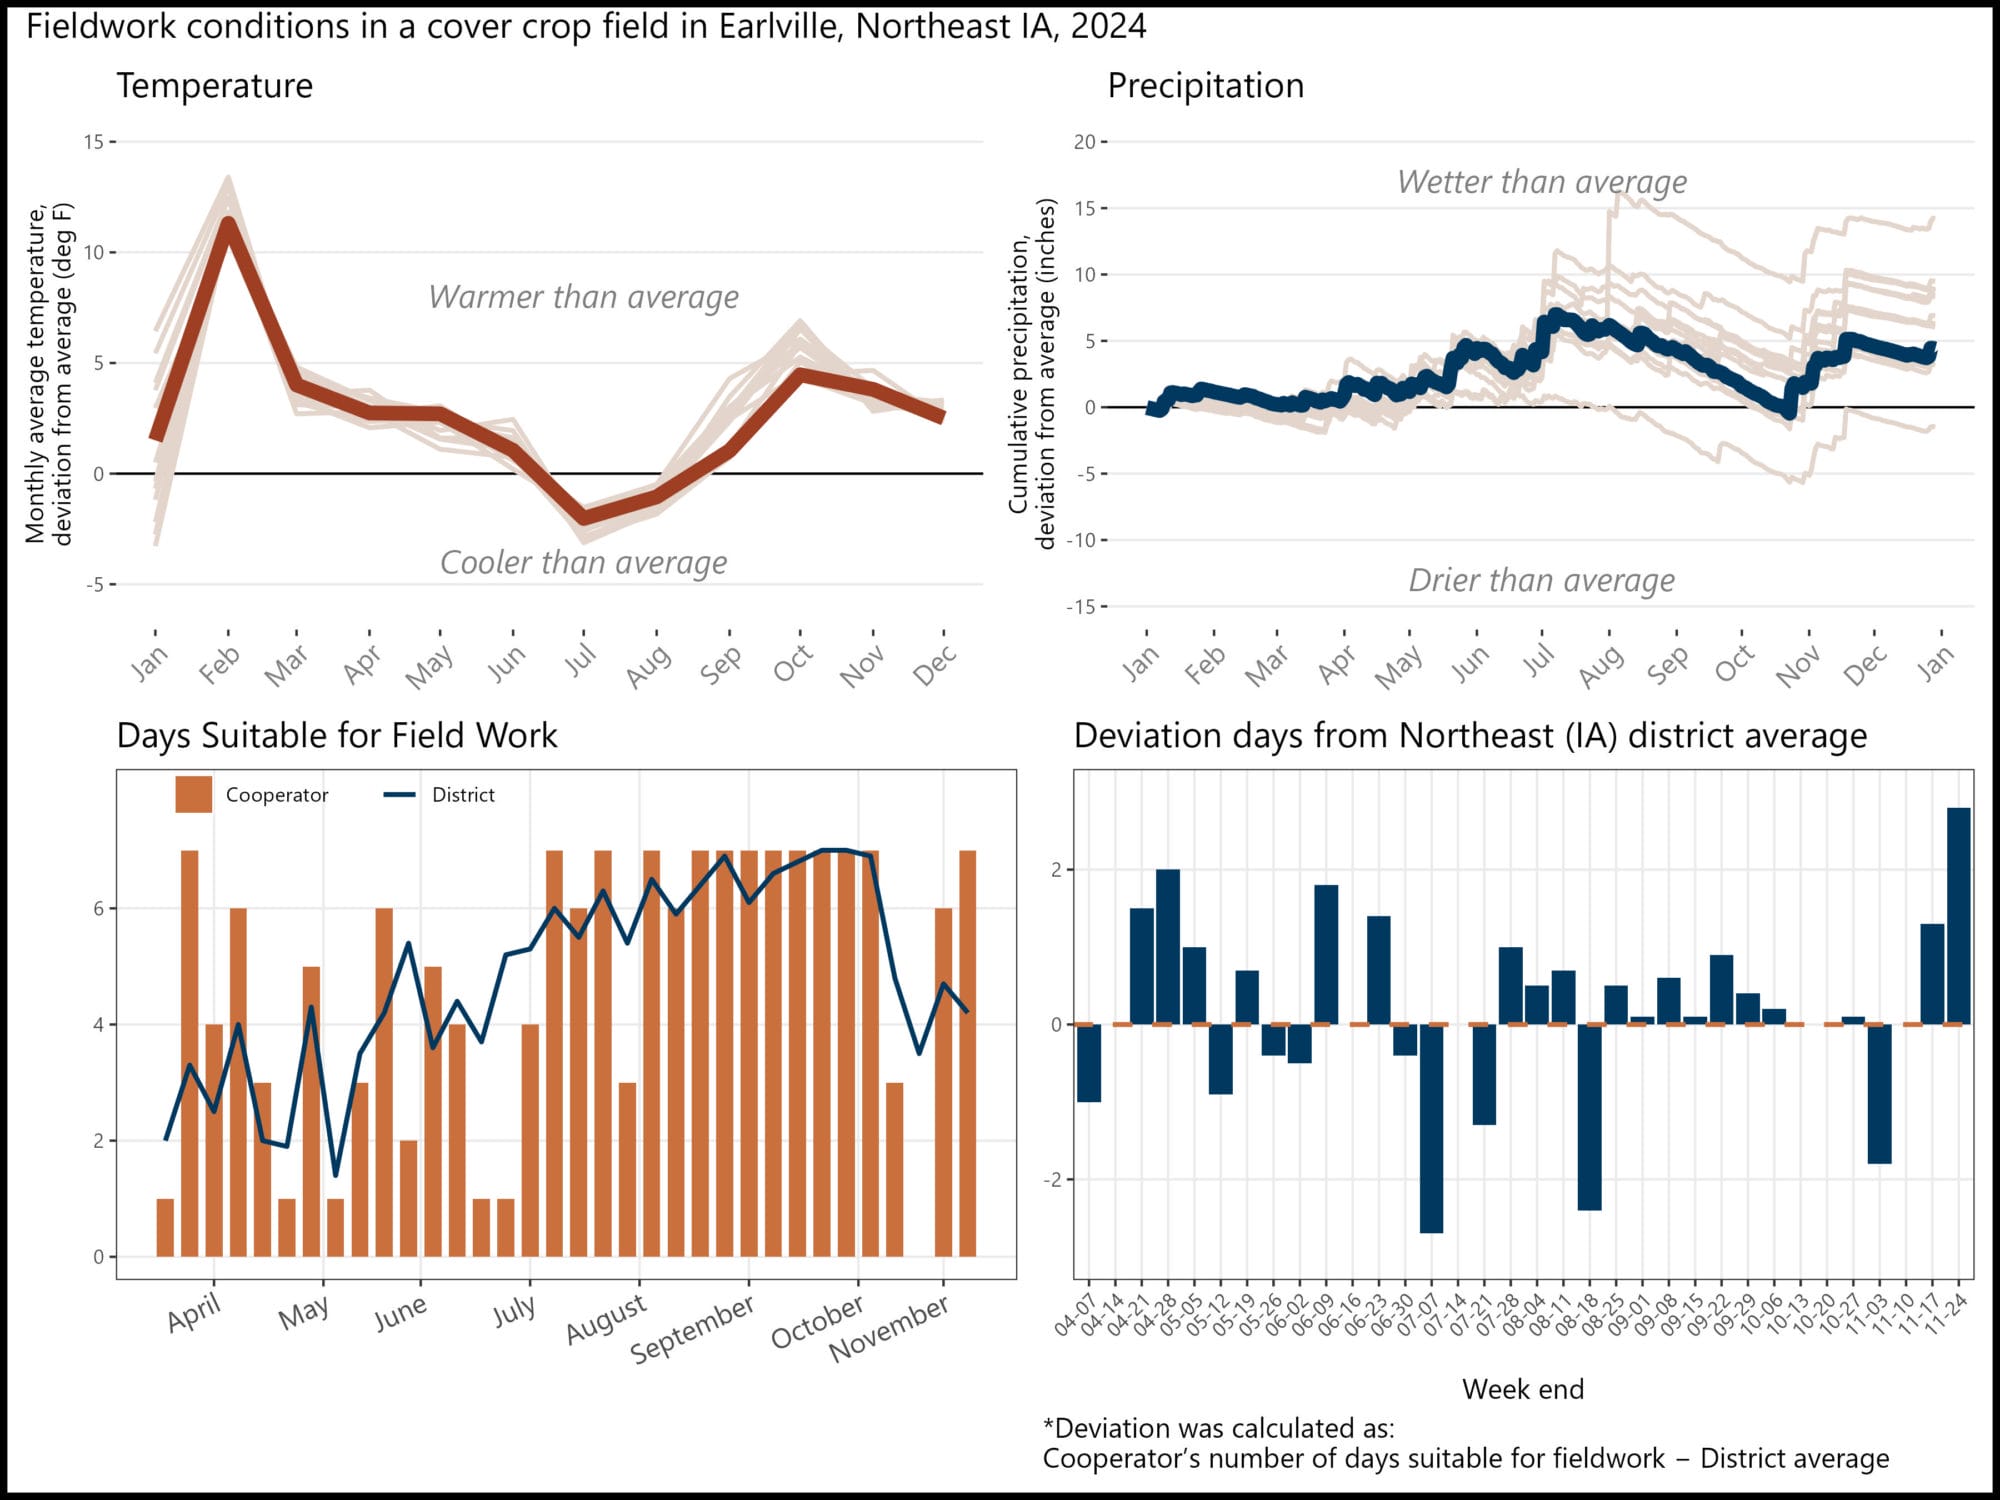
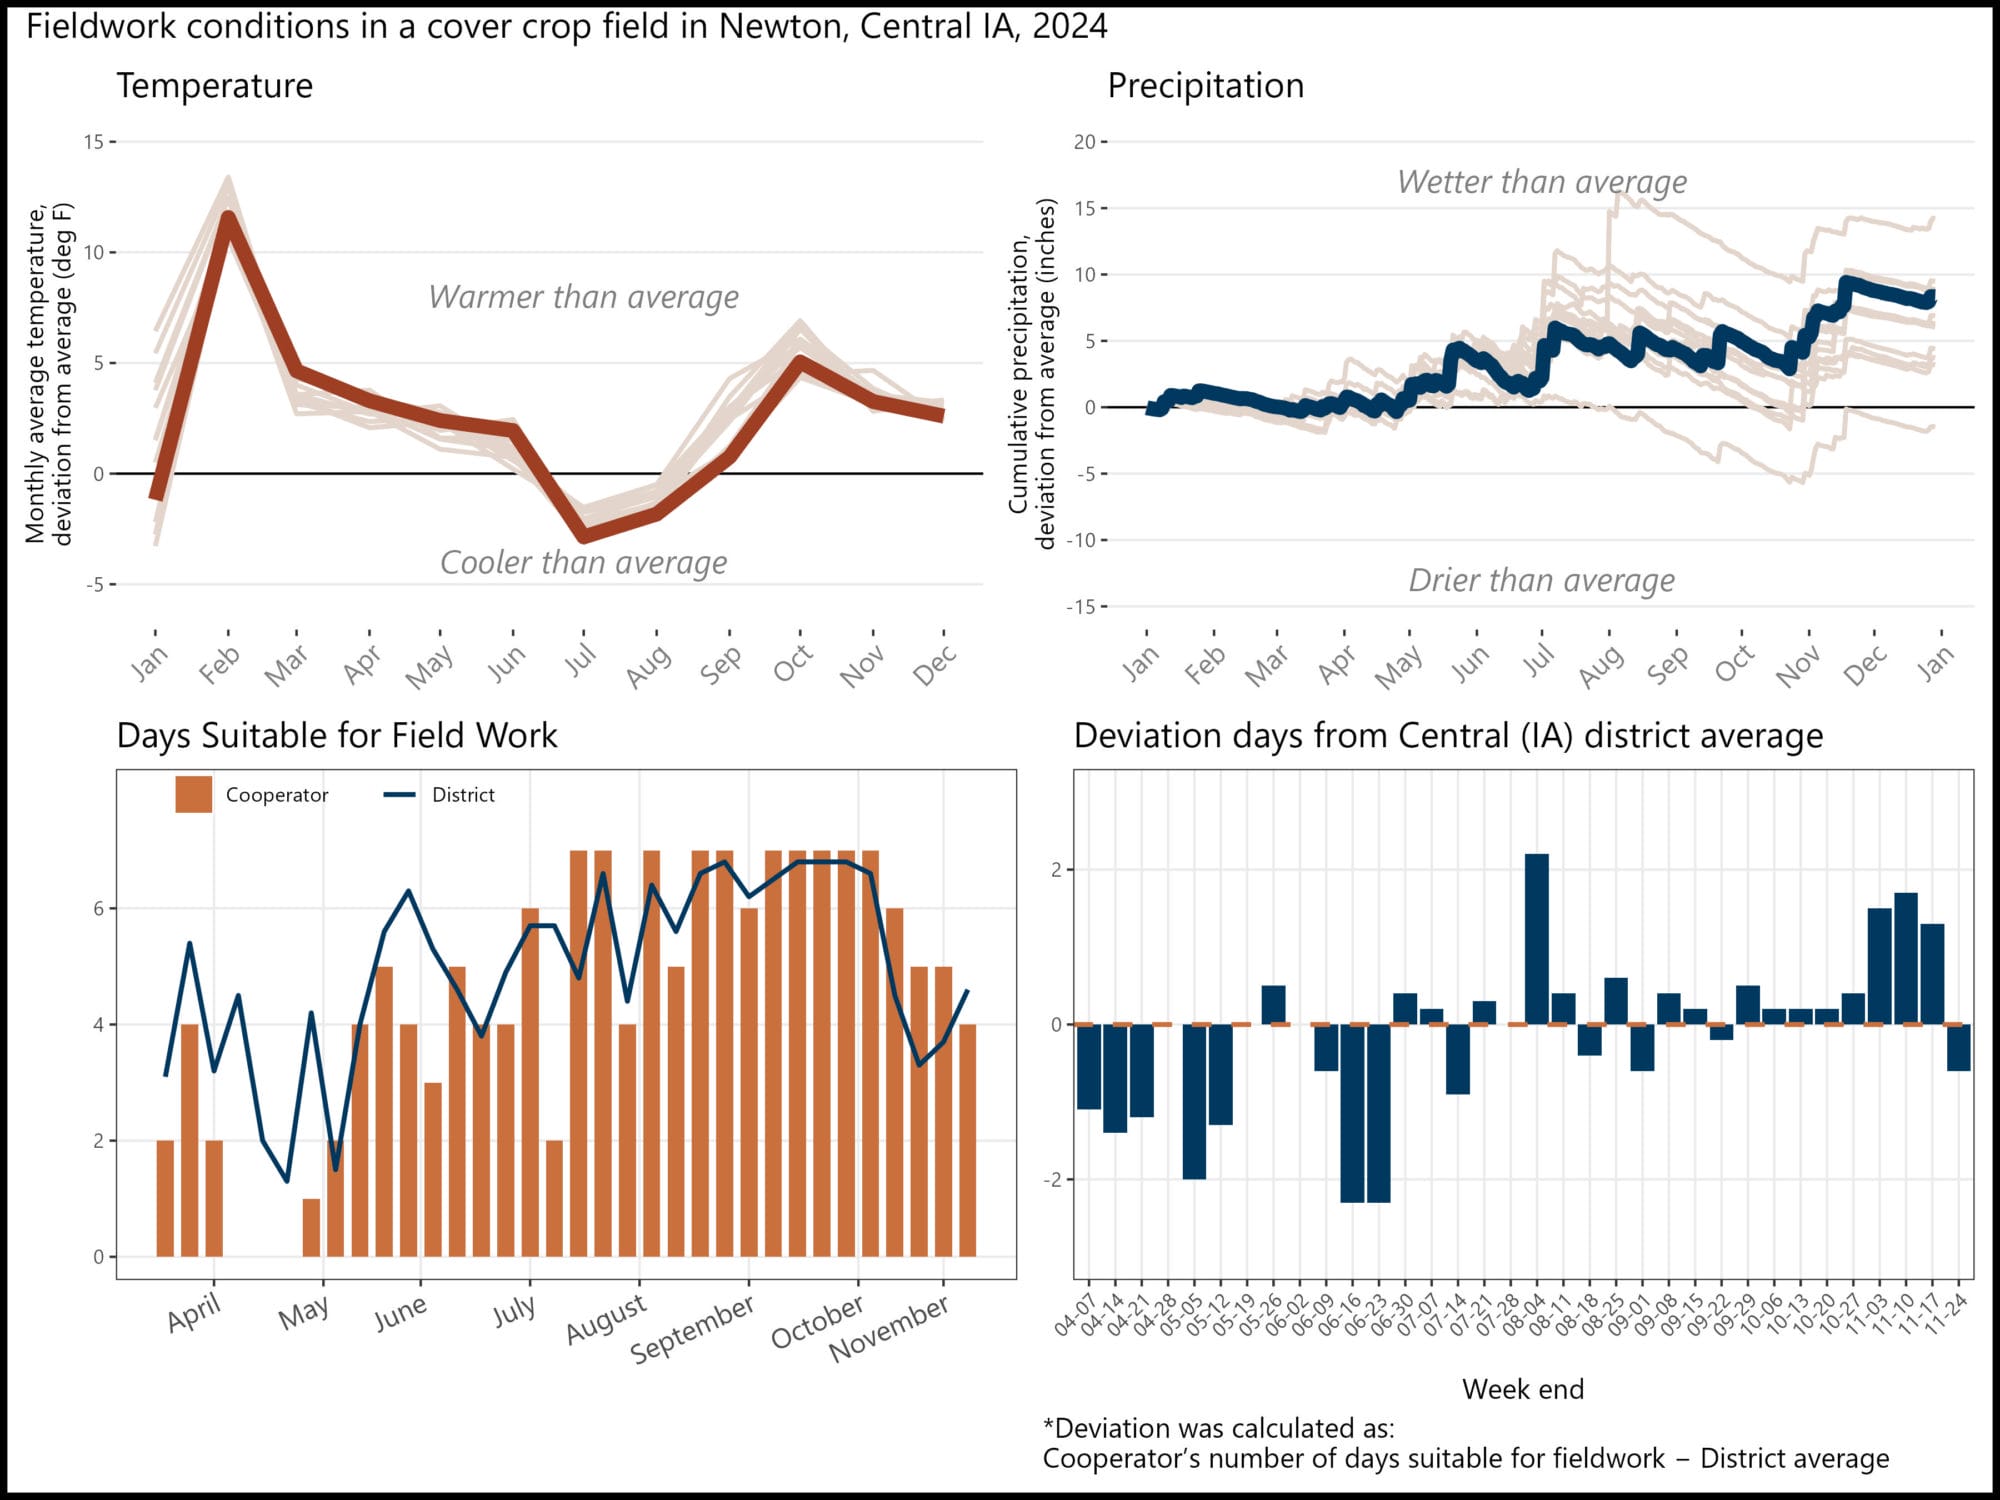
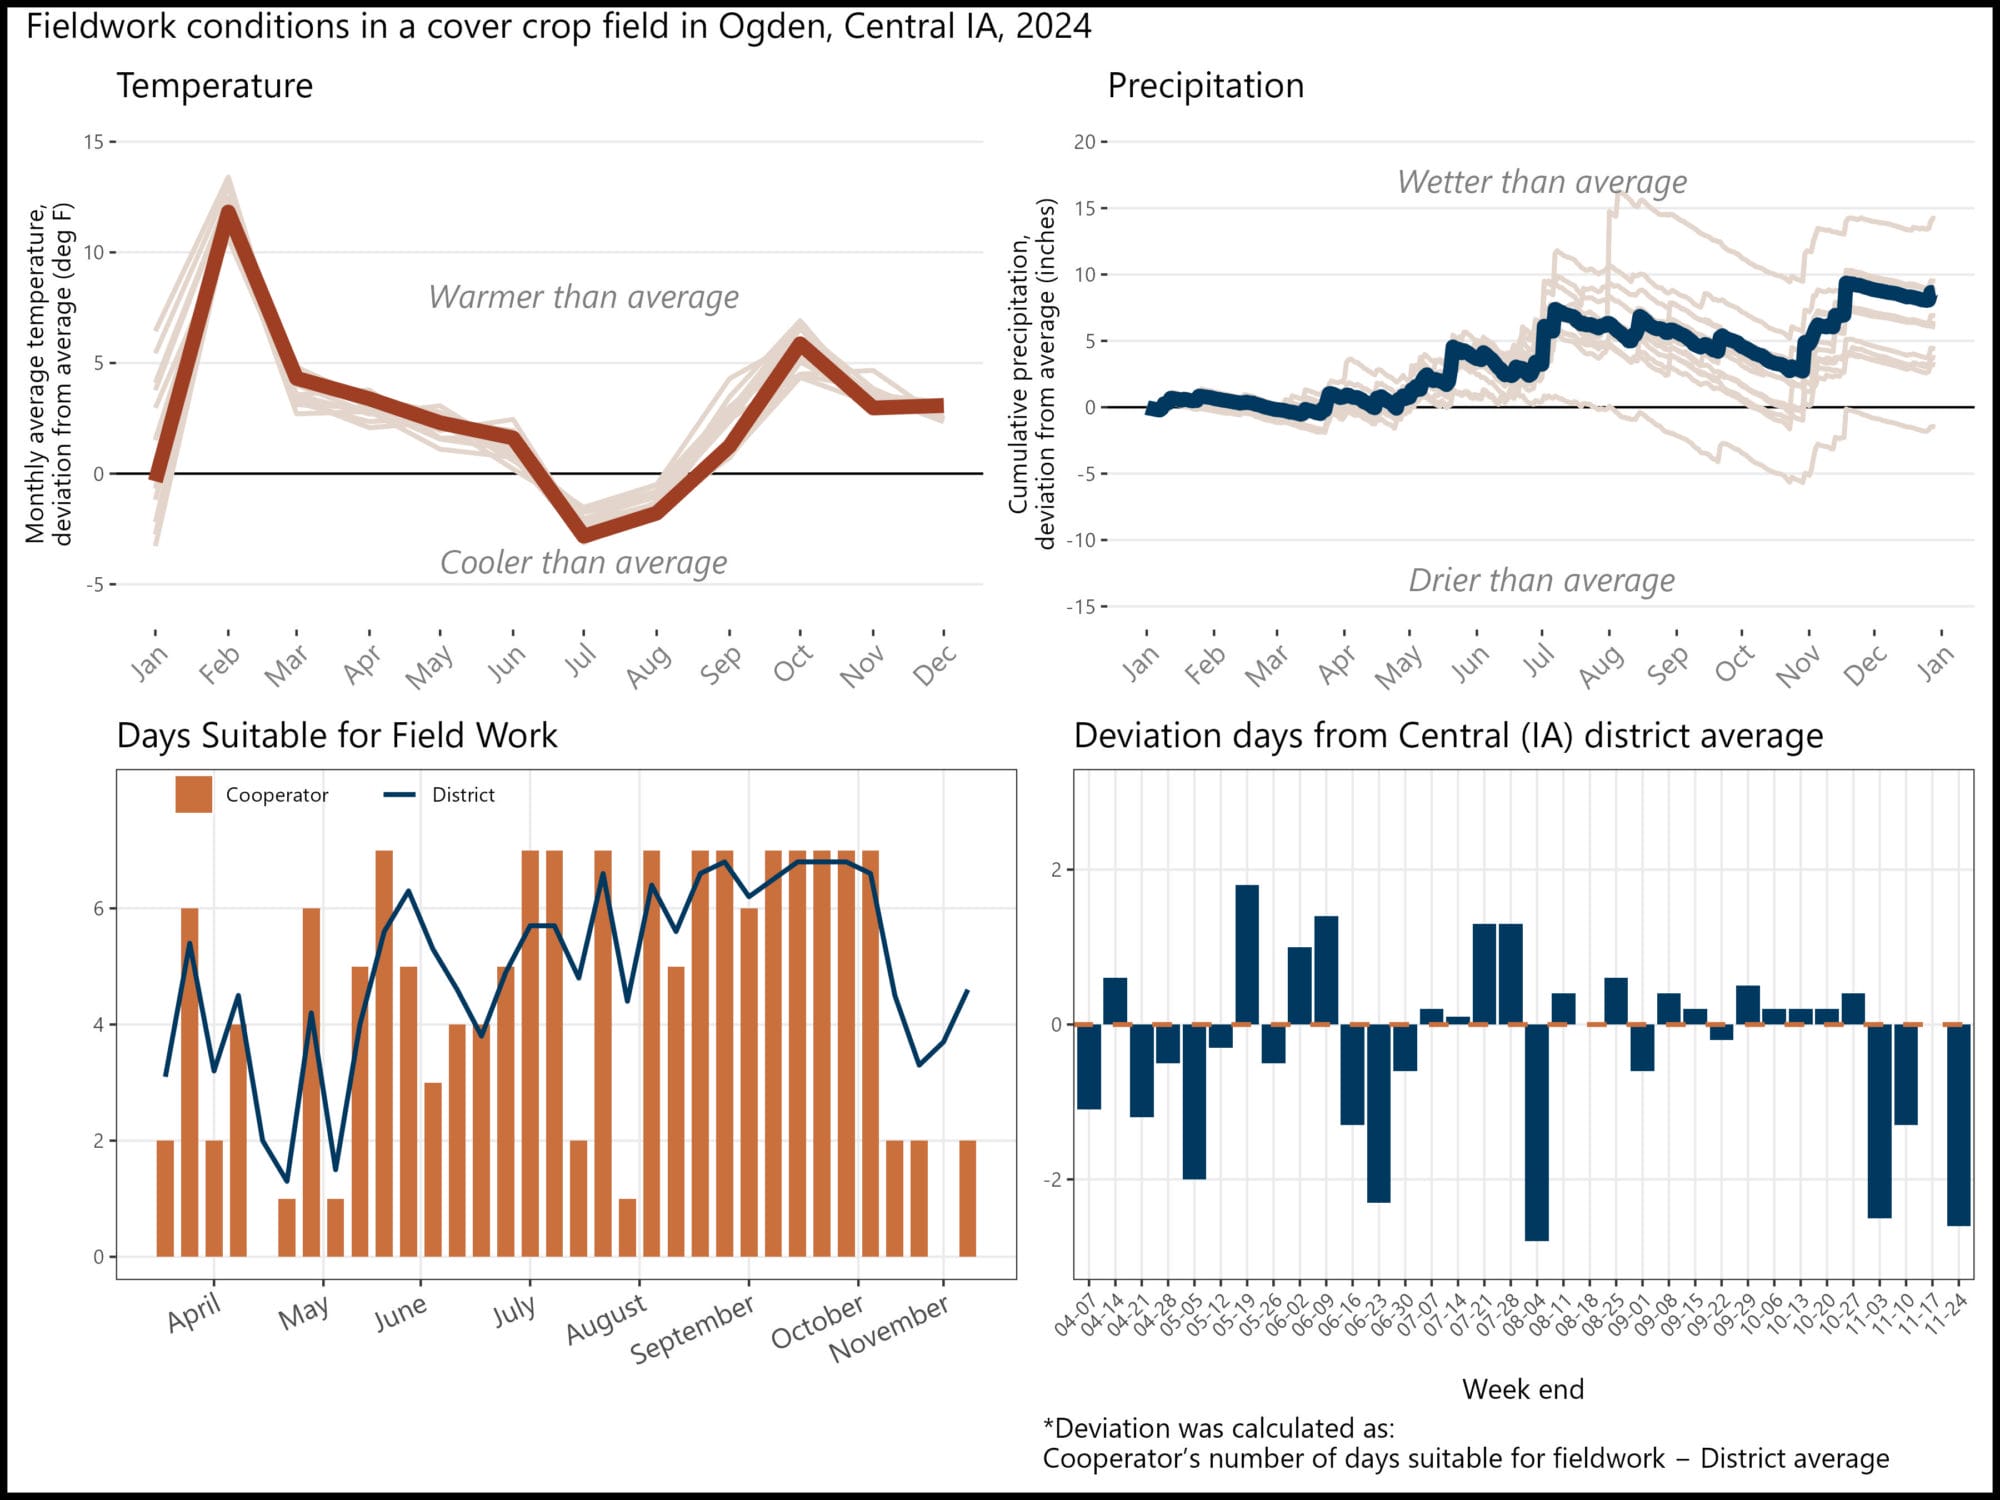
Figure 2. Individual cooperator site weather compared to 30-year historical averages for that site. (Left) Average monthly air temperature deviations and (right) cumulative precipitation deviations. Overall, although all sites experienced a warm start and wet growing season, the diversity in field management and cropping systems history contributed to varied outcomes for each cooperator.
Farmers recorded data over a 34-week period, from April 1 to November 25, resulting in a total of 521 data points across the 15 locations. These records were then used in comparison with USDA data reports (Figure 3). On average, farmers reported more days suitable for fieldwork compared to their district average in 53% of weeks in 2024. This trend varied by month: farmers most frequently exceeded their district averages in June (58.3% of weeks), September (76%), and October (60%). In April, May, July, and August the percentage of weeks where farmers had more days suitable for field work ranged from 41.7 to 55%. In contrast, November had the lowest rate, with only 29.5% of weeks showing higher farmer-reported fieldwork days than the district averages.
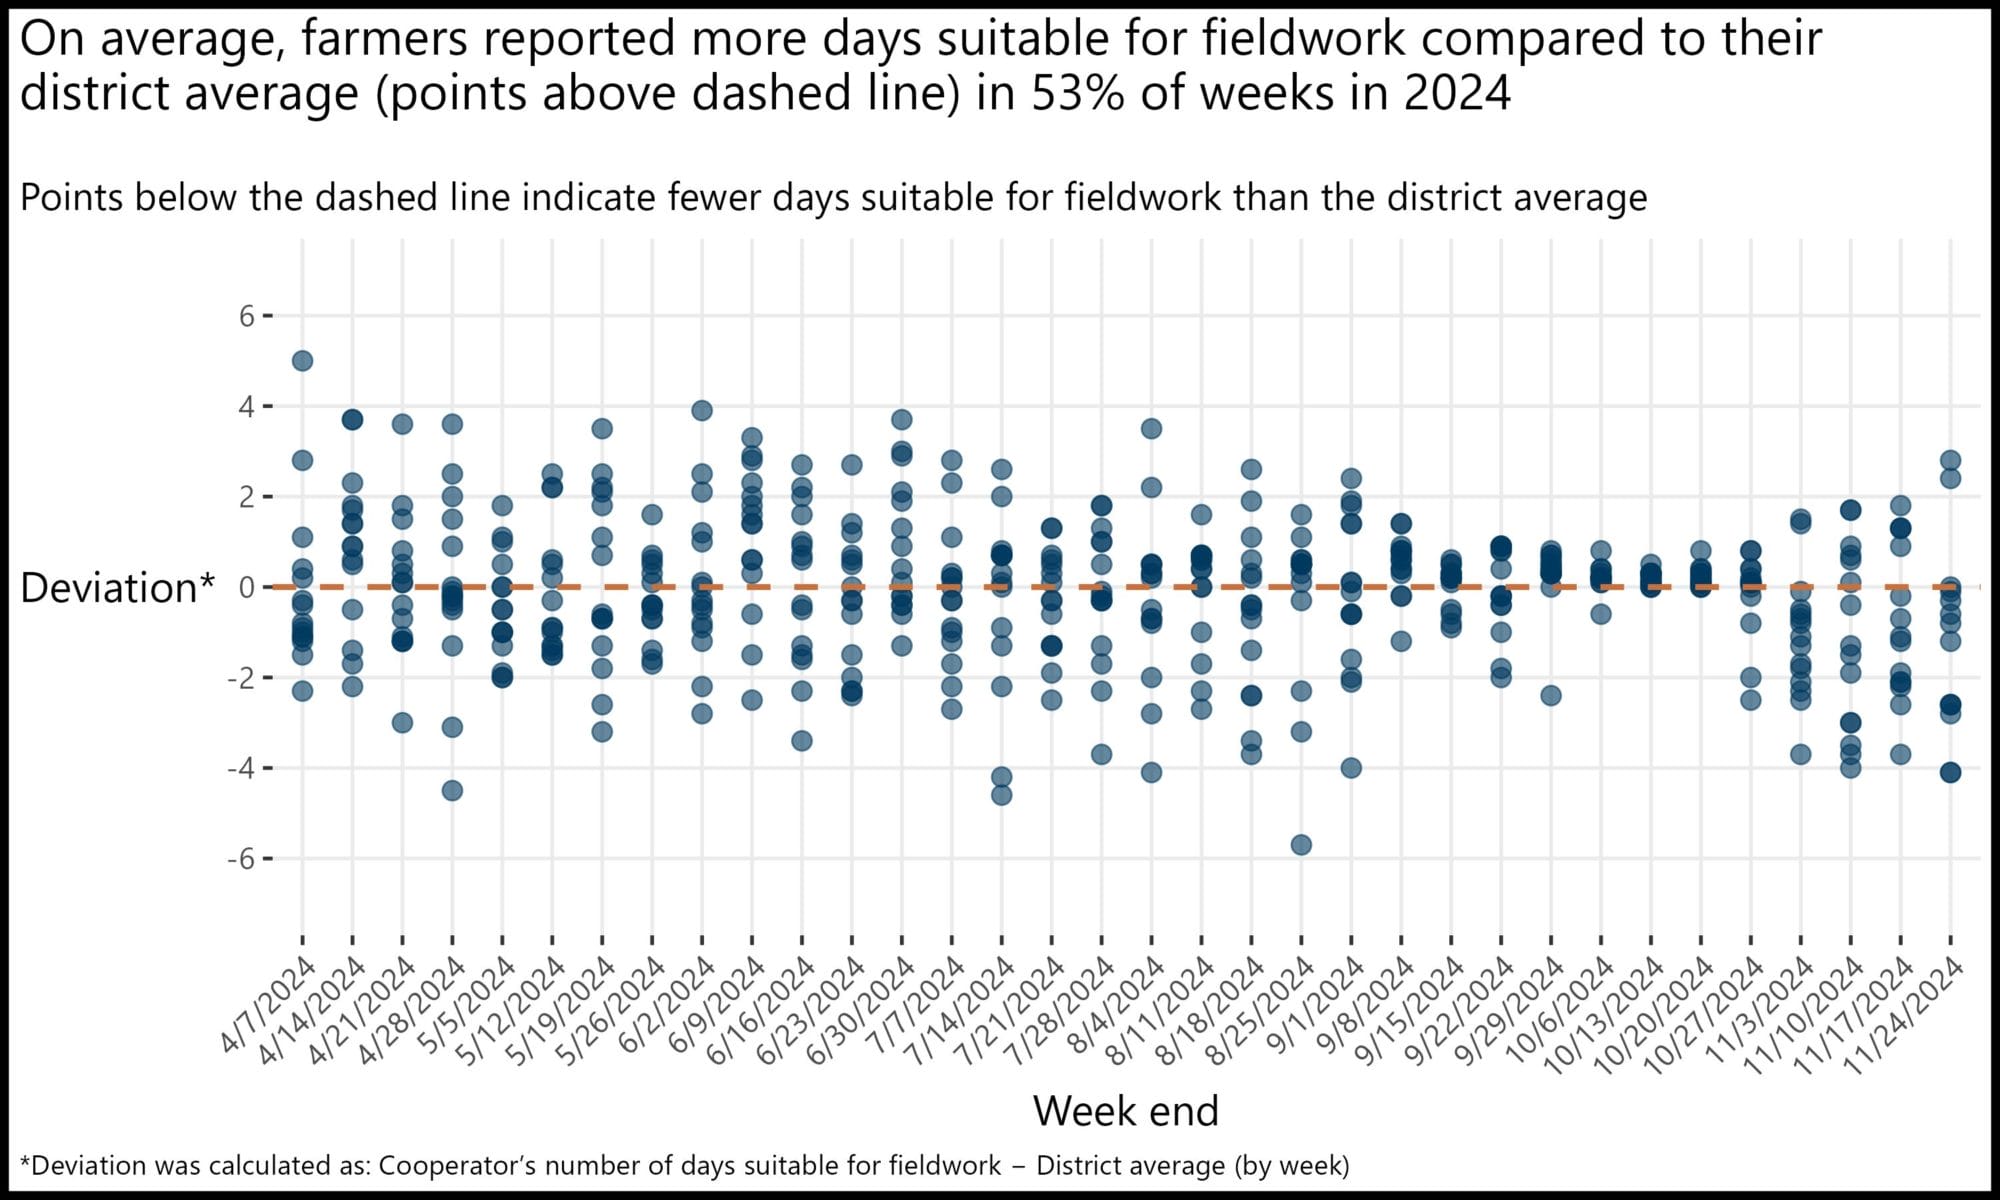
Figure 3. Weekly deviation between farmer-reported and USDA-reported days suitable for fieldwork during the 2024 growing season. Each point represents a single cooperator’s deviation from their respective district average for a given week. Points above the dashed orange line indicate that a farmer reported more days suitable for fieldwork than the district average, while points below indicate fewer days. Overall, farmers reported more suitable days than their district averages in 53% of the weeks observed.
Conclusions and Next Steps
The first year of this project turned out to have great outcomes and mindful feedback from farmers. Although the results are yet somewhat inconclusive, we were able to see that cover crops did have an influence on some of the participating farms, with more days suitable for fieldwork in comparison to the district averages reported by the USDA. By being accountable on monitoring their fields, farmers were able to reflect more on their practices and pay close attention to what is influencing their fieldwork days. Some of them were also able to confirm what they have been observing in the last couple of years. “I believed our healthy soil with minimum disturbance allowed us to “be in the field” more. This is proof [that it is true],” says Josh Hiemstra. He also affirms that the most valuable aspect of conducting this trial was to “being accountable to recording progress in soils.”
The impact of these trials also depends on farmer-to-farmer advocacy for cover crops. As Margaret Hogan shared, “The most valuable aspect of conducting this trial was increasing the number of benefits of using cover crops that I can communicate to fellow farmers.” Joe Rowe echoed this sentiment: “I already see the benefits of cover crops, and was hoping to help share those benefits with those who haven’t tried them yet.”
Despite the well-known benefits of cover crops, adoption across the country remains limited. In Iowa, estimates vary: the 2022 USDA Census reports that 1.3 million acres of the cropland was planted with cover crops, while a recent statewide survey suggests the number could be as high as 3.8 million acres in 2023, out of a total of 22.6 million acres cultivated with corn and soybeans [9], [10]. While agronomic considerations such as seeding and termination are important, the slow adoption of cover crops across agriculturally intensive regions is more deeply rooted in structural and systemic challenges – ranging from policy incentives and market signals to labor, equipment, and risk management concerns – which often outweigh the recognized ecological and agronomic advantages [11].
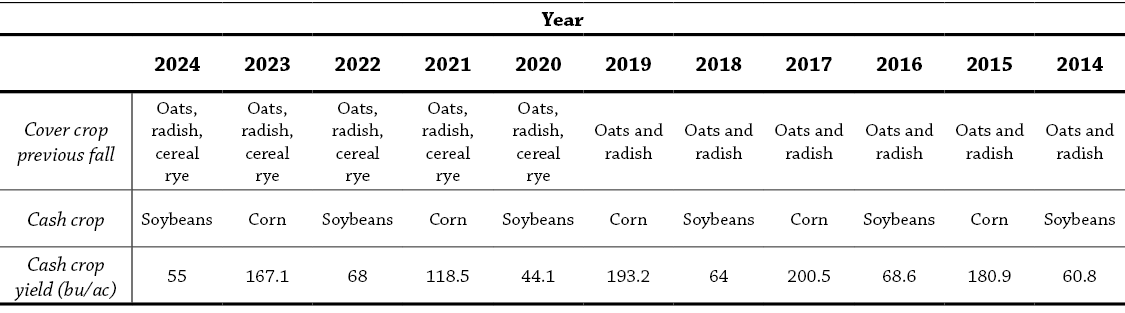
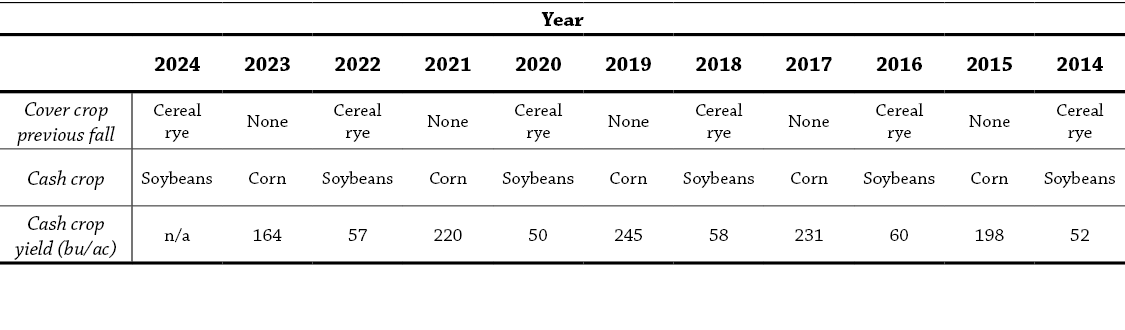
As this project continues, we aim to engage a broader group of farmers across the Midwest in monitoring and collecting data from their cover-cropped fields. Expanding this effort over time will help capture year-to-year variability and deepen our understanding of how cover crops can support farmers in managing soil health and navigating weather-related challenges. In addition, farmers are responsible to provide as much of the following history as possible dating back to 2015: falls in which cover crop were seeded; cash crop planting and harvesting dates; and yield averages of cash crops. While not all participants will have a full 10-year history of cover cropping, all scenarios will be analyzed appropriately to reflect the variation in field histories. With farmer records and remote sensing, the goal is to determine whether cover crop frequency and performance improves cash crop performance and reduces yield volatility.
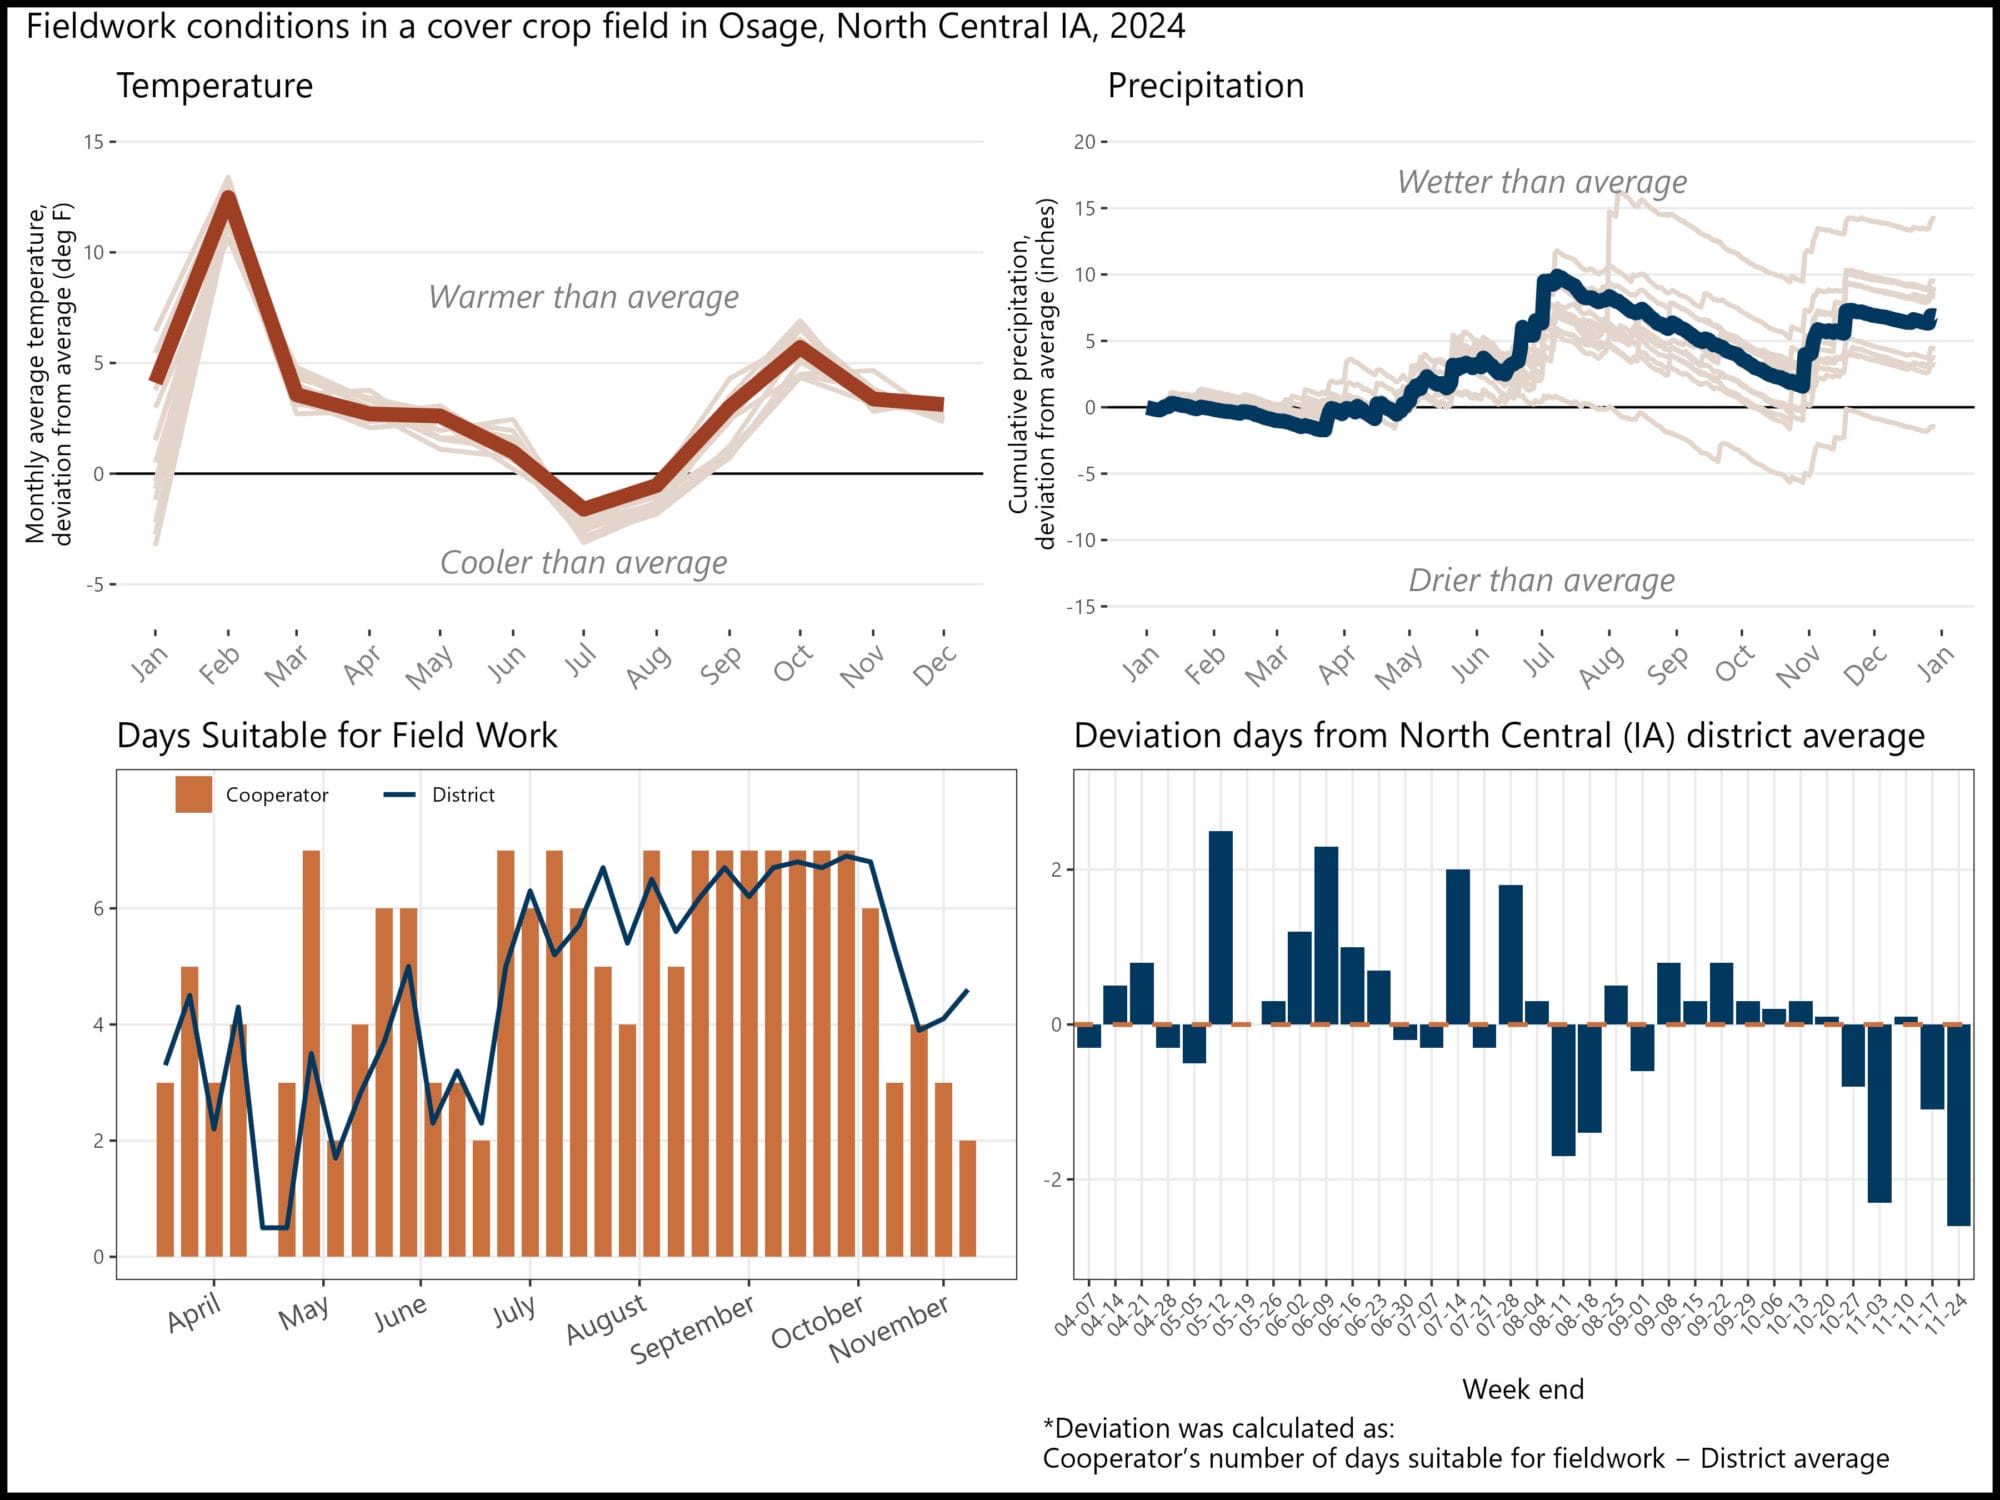
Appendix A. Alec and Rachel Amundson; Osage, Iowa
In 62% of the weeks, Amundson had more days suitable for fieldwork than the North Central district averages.
Field history:
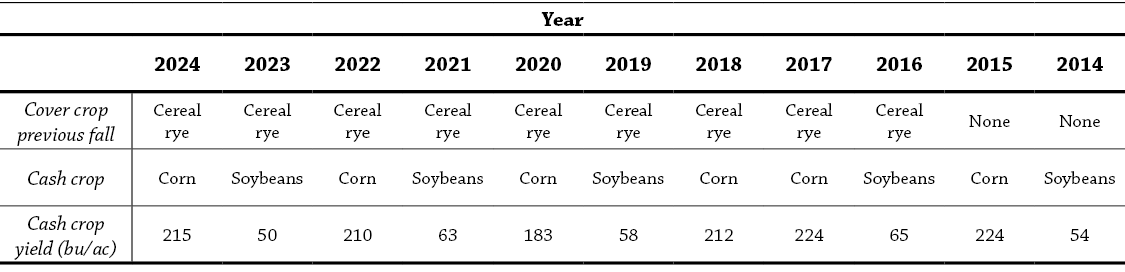
Appendix B. Sam Bennett; Galva, Iowa
In 50% of the weeks, Bennett had more days suitable for fieldwork than the West Central district averages.
Field history:
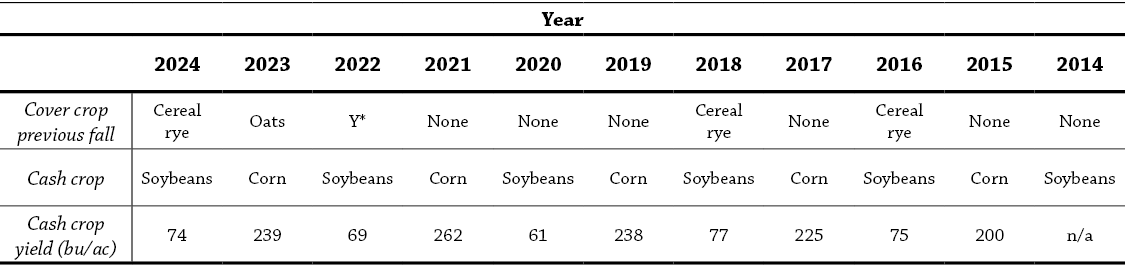
Y* – cover crop species was not informed
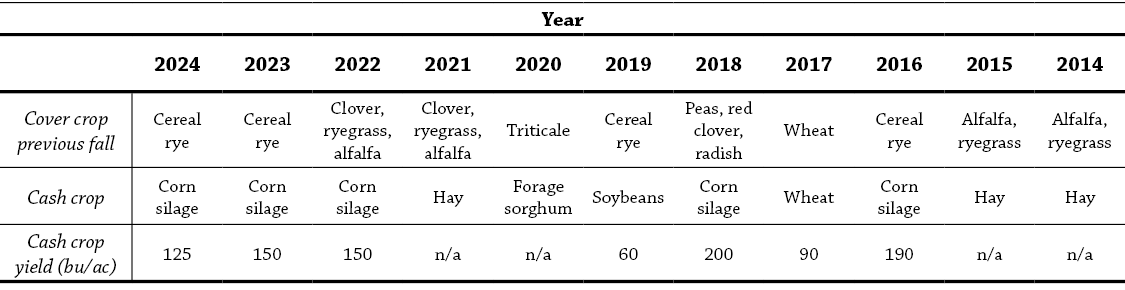
Appendix C. Joe Bragger; Independence, Wisconsin
In 50% of the weeks, Bragger had more days suitable for fieldwork than the West Central district averages.
Field history:
Appendix D. Jim Fitkin; Cedar Falls, Iowa
In 56% of the weeks, Fitkin had more days suitable for fieldwork than the Northeast district averages.

Field history:
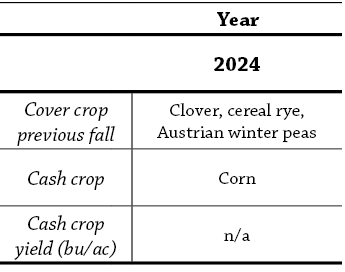
Appendix E. Josh Hiemstra; Brandon, Wisconsin
In 85% of the weeks, Hiemstra had more days suitable for fieldwork than the East Central district averages.
Field history:
Appendix F. Margaret Hogan; Earlville, Iowa
In 59% of the weeks, Hogan had more days suitable for fieldwork than the Northeast district averages.
Field history:
Appendix G. Jarret Horn; Newton, Iowa
In 50% of the weeks, Horn had more days suitable for fieldwork than the Central district averages.
Field history:

Appendix H. Keaton Krueger; Ogden, Iowa
In 50% of the weeks, Krueger had more days suitable for fieldwork than the Central district averages.
Field history:
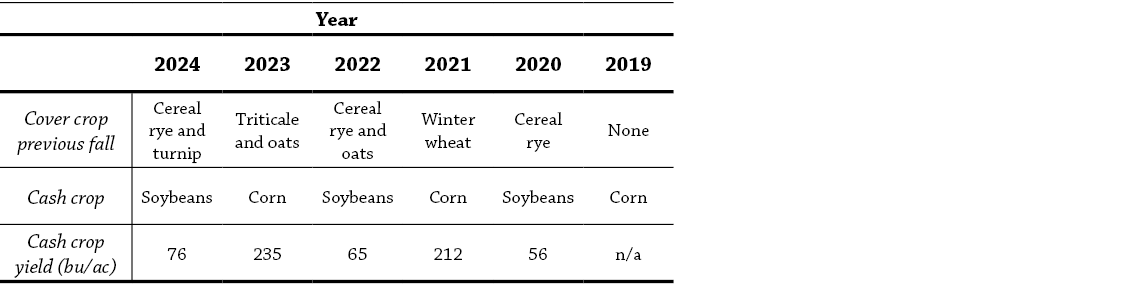
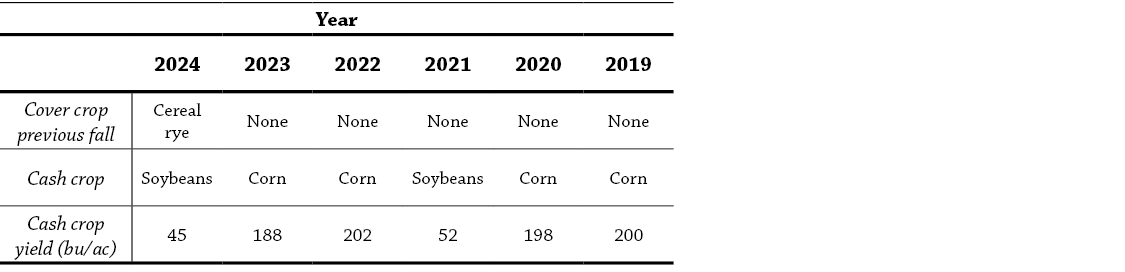
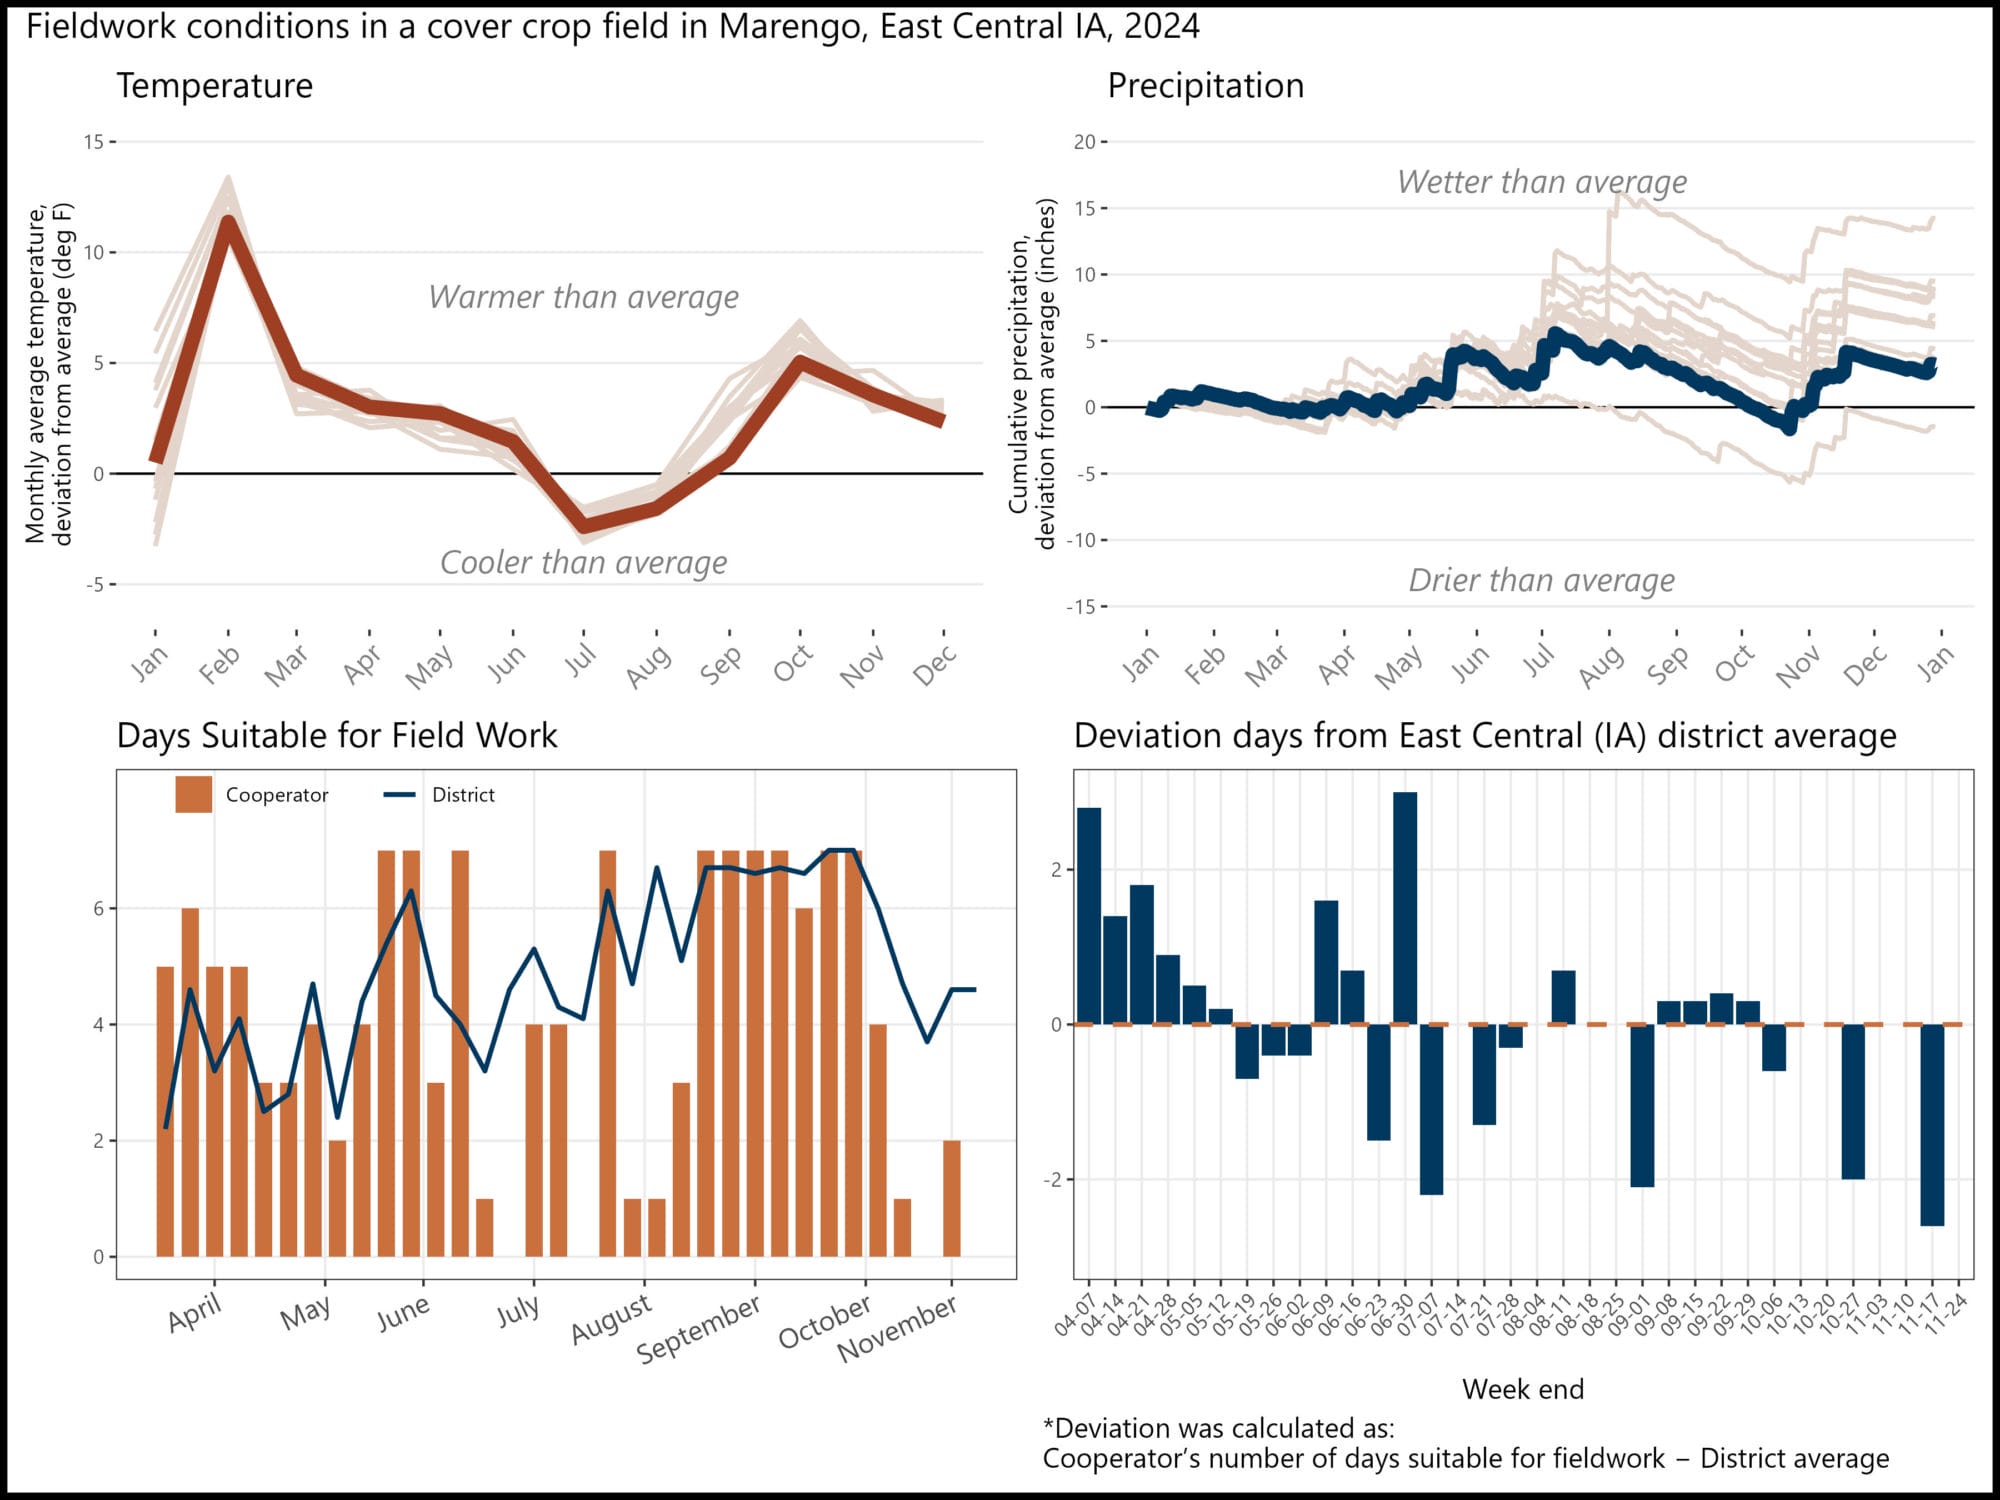
Appendix I. Ross McCaw; Marengo, Iowa
In 42% of the weeks, McCaw had more days suitable for fieldwork than the East Central district averages.
Field history:
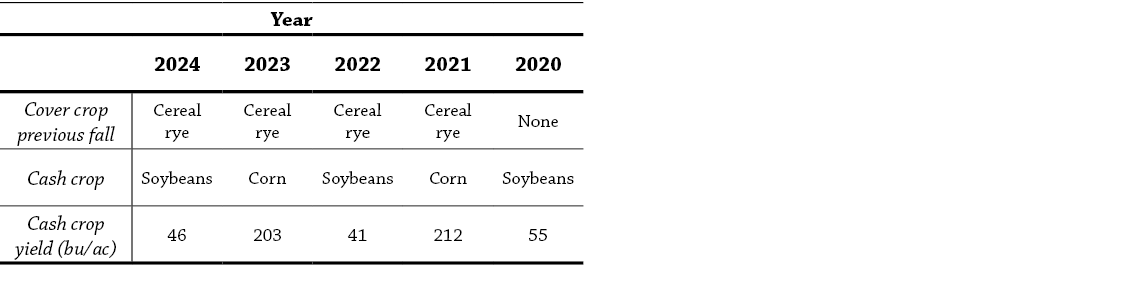
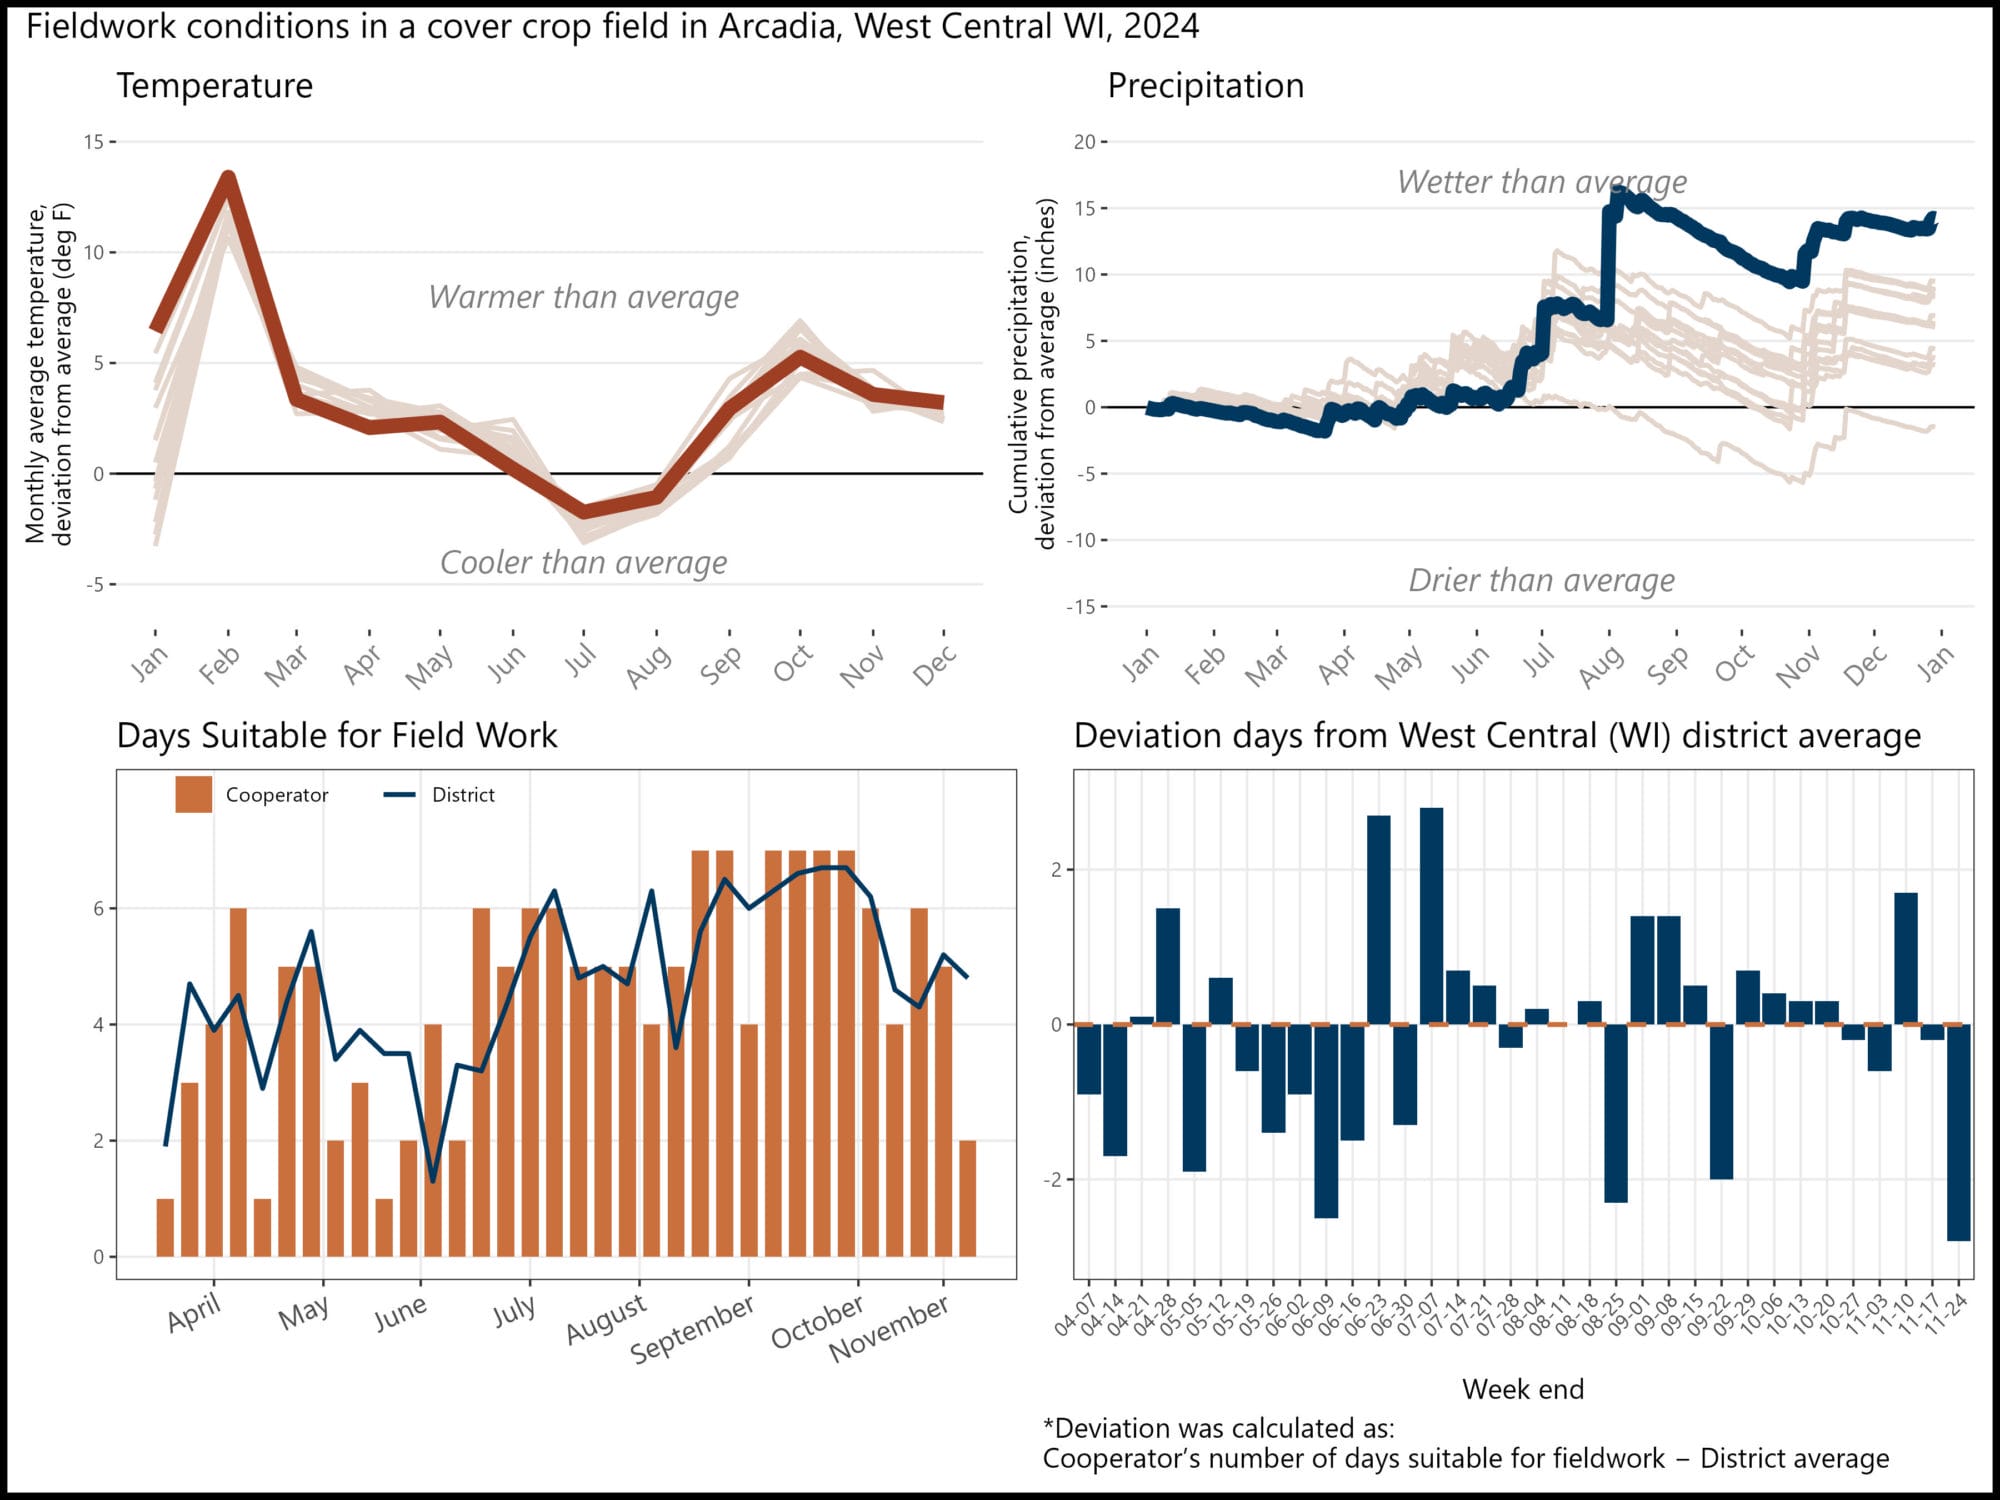
Appendix J. Kyle Nilsestuen; Arcadia, Wisconsin
In 50% of the weeks, Nilsestuen had more days suitable for fieldwork than the West Central district averages.
Field history:
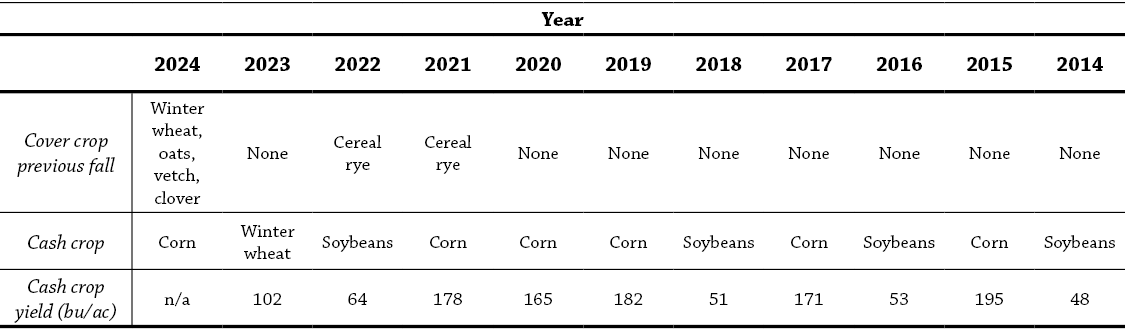
Appendix K. Neil Peterson; Fonda, Iowa
In 50% of the weeks, Peterson had more days suitable for fieldwork than the Northwest district averages.
Field history:
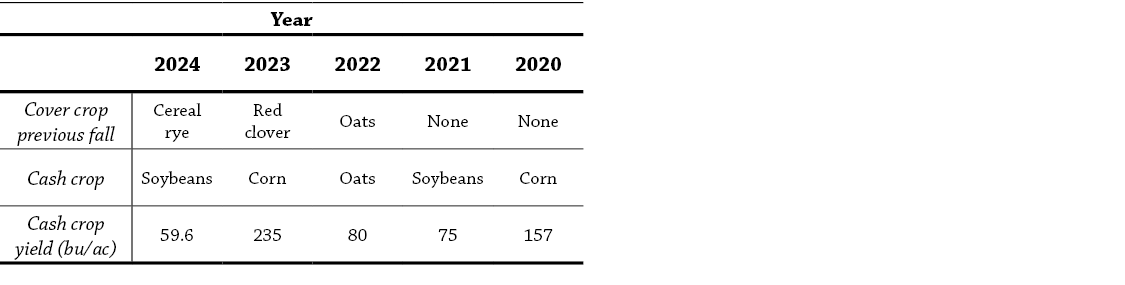 Appendix L. Max Pitt; Lamoni, Iowa
In 53% of the weeks, Pitt had more days suitable for fieldwork than the South Central district averages.
Field history:
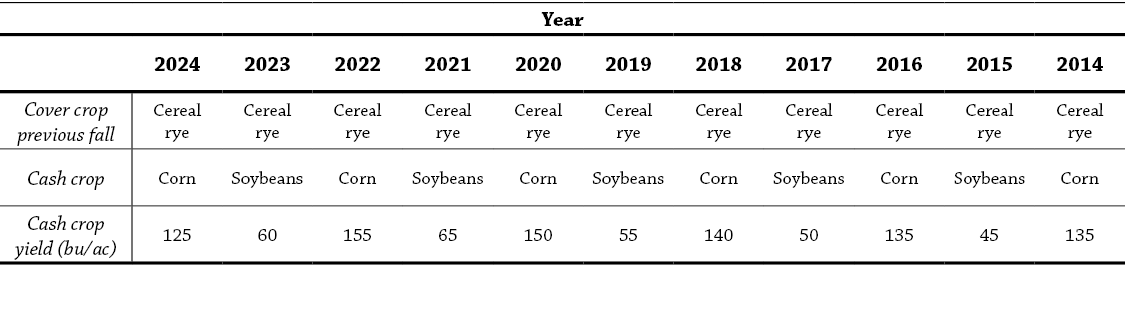
Appendix M. Joe Rowe; Manly, Iowa
In 44% of the weeks, Rowe had more days suitable for fieldwork than the North Central district averages.
Field history:
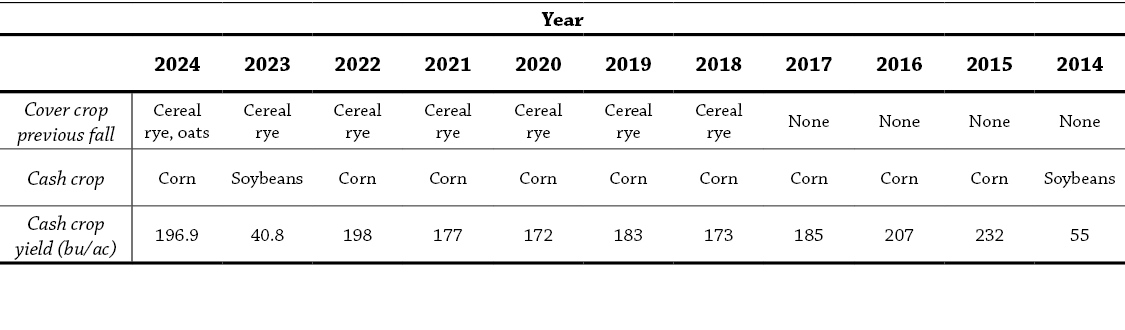 Appendix N. Phil Schwantz; Altura, Minnesota
In 44% of the weeks, Schwantz had more days suitable for fieldwork than the Minnesota state averages.
Field history:
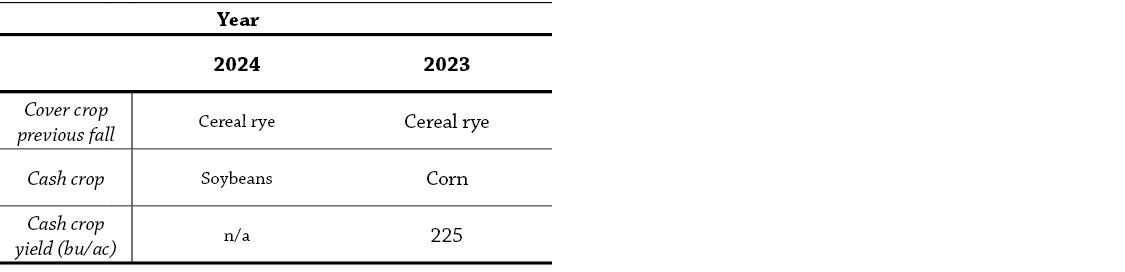
Appendix O. Bob Sullivan; Woodbine, Iowa
In 44% of the weeks, Sullivan had more days suitable for fieldwork than the West Central district averages.
Field history:
Appendix P. Detailed Methods
Weather data
Each cooperator chose a US Census-recognized town with which to associate their trial. The latitude and longitude of the chosen town were used to retrieve weather data from the National Aeronautics and Space Administration (NASA) Prediction of Worldwide Energy Resources (POWER) project using the nasapower package [12] for R software [13]. Data was downloaded for the period spanning January 1, 1994 through December 31, 2024. Two weather variables were used: (1) cumulative daily precipitation values and (2) the average daily air temperature at two meters above ground level. The weather data was separated into two data sets: one comprising the entire 30 years of data (historical weather data), and one containing only data from January 1 – December 31, 2024 (trial year data).
To provide context for each trial’s temperatures, the historical mean temperature for month at a given site was calculated using the historical weather dataset. The historical value was subtracted from the trial year average temperature for that month to provide an estimate of the deviation from average conditions.
References
[1] “USDA – National Agricultural Statistics Service – Publications – National Crop Progress – Terms and Definitions.” Accessed: Apr. 09, 2025. [Online]. Available: https://www.nass.usda.gov/Publications/National_Crop_Progress/Terms_and_Definitions/index.php#days
[2] W. Edwards and M. Hanna, “Days Suitable for Fieldwork in Iowa,” Iowa State Univ. Ext., 2020, [Online]. Available: https://www.extension.iastate.edu/agdm/crops/pdf/a3-25.pdf
[3] A. Johanns, “Days Suitable for Fieldwork in Iowa,” Iowa State Univ. Ext., 2025, [Online]. Available: extension.iastate.edu/agdm store.extension.iastate.edu
[4] S. Won, R. M. Rejesus, B. K. Goodwin, and S. Aglasan, “Understanding the effect of cover crop use on prevented planting losses,” Am. J. Agric. Econ., vol. 106, no. 2, pp. 659–683, 2024, doi: 10.1111/ajae.12396.
[5] S. Aglasan, R. M. Rejesus, S. Hagen, and W. Salas, “Cover crops, crop insurance losses, and resilience to extreme weather events,” Am. J. Agric. Econ., p. ajae.12431, Oct. 2023, doi: 10.1111/ajae.12431.
[6] “USDA – National Agricultural Statistics Service – Iowa – Crop Progress and Condition.” Accessed: Apr. 10, 2025. [Online]. Available: https://www.nass.usda.gov/Statistics_by_State/Iowa/Publications/Crop_Progress_&_Condition/index.php
[7] “USDA – National Agricultural Statistics Service – Minnesota – Crop Progress and Condition Reports.” Accessed: Apr. 10, 2025. [Online]. Available: https://www.nass.usda.gov/Statistics_by_State/Minnesota/Publications/Crop_Progress_&_Condition/index.php
[8] “USDA – National Agricultural Statistics Service – Wisconsin – Crop Progress and Condition Report.” Accessed: Apr. 10, 2025. [Online]. Available: https://www.nass.usda.gov/Statistics_by_State/Wisconsin/Publications/Crop_Progress_&_Condition/index.php
[9] T. Vilsack, “2022 Census of Agriculture United States Summary and State Data,” United States Department of Agriculture National Agriculture Statistics Service, AC-22-A-51, Feb. 2024. [Online]. Available: https://www.nass.usda.gov/Publications/AgCensus/2022/index.php
[10] B. Gleason, “2017-2023 Nutrient Reduction Survey Results,” Iowa Nutrient Research + Education Council. Accessed: Apr. 15, 2025. [Online]. Available: https://iowanrec.org/2017-2023-nutrient-reduction-survey-results/
[11] G. E. Roesch-McNally et al., “The trouble with cover crops: Farmers’ experiences with overcoming barriers to adoption,” Renew. Agric. Food Syst., vol. 33, no. 4, pp. 322–333, Aug. 2018, doi: 10.1017/S1742170517000096.
[12] A. H. Sparks, “nasapower: A NASA POWER Global Meteorology, Surface Solar Energy and Climatology Data Client for R,” J. Open Source Softw., vol. 3, no. 30, p. 1035, Oct. 2018, doi: 10.21105/joss.01035.
[13] R Core Team, “R: A language and environment for statistical computing.” R Foundation for Statistical Computing, Vienna, Austria, 2022. Accessed: Mar. 28, 2024. [Online]. Available: https://www.r-project.org/