In a Nutshell:
- Jack Boyer has been planting a cereal rye cover crop in a corn-soybean rotation on his farm for six years. Because Boyer knows that a cover crop can improve soils, he was curious if the N fertilizer rate he applies to corn could be reduced due to several years of repeated cover crop use. He compared his typical N rate (180 lb N/ac) with a reduced rate (130 lb N/ac).
- Boyer hypothesized that corn yields would be comparable between the two N fertilizer rates; as such, reducing the N rate would be more profitable due to lowered input costs.
Key Findings:
- Cornstalk nitrate concentration – which can indicate if the corn had a sufficient supply of N during the season – was not affected by N fertilizer rate.
- Boyer recorded equal corn yields between the reduced and typical N rates.
- Reducing the N rate by 50 lb N/ac improved Boyer’s returns by $26/ac.

Jack Boyer: “This trial was worthwhile because it showed I was able to reduce N input without reducing yield.”
Methods
DesignBoyer planted corn on Apr. 23, 2019 at a population of 35,000 seeds/ac to a field that was planted to soybeans in 2018. Following soybean harvest in the previous fall, Boyer seeded a cereal rye cover crop to the field at a rate of 50 lb/ac on Oct. 23, 2018. He terminated the cover crop and controlled early-season weeds on May 4 with atrazine (0.25 lb/ac), Outlook (14 oz/ac), Durango (48 oz/ac) and Liberty (1 qt/ac). Boyer performed another weed control pass with Zaar (16 oz/ac) and Impact (9.5 oz/ac) on June 13. To test whether he could reduce his N fertilizer rate, Boyer compared two treatments:
- 130 lb N/ac (reduced rate);
- 180 lb N/ac (typical rate).
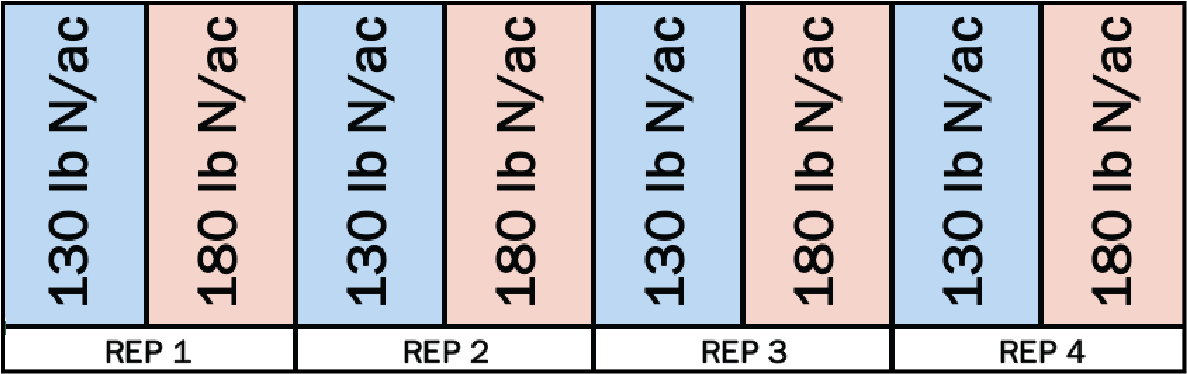
Boyer implemented four replications of the two treatments in strips that measured 30 ft wide and 1,570 ft long (Figure A1). He applied 100 lb N/ac as anhydrous ammonia on Apr. 16 and 30 lb N/ac as UAN(28%) on May 4 to all strips. Boyer then applied 50 lb N/ac as sidedress on June 14 but only to the strips assigned to his typical N rate. Measurements On June 12, we collected soil samples to a 12-in. depth from several areas in the field. We sent these samples to Ag Source Laboratories (Ellsworth, IA) to determine the availability of soil nitrate to corn prior to Boyer sidedressing the strips receiving the typical N rate. This is commonly known as the late-spring soil nitrate test (LSNT).[1] Theo Gunther, from the Iowa Soybean Association, collected cornstalk samples from each strip on Oct. 4 and sent the samples to Midwest Labs (Omaha, NE). The lab determined the concentration of nitrate in the stalks – this can be an indicator of sufficient, insufficient or excessive availability of N to the corn during the growing season.[2] On Oct. 26, Boyer harvested the corn and recorded yields from each individual strip. Data analysis To evaluate any effects of N rate, we calculated the least significant difference (LSD) at the 95% confidence level using a t-test for each measurement: cornstalk nitrate concentration and corn yield. For each measurement, if the difference resulting from the two N rate treatments was greater than the LSD, we would expect such a difference to occur 95 times out of 100 – we refer to this as a statistically significant effect. On the other hand, if the difference resulting from the two N rate treatments was less than the LSD, we consider the results to be statistically similar. We could make these statistical calculations because Boyer’s experimental design involved replication of the two treatments (Figure A1).
Results and Discussion
Late-spring soil nitrate test
Soil samples collected on June 12 revealed that Boyer’s field had an average nitrate-N concentration of 17 ppm. This test result would suggest the application of 64 lb N/ac as sidedress to Boyer’s corn. We used this test result purely as a reference – Boyer did not sidedress any N to the reduced rate treatment and he sidedressed 50 lb N/ac to the typical rate treatment per the design of this trial.
Cornstalk nitrate concentration
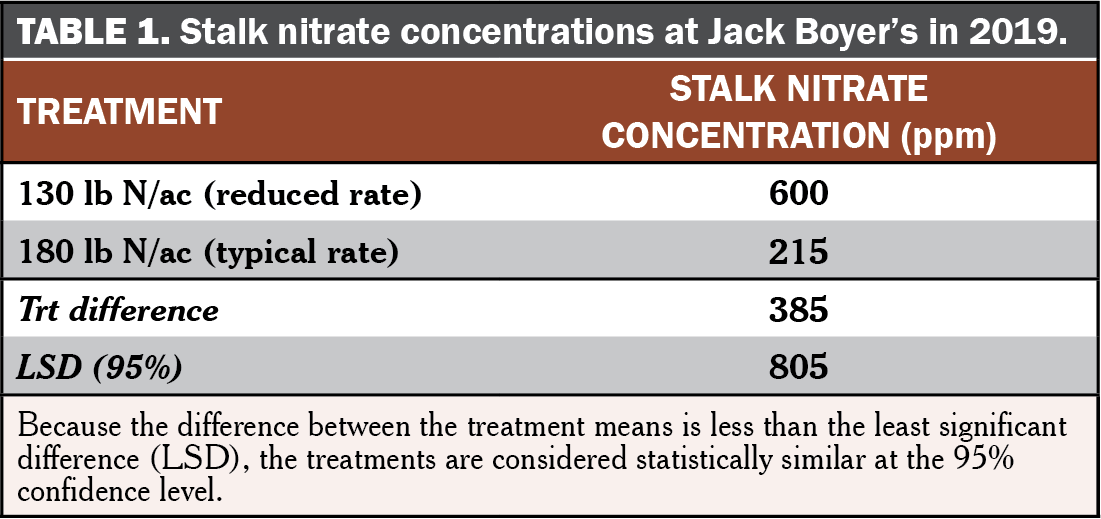
N fertilizer rate had no statistical effect on stalk nitrate concentrations (Table 1). Across the two N rates, the average stalk nitrate concentration was 408 ppm. This value suggests that Boyer’s corn (regardless of N rate) had access to the minimal amount of N necessary for maximum yield potential, according to ISU Extension and Outreach.[2]
 Corn yield and economic returns
Corn yield was not affected by N fertilizer rate (Figure 1). Recall that the results of the LSNT mentioned before recommended a sidedress application of 64 lb N/ac to Boyer’s corn in June. As such, we might have expected the sidedress application of 50 lb N/ac as part of Boyer’s typical rate (180 lb N/ac) to increase yield compared to the reduced rate (130 lb N/ac). But this was not the case in this trial as corn yields were statistically similar between the two N fertilizer rates.
Corn yield and economic returns
Corn yield was not affected by N fertilizer rate (Figure 1). Recall that the results of the LSNT mentioned before recommended a sidedress application of 64 lb N/ac to Boyer’s corn in June. As such, we might have expected the sidedress application of 50 lb N/ac as part of Boyer’s typical rate (180 lb N/ac) to increase yield compared to the reduced rate (130 lb N/ac). But this was not the case in this trial as corn yields were statistically similar between the two N fertilizer rates.

Conclusions and Next Steps
Boyer conducted this study because he was curious about opportunities to reduce input costs and either maintain or improve profitability. Just as Boyer had suspected, he was able to maintain corn yields while reducing his N fertilizer rate by 50 lb N/ac. In this case, applying 130 compared to 180 lb N/ac reduced Boyer’s costs by $26/ac, and without any loss in corn yield, those reduced costs directly translated to $26/ac in improved economic returns. Boyer has been using a cereal rye cover crop in his corn-soybean rotation because he knows this practice is beneficial to the soil and reduces loss of nutrients, like N, to the environment. After six years of using a cereal rye cover crop and capturing those environmental benefits on his family’s farm, it now appears that he is also capturing economic benefits as well owing to reduced N fertilizer costs. Encouraged by these results, Boyer wonders if he can further reduce his N fertilizer rate and improve returns.
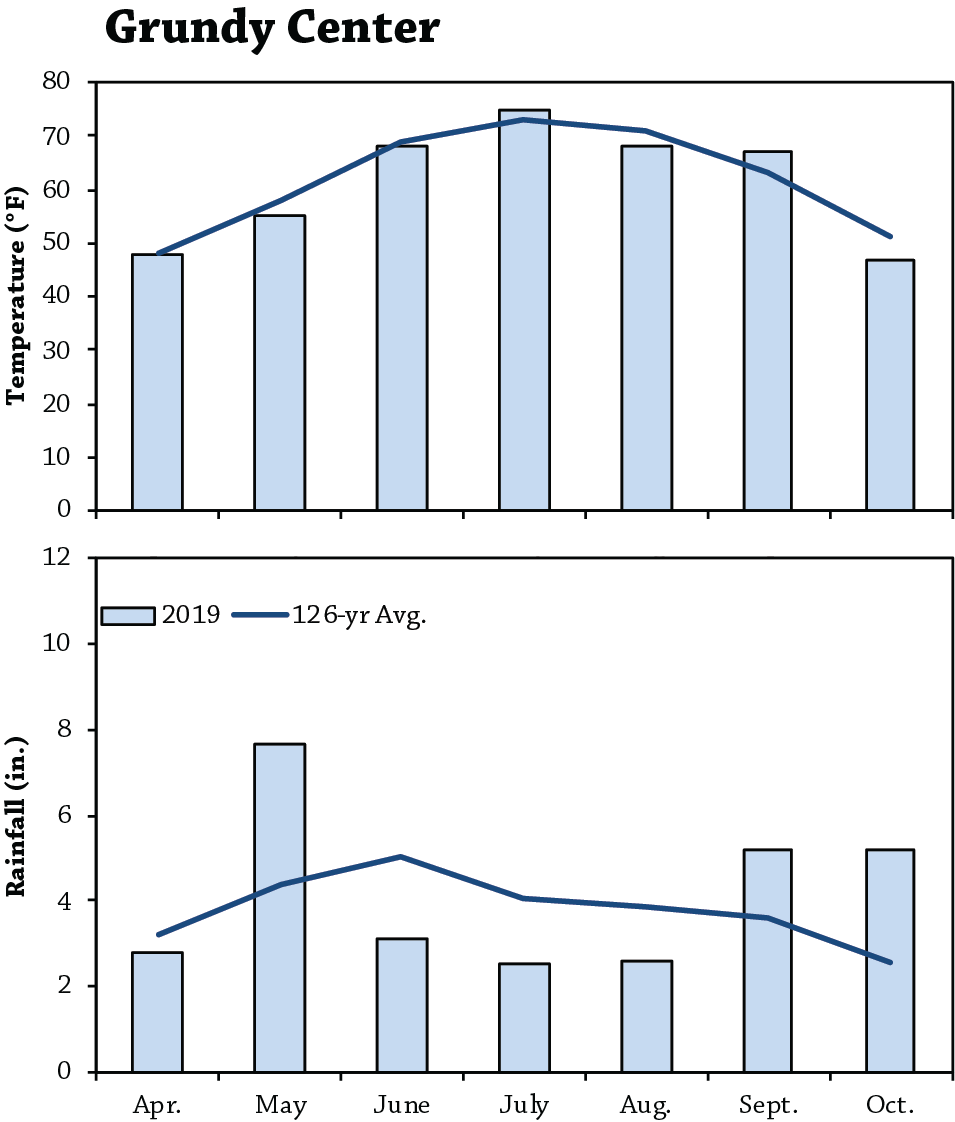
Appendix - Trial Design and Weather Conditions
Funding Acknowledgement
This material is based upon work supported by the Natural Resources Conservation Service, U.S. Department of Agriculture, under number 68-6114-17-010. Any opinions, findings, conclusions, or recommendations expressed in this publication are those of the author(s) and do not necessarily reflect the views of the U.S. Department of Agriculture.
References
- Sawyer, J.E. and A.P. Mallarino. 2017. Use of the Late-Spring Soil Nitrate Test in Iowa Corn Production. CROP 3140 Iowa State University Extension and Outreach. https://store.extension.iastate.edu/Product/5259 (accessed October 2019).
- Sawyer, J. and A.P. Mallarino. 2018. Cornstalk Testing to Evaluate Nitrogen Management. PM 1584. Iowa State University Extension and Outreach. https://store.extension.iastate.edu/product/Use-of-the-End-of-Season-Corn-Stalk-Nitrate-Test-in-Iowa-Corn-Production (accessed October 2019).
- Plastina, A., A. Johanns and G. Wynne. 2019. 2019 Iowa Farm Custom Rate Survey. Ag Decision Maker. Iowa State University Extension and Outreach. https://store.extension.iastate.edu/product/2019-Iowa-Farm-Custom-Rate-Survey (accessed November 2019).
- Iowa Environmental Mesonet. 2019. Climodat Reports. Iowa State University. http://mesonet.agron.iastate.edu/climodat/ (accessed November 2019).