In a Nutshell:
- The practice of cover crop grazing provides economic returns, and farmers wonder if benefits to soil health follow suit. Economic returns are realized within a year’s time, while soil health impacts seemingly are slower to manifest.
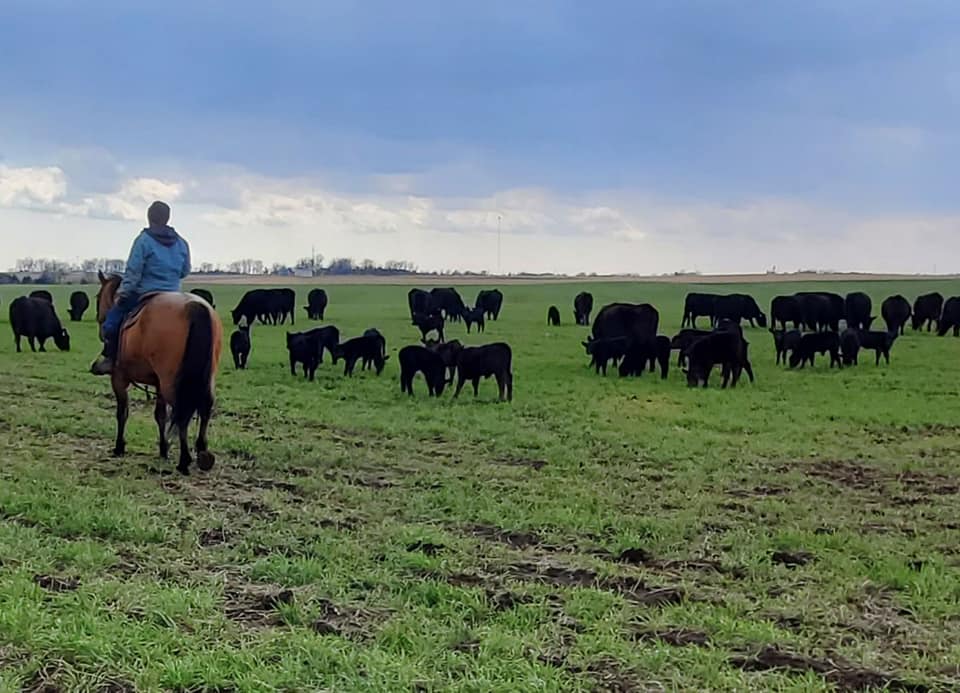
- Six cooperators, each integrated cattle-crop farmers, grazed cover crops in the fall, winter and/or spring. In order to determine the economic and soil health impact of grazing cover crops, the cooperators kept cover crop and grazing records and had their soil sampled in May 2019.
Key Findings:
- Each cooperator profited from grazing cover crops within the year of planting. Profits averaged $76.48/ac. Profits varied due to cover crop and grazing management.
- Soil samples from May 2019 show no detectable trends in soil health indicators among farms.
- Grazing cover crops continues to be a way to achieve short-term economic benefits in integrated crop and livestock systems. More data is needed to show relationships between cover crop grazing and soil health.
Background
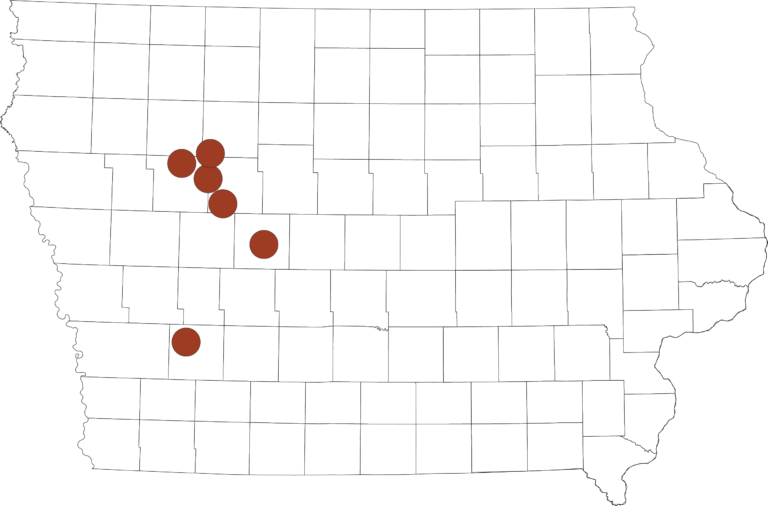
This report describes the economic and soil health impacts six cooperators experienced in grazed cover crop systems from 2018-2019. Evidence has been mounting around the profits that can be achieved when livestock graze cover crops.[1,2] It is known that grazing cover crops can provide benefits to soil health, but the effects are longer term [1] and require proper grazing management. This research project is currently being conducted by cooperators in western Iowa: Perry Corey, Wesley Degner, Bill Frederick, Zak Kennedy, Seth Smith and Mark Schleisman. The project, funded by the Iowa Department of Agriculture and Land Stewardship (IDALS) began in 2015 strictly to quantify economic impacts from grazing cover crops.[2] In 2019, soil health sampling was added to data collection. Data will continue to be collected through 2021.
Methods
DesignIn summer and fall of 2018, farmers seeded cover crops of their choosing with the intention of grazing the forage produced. In order to determine the effects on economics and soil health on cover crop and grazing management, each cooperator established three treatment fields:
- Cover crops with no grazing
- Grazed cover crops
- No cover crops with no grazing
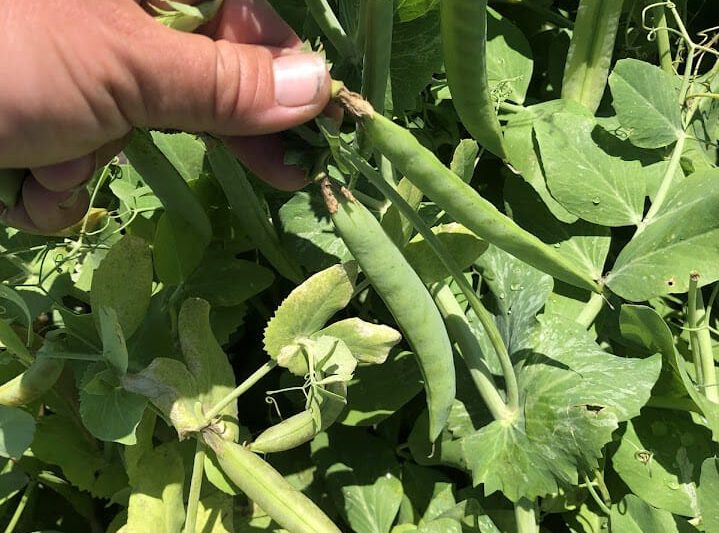
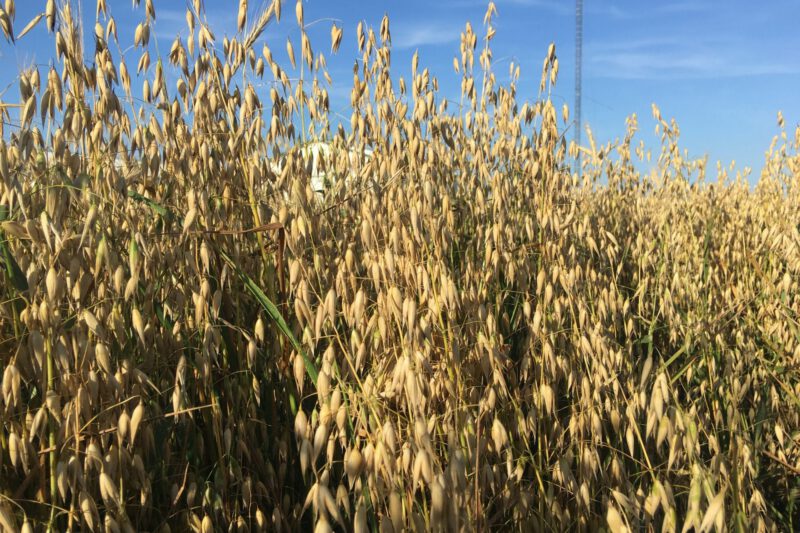
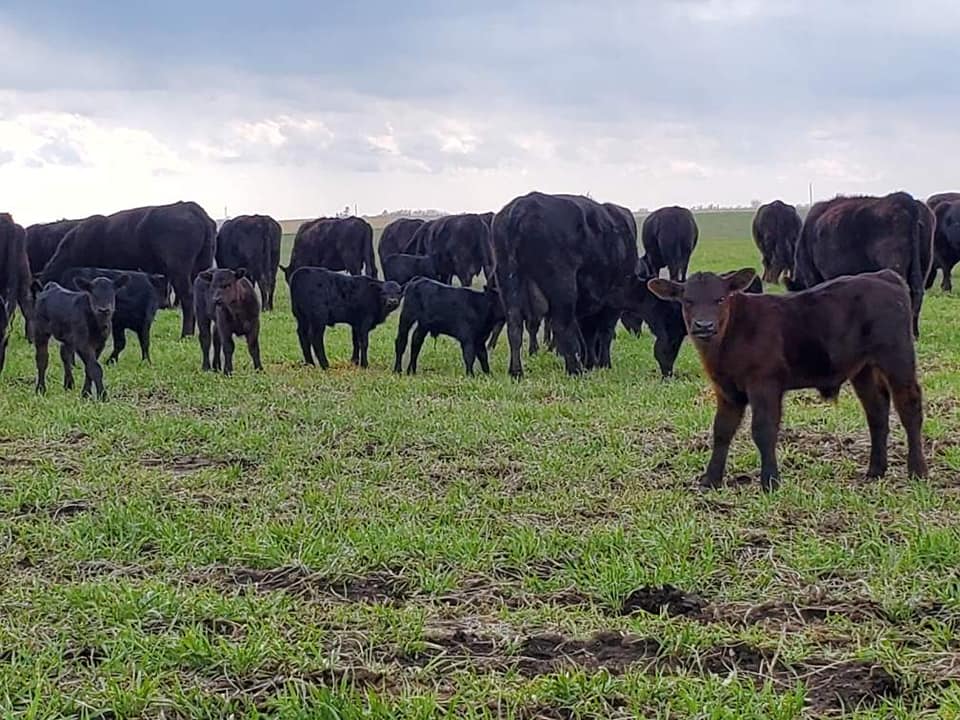
All farms were in corn-soybean rotations, with the exception of two of Frederick’s fields, which were in corn-soybean-triticale rotations. Cover crops ranged among farmers, but each cooperator used cereal rye. Some cooperators added additional species such as rapeseed, cowpeas, radish, turnip, oats, triticale and wheat. Frederick’s mix seeded after July triticale harvest included millet, turnip, radish, sorghum sudangrass, forage kale, vetch, flax, crimson clover, sunn hemp and peas.
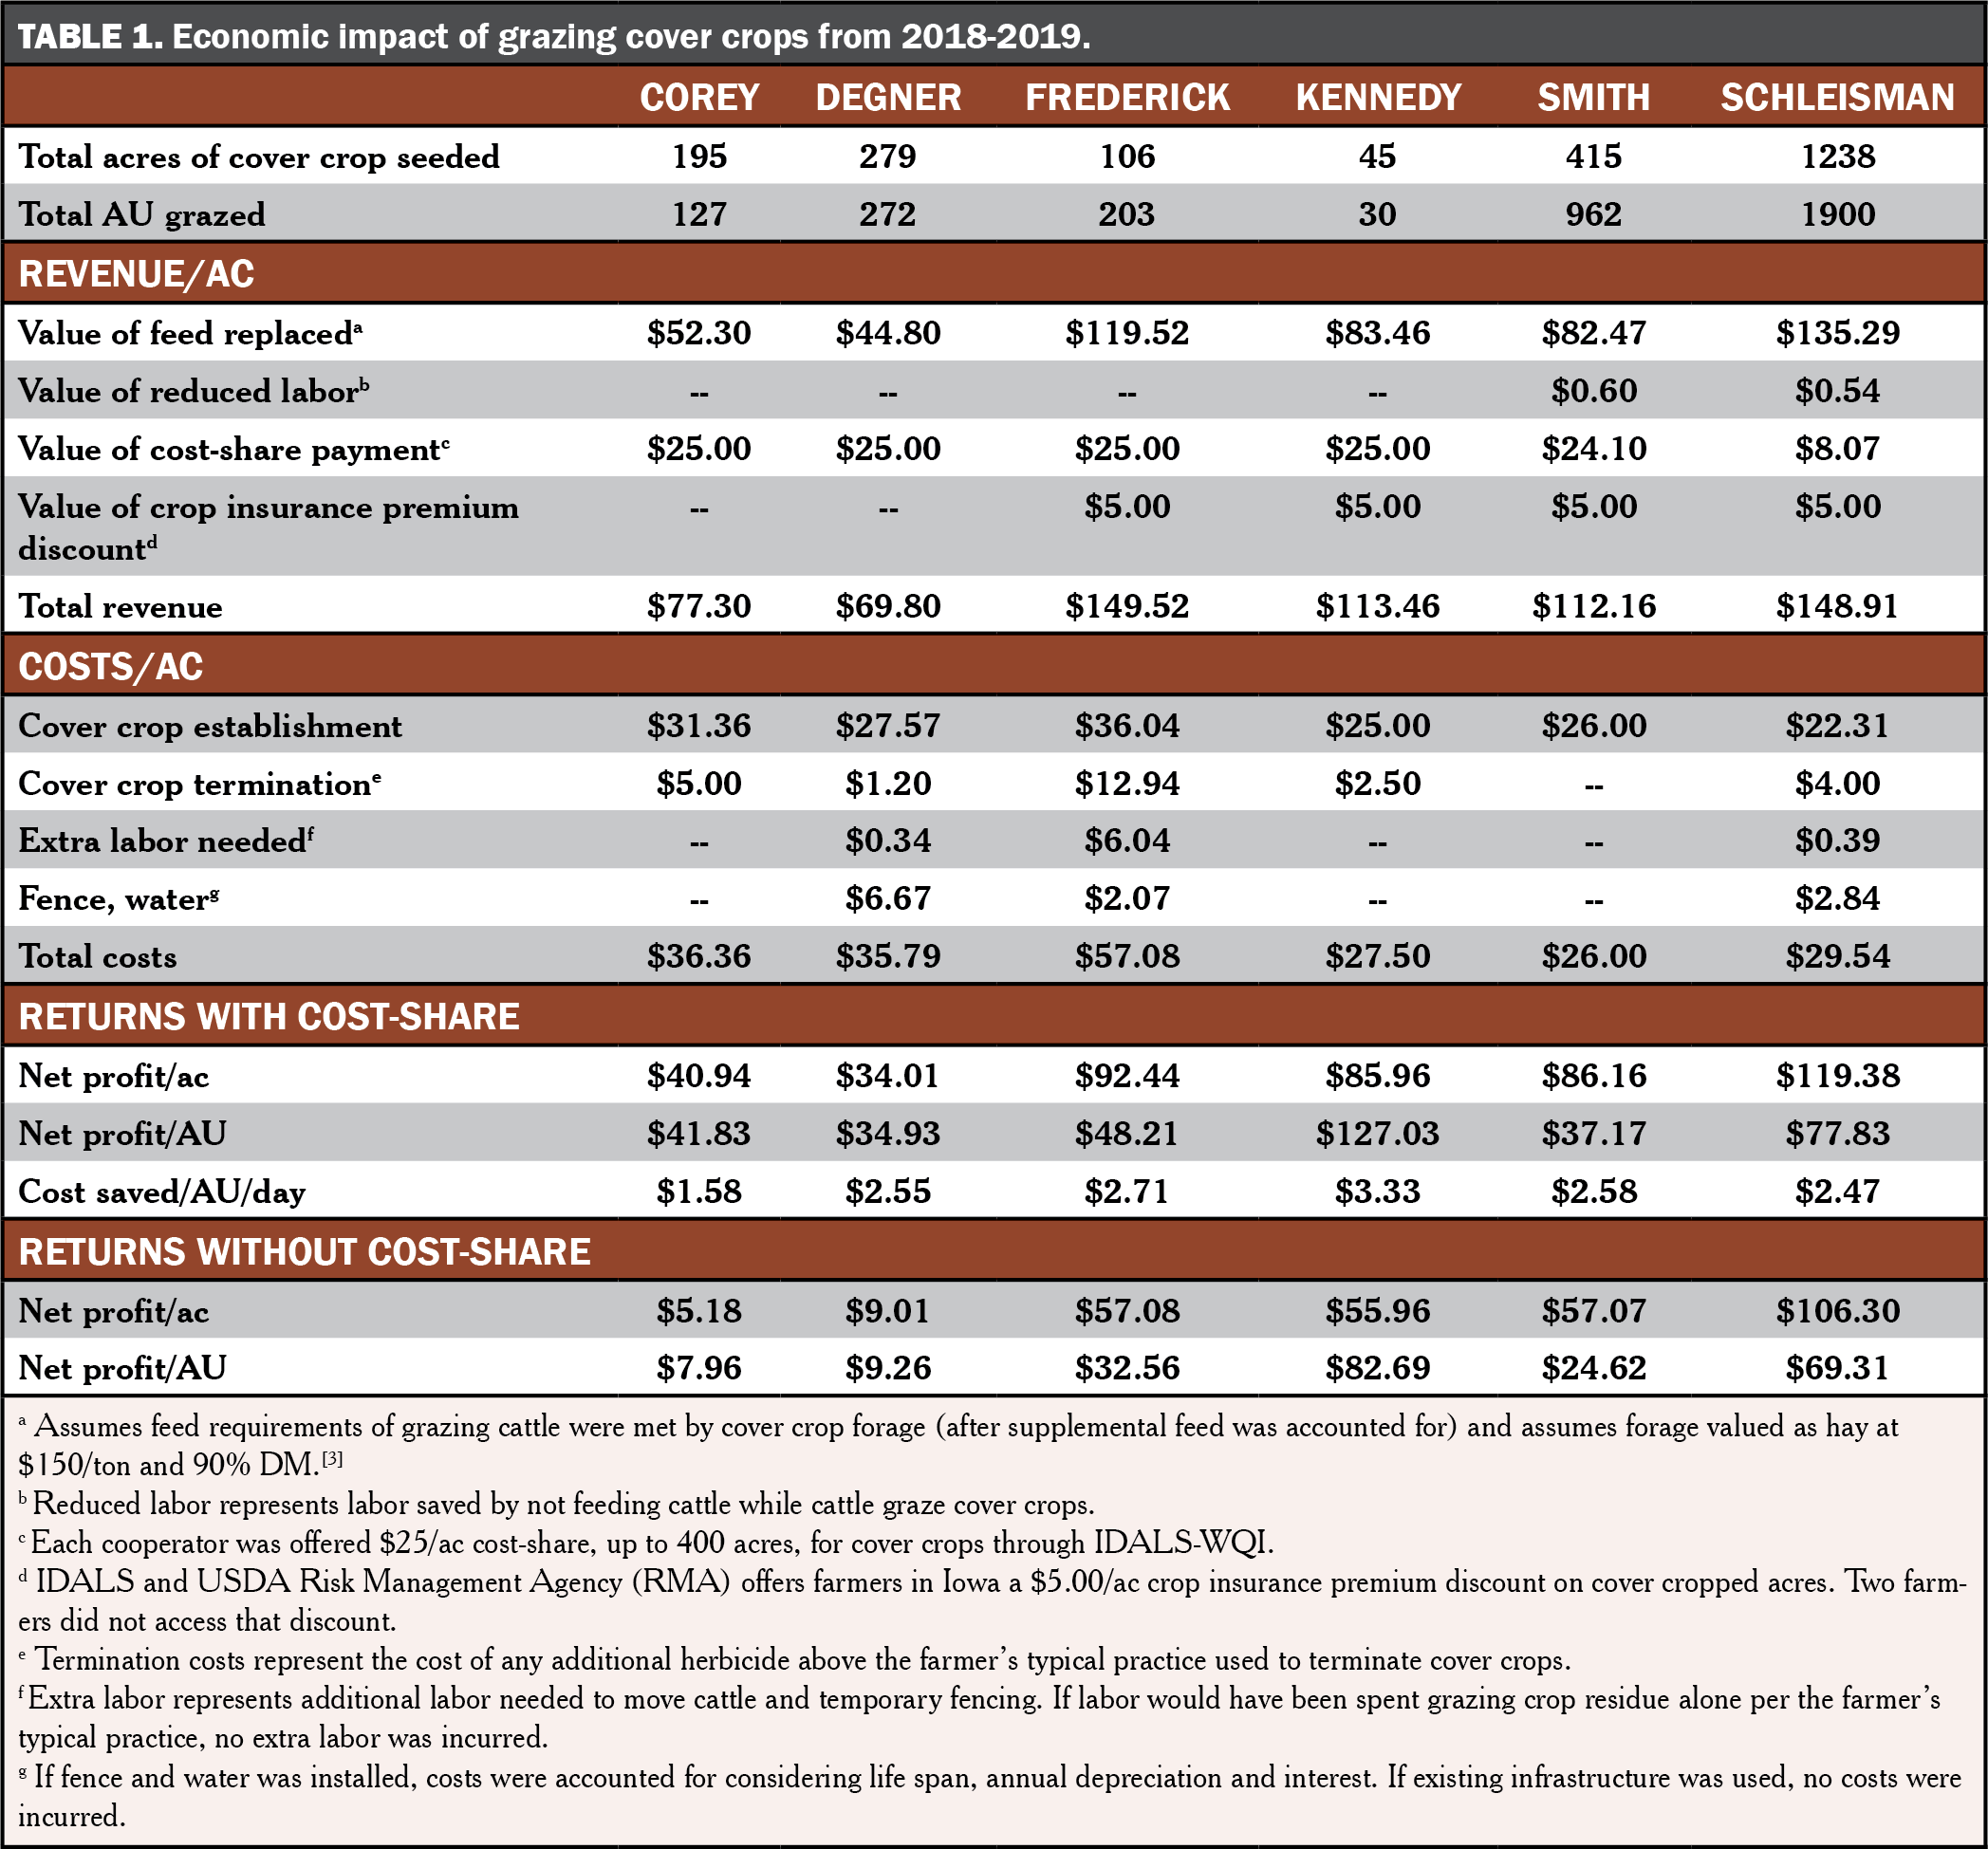
EconomicsEach cooperator recorded cover crop expenses and grazing data in their grazed cover crops field, which were used to estimate the forage value of cover crops on each farm using ISU’s Ag Decision Maker Economics of Cover Crops tool.[3] This tool takes into account revenue and costs associated with cover crop grazing. Revenue includes the value of feed replaced by grazing, cost-share payments received, crop insurance discounts and reduced labor due to grazing instead of feeding stored feed. Expenses include costs for establishing cover crops, additional herbicide and labor needed for cover crop termination, additional labor required, fence and water infrastructure.
The value of feed replaced by grazing assumes cattle would have been fed hay valued at $150/ton if cover crops were not available to graze. The tool takes into account number of cattle grazed, average weight of livestock, number of grazing days and cooperator estimates of dietary needs provided by supplemental feed and crop residue. The tool assumes cattle consume 4% of their bodyweight in forage dry matter (DM) each day (2.5 to 3.0% intake, 0.5% trampling loss and 0.5-1.0% buffer).[4] All formulas are nested within the tool.
Net profit is reported on a per acre and a per animal unit (AU) basis. An animal unit is equal to 1,000 lb of animal. Net profit was calculated two ways – 1) including cost-share and crop insurance discounts and 2) without including cost-share or crop insurance discounts.
This economic analysis did not take into account effects on cash crop yield, soil retention value, nutrient retention value, soil health value, nutritional value of forage or animal weight gain.
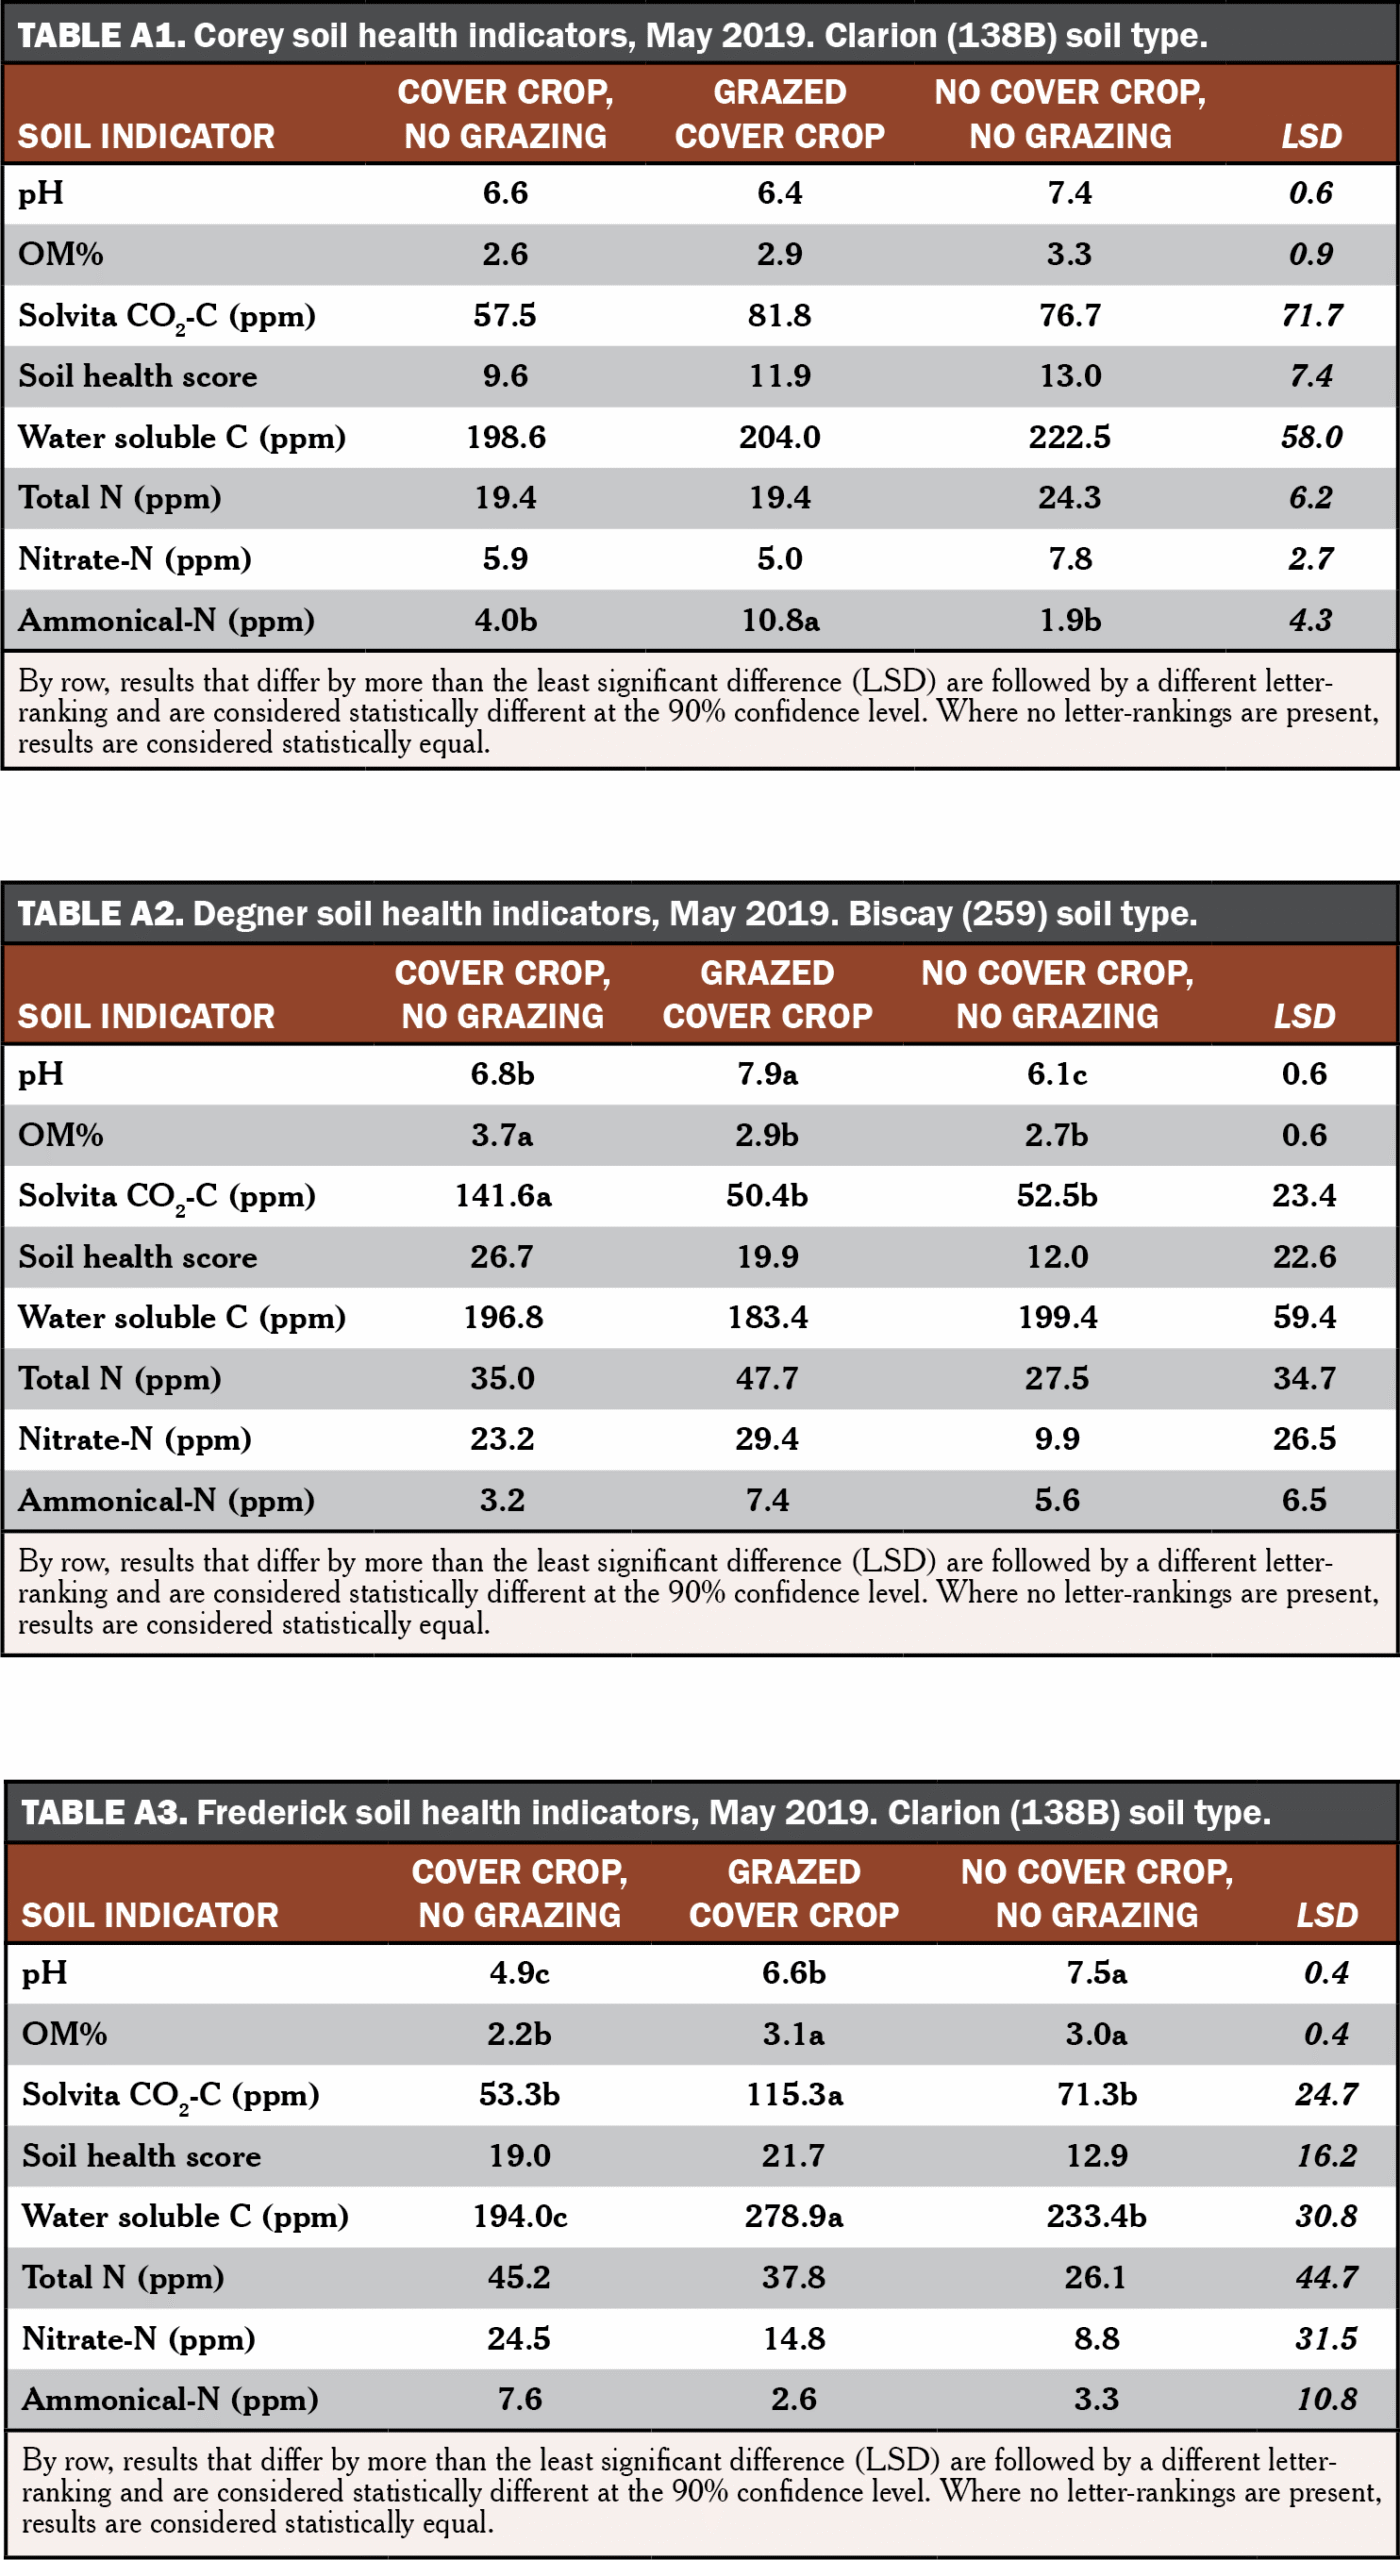
Soil samples were collected in all three treatment fields at each farm to a depth of 6 in. in May 2019. Three sampling sites were identified in each of the three fields representing different management practices: cover crops with no grazing, grazed cover crops and no cover crops with no grazing. Sample locations were marked by GPS and taken within the same soil type at each farm. Soil samples will continue to be collected in the same locations each year until 2021.
Samples were sent to AgSource Laboratories (Ellsworth, IA) to determine the burst of CO2-C following rewetting of dried soil using the Solvita assay. Other soil indicators measured included pH, organic matter (OM), soil health score, water soluble carbon (active C), total nitrogen (TN), nitrate-N and ammonical-N.
Soil data were analyzed using JMP Pro 13 (SAS Institute Inc., Cary, NC) statistical software. Means separations are reported using Tukey’s least significant difference (LSD). Statistical significance was determined at the 90% confidence level.
Results and Discussion
EconomicsResults from each of the six farms are presented in Table 1. On average, cover crop establishment cost cooperators $28.05/ac. Net profits from grazing averaged $76.48/ac. Without the assistance of cost-share and crop insurance discounts, net profits averaged $48.43/ac. Regardless of financial assistance, each cooperator scored positive profits from grazing cover crops within the same year of planting cover crops.
On an AU basis, cooperators profited, on average, $61.17/AU. For a 1,200 lb cow, this equates to $73.40/head. Without cost-share and crop insurance discounts, cooperators profited $37.73/AU.
Another way to summarize the forage value of cover crops is to calculate feed costs saved per AU per day when cattle graze cover crops. On average, cooperators saved $2.54/AU/day in feed expenses. This is an important finding considering winter feed costs represent the single largest cost in cattle operations.[5] Grazing cover crops can reduce winter feed costs.
Net profits ranged from $34.01 to $119.38/ac. This range is attributed to cover crop seeding rate and date, which varied across the farms and can affect the amount of cover crop forage produced. Other related factors contributing to the range in profits include varying grazing period lengths, number of cattle and particular costs of some practices at each farm.
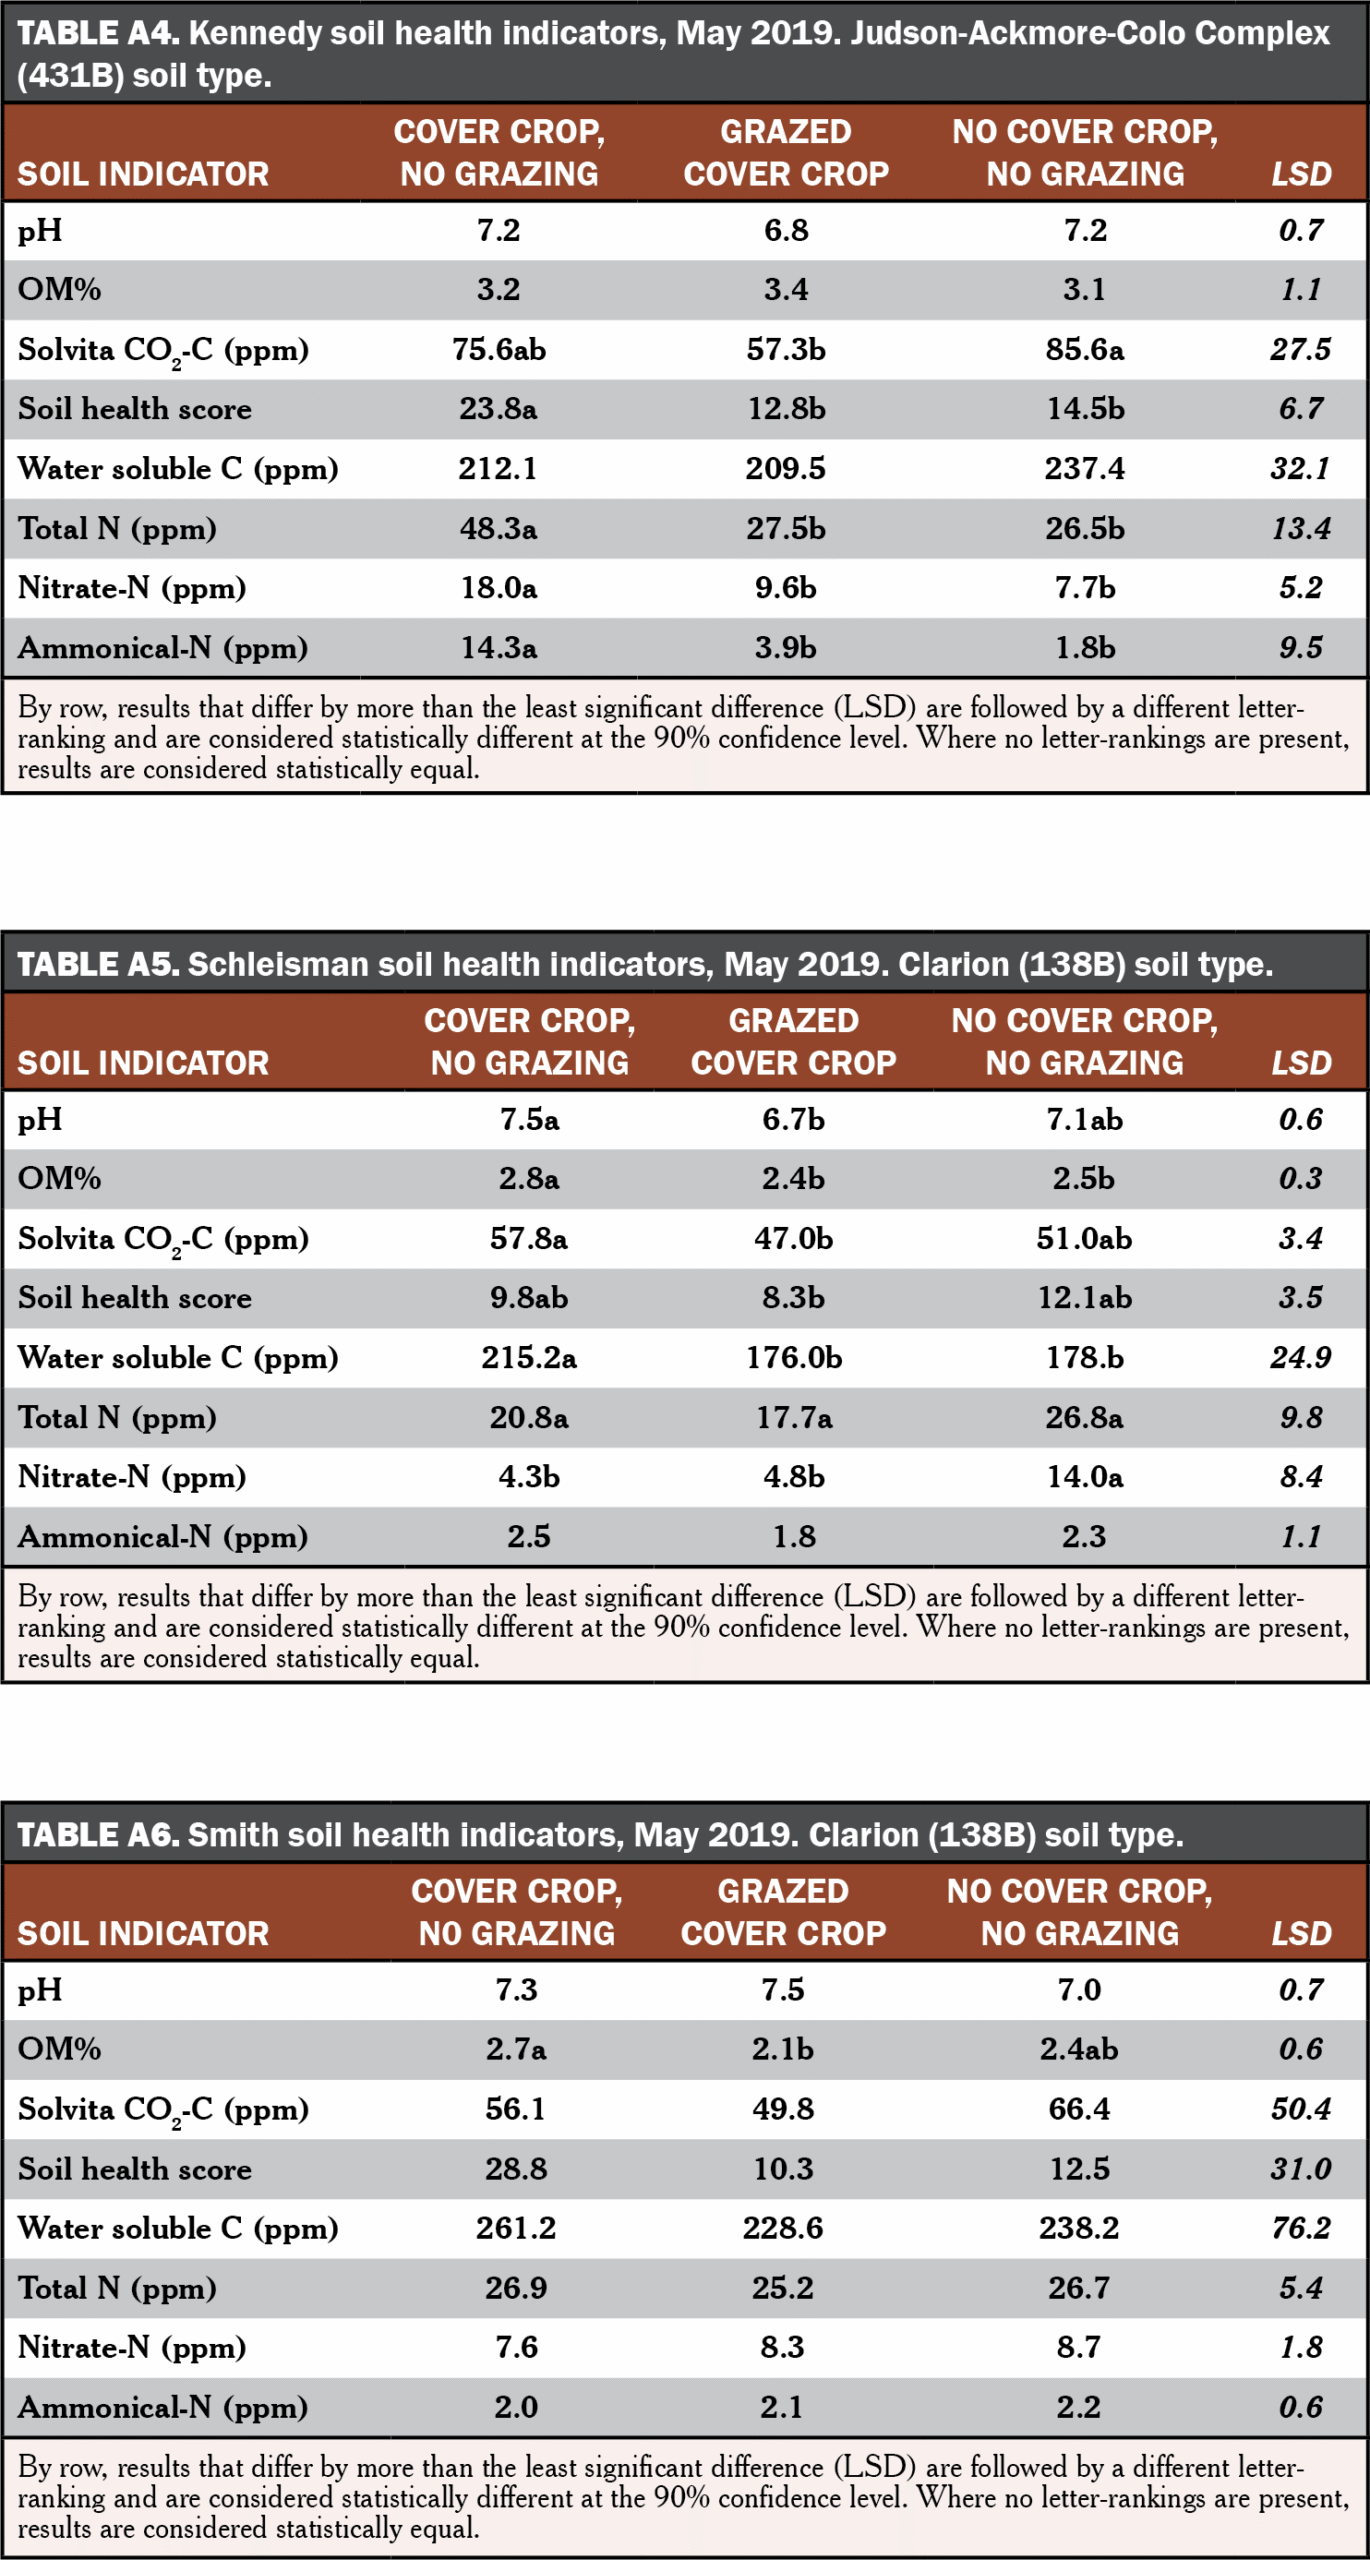
Results of May 2019 soil testing show no trends in soil health indicators among farms (Tables A1-A6). The Solvita assay determines soil microbial activity by measuring the amount of CO2-C respired over a 24-hour period from a dried soil sample that has been rewetted and held at an ideal temperature. At Corey’s (Table A1) and Smith’s (Table A6), all three treatment fields showed statistically equal CO2-C burst. At Degner’s (Table A2) and Schleisman’s (Table A5), the cover crop field had a significantly higher CO2-C burst than both the grazed cover crop and no cover crop, no grazing fields. At Frederick’s (Table A3), the grazed cover crop field had a significantly higher CO2-C burst than both the cover crop and no cover crop, no grazing fields. At Kennedy’s (Table A4), the no cover crop, no grazing field had a significantly higher CO2-C burst than the grazed cover crop field, and was not different from the cover crop field. Therefore, no single management practice showed consistent trends in microbial activity across farms. The same can be said for many of the other soil health indicators measured (Tables A1-A6).
The variability in the current dataset suggests more samples are likely needed to describe any potential relationships between management and soil health indicators. Soil will be sampled through 2021; this will result in a larger sample size from which we may be able to detect trends. Changes in soil health are expected to be slow and may take years to show measurable differences; academic research does provide evidence for livestock integration in cropping systems stimulating soil biology.[6]
Conclusion and Next Steps
The economic results from this project strengthen the case that grazing cover crops provides short-term economic benefits and pay off in one year. Kennedy found he did not have to feed any hay over a 37-day period while his cattle grazed a rye cover crop from April 14 to May 21, 2019 and stated, “If a farmer can incorporate livestock into cover crops, it’s hard to deny it works.”
Preliminary soil health results indicate the soil health impact of grazing cover crops may take more time to realize. All cooperators will continue to plant and graze cover crops in order to reap annual profits, while research continues to assess long-term soil health impacts.
Appendix
References
- Myers, R., Weber, A., S. Tellatin. 2019. Cover Crop Economics. SARE Technical Bulletin. https://www.sare.org/Learning-Center/Bulletins/Cover-Crop-Economics (accessed April 2020).
- Filbert, M. 2017. Livestock Economic Impact of Grazing Cover Crops in Cow-Calf Operations. Practical Farmers of Iowa Cooperators’ Program. https://practicalfarmers.org/research/economic-impact-of-grazing-cover-crops-in-cow-calf-operations/ (accessed April 2020).
- Edwards, E., Plastina, A., and M. Filbert. 2018. Economics of Cover Crops. Iowa State University Ag Decision Maker. https://www.extension.iastate.edu/agdm/crops/html/a1-91.html (accessed April 2020).
- NRCS. 2009. Balancing your Animals with your Forage. USDA. 2–5. https://www.nrcs.usda.gov/Internet/FSE_DOCUMENTS/stelprdb1097070.pdf (accessed April 2020).
- Boetel, B. 2017. In Th e Cattle Markets: Cost of Wintering Cattle. Drovers. https://www.drovers.com/article/cattle-markets-cost-wintering-cattle (accessed April 2020).
- Franzluebbers, A.J. and J.A. Stuedemann. 2015. Does grazing of cover crops impact biologically active soil carbon and nitrogen fractions under inversion or no tillage management? Journal of Soil and Water Conservation. 70(6):365–373.