Funding provided by PepsiCo.
In a Nutshell:
- Thirty-eight farmers identified one field on their farm with a history of cover cropping and recorded, throughout the growing season, which days were suitable for fieldwork.
- According to the USDA definition, a suitable day is one in which weather and field conditions allow producers to work in the field a major portion of the day; farmers recorded their observations based on this definition.
- Most farms have routinely used cover crops in the past years, with the majority planting cereal rye in the fall, while some incorporated multi-species cover crop mixtures.
Key Findings:
- Nearly all sites experienced a warm start to the growing season, followed by wetter-than-average conditions toward the end.
- Farmers and district/state estimates reported nearly identical total days suitable for fieldwork (~130 days) in 2025.
- During the spring season (April-mid June), farmers reported approximately one additional day suitable for fieldwork relative to district or state averages.
Background
The second year of this project continues to evaluate whether cover crops can increase the number of days suitable for fieldwork across Midwest farms. The USDA defines a ‘suitable’ day as one where weather and field conditions allowed producers to work in fields a major portion of that day [1]. Long-term trends in Iowa indicate that the window for completing spring fieldwork has narrowed considerably over the past 60 years, resulting in fewer suitable fieldwork days [2]. Since 1964, the trend shows a loss of one full suitable day every six years [3]. This decline is largely attributed to increased precipitation variability, particularly in the spring and fall, which coincide with critical periods for field operations in grain production systems.
In this context, practices that improve soil structure and resilience – like cover cropping – become more important. For several years, PFI has been receiving stories and anecdotes from farmers that they are getting into their fields earlier than their neighbors in the spring and not leaving ruts in the field when harvesting in the fall. These farmers attribute this to their use of cover crops. As noted by cooperator Josh Hiemstra at the onset of this project, “I am convinced of this practice. However, many other producers are skeptical and hesitant to incorporate cover crops. The goal is to show others it will make a positive impact on their own operation.” Additionally, recent studies have illustrated that cover crops can reduce crop insurance claims and losses from prevented planting caused by excess spring moisture [4], [5].
The project expanded from 15 trials in 2024 to 38 trials in 2025 across Iowa and neighboring Midwestern states, substantially increasing the dataset and enabling more robust comparisons between fields with and without cover crops. Because cover crops are still used on a relatively small proportion of acres, weekly district-level averages reported by the USDA primarily reflect non-cover cropped fields and therefore serve as a practical benchmark for comparison. Within this framework, cooperating farmers recorded the number of days each week they considered suitable for fieldwork throughout the growing season in fields managed with cover crops.
If cover crops are shown to increase – or even maintain – days suitable for fieldwork relative to the UDSA district averages, this represents a practical and compelling outcome for producers. When asked how the results of this project might influence future management decisions, cooperator Fred Abels stated, “It helps justify to neighbors who don’t think it’s worth the time or money to use cover crops.”
Methods
Design
Cooperating farms were located across Iowa, Minnesota, Nebraska, and Wisconsin. Farmers were responsible for identifying at least one field in their farm with a history of cover crops to monitor throughout the growing season.
Measurements
From April to November farmers completed a weekly survey to evaluate the field conditions of the previous seven days. The general questions on the survey were:
- This past week, what field activities were you trying to achieve at this time of the year? (e.g., tilling, planting, fertilizing, spraying, harvesting, etc.)
- If you wanted to, could you have completed those field activities this past week without compromising field integrity? On which days could you have done so?
This mirrors how USDA collects weekly data: people from each state district report their personal observations, which are then averaged for each district and published in weekly Crop Progress and Condition Reports (personal communication, Susan Cowles, USDA-ARS).
Data Analysis
Weekly observations recorded by participating farmers were compared with the weekly state or district average number of days suitable for fieldwork published by USDA [6], [7], [8], [9]. The weekly state averages published by USDA are largely representative of fields without cover crops and served as a ‘control’ by which we compared data collected by PFI cover crop farmers. The weekly data reported by farmers were compared with the district averages (Iowa and Wisconsin), or with the state averages (Nebraska and Minnesota). The deviation - which is the difference between the days farmers reported as suitable for field work and the average for the district/state - was determined week by week to visualize differences. These deviations are illustrated in graphs, highlighting trends over time and variations between individual farms and regional conditions.
Weather
To provide context for the results, weather data was downloaded from the National Aeronautics and Space Administration (NASA) Prediction of Worldwide Energy Resources (POWER) project (https://power.larc.nasa.gov/) for each farmer’s trial. More details on the weather data can be found in the Appendix AM. Detailed Methods section at the end of this report.
Results and Discussion
Field History
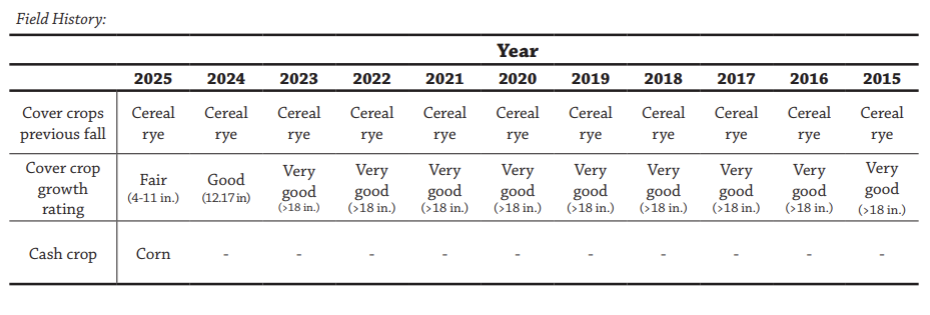
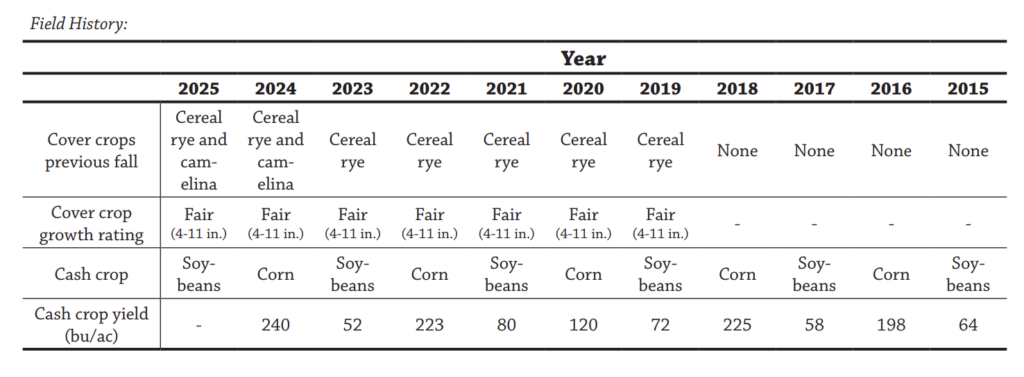
Thirty-five of the 38 farmers reported the management history of their selected fields. Of these, 15 had 7–10 years of cover crop implementation, 10 had 4–6 years, and 10 had more recently adopted cover crops (1–3 years). Most farmers used fall-planted cereal rye as their primary cover crop. Others incorporated additional species – such as oats, radish, clover, or camelina – or used multi-species mixtures with three or more species. Additional details on each cooperator’s field history are provided in Appendices A to AL.
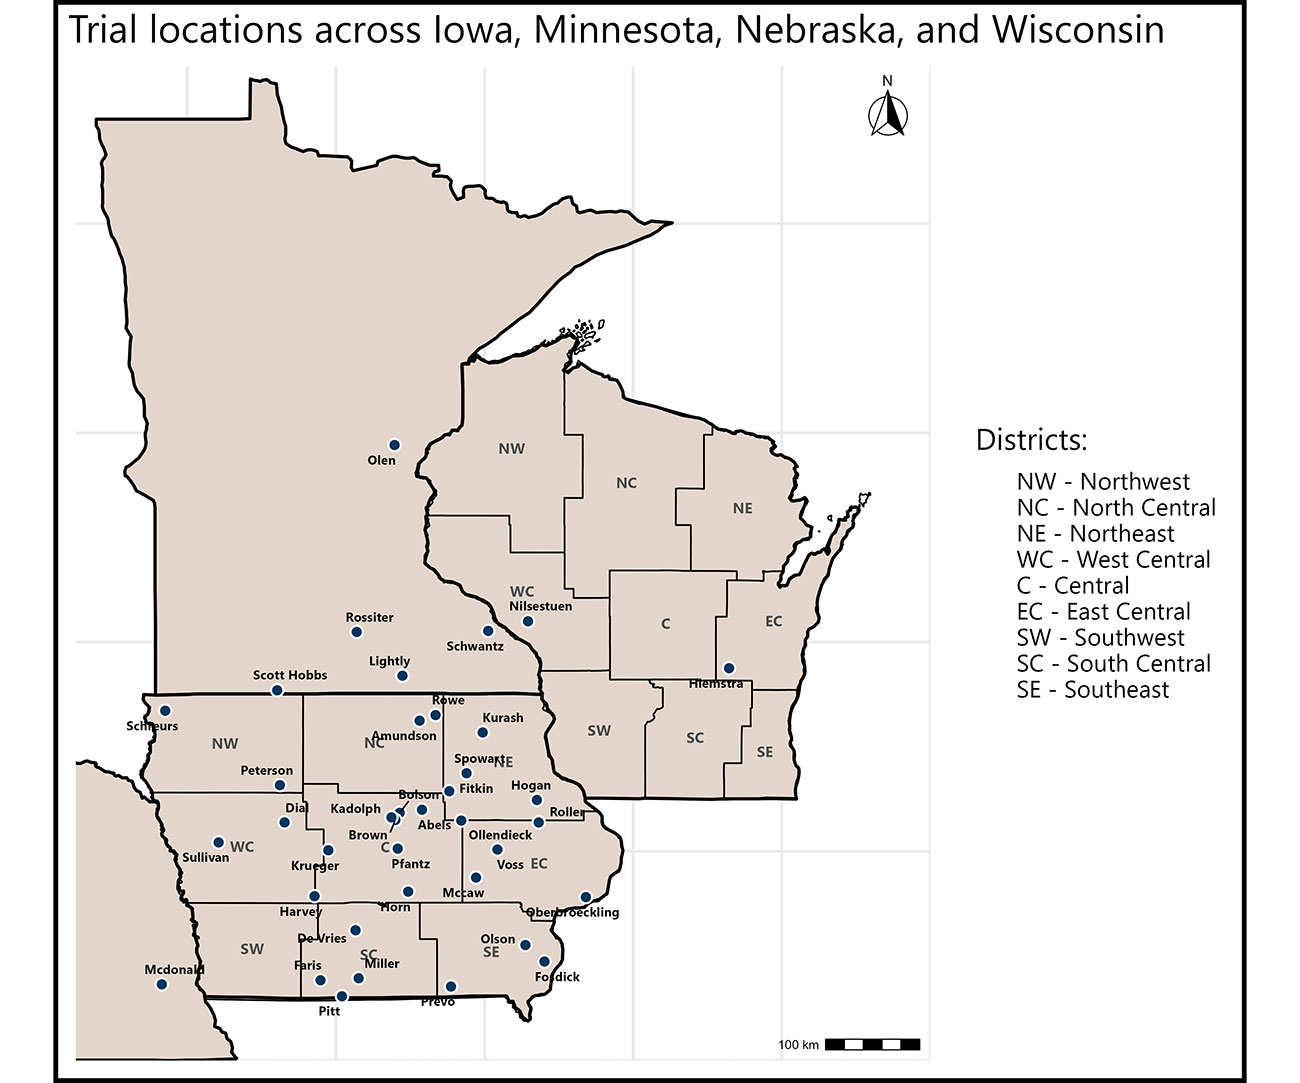
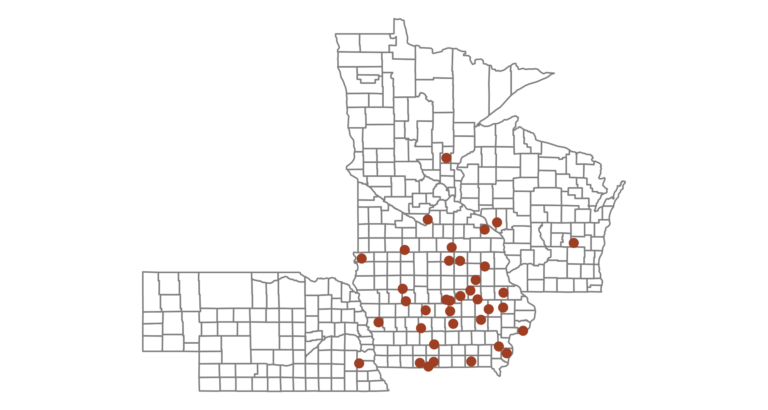
Districts. Each blue dot represents a participating trial site, labeled by the farmer’s last name. District
acronyms are shown within district boundaries and defined in the legend. Click to enlarge.
Trial Locations
Of the 38 locations, 30 were distributed across multiple Iowa districts: Central (8), East Central (4), North Central (2), Northeast (5), Northwest (2), South Central (4), Southeast (3), and West Central (2). Two additional farms were located in Wisconsin - one in the East Central district and one in the West Central district. Five farms were located in Minnesota and one in Nebraska. Because USDA reports for Minnesota and Nebraska provide only statewide averages, cooperator-reported days for these sites were compared exclusively to state-level averages.
Weather
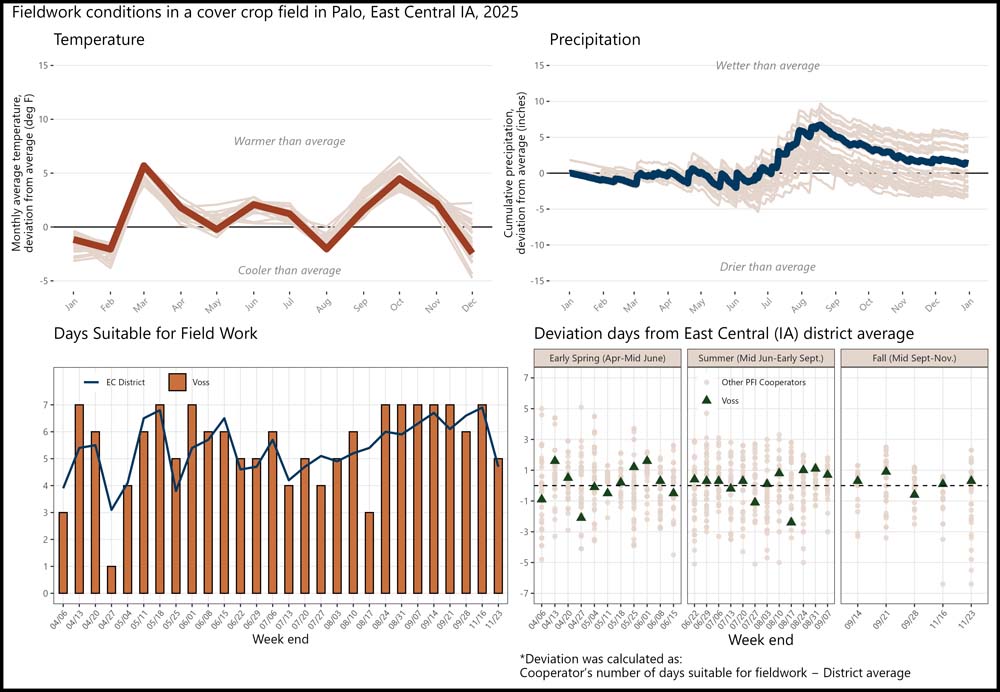
All sites experienced a warm start to the growing season, with nearly all sites transitioning to wetter-than-average conditions toward the end. (Figure 2)
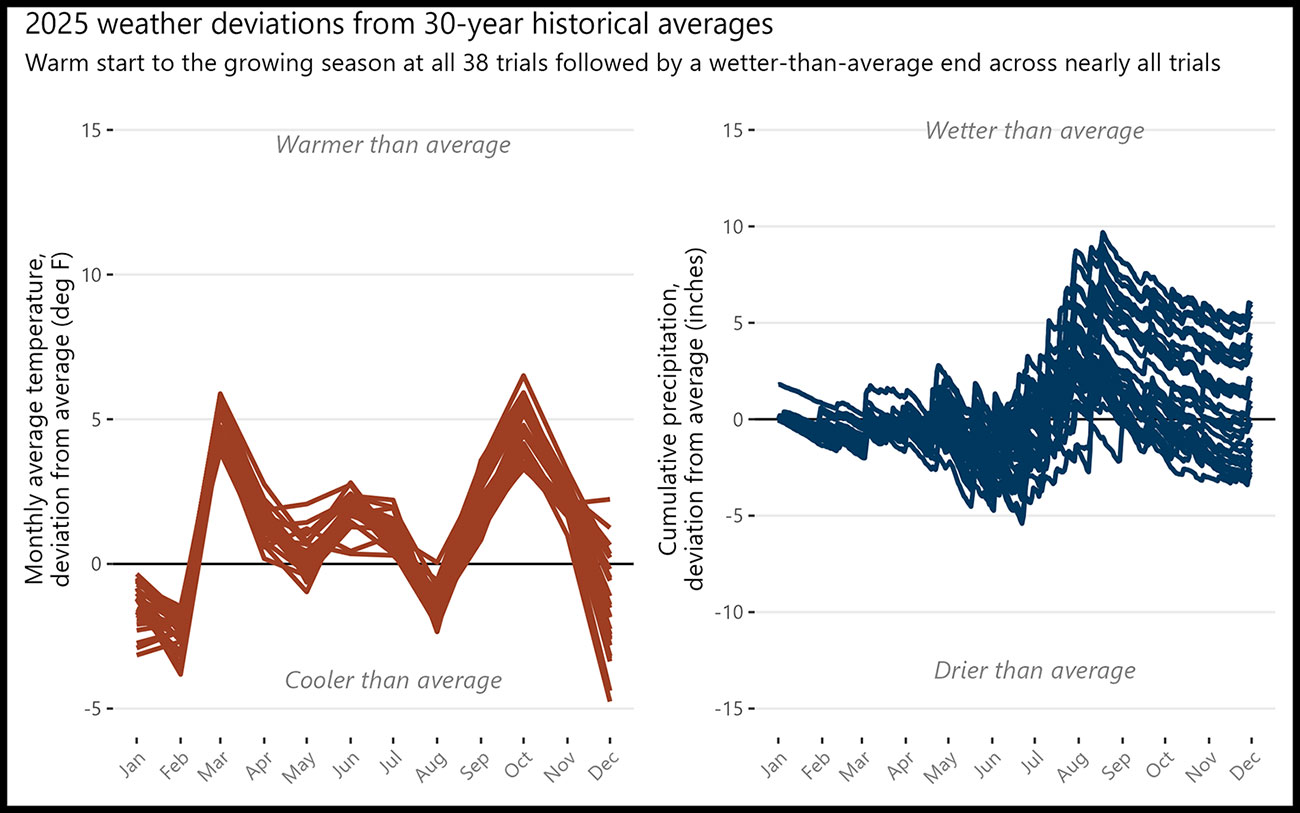
Average monthly air temperature deviations and (right) cumulative precipitation deviations. Overall,
although all sites experienced similar conditions, the diversity in field management and cropping systems
history contributed to varied outcomes for each cooperator. Click to enlarge.
Days Suitable for Fieldwork
Farmers recorded data over a 34-week period, from Mar. 31 to Nov. 23, resulting in 994 observations across the 38 locations. These records were compared with USDA reports (Figure 3). Due to the federal government shutdown, the USDA did not report days suitable for fieldwork from Sept. 29 to Nov. 9, therefore, this period was excluded from the analysis, resulting in a 28-week comparison period.
On average, cover crop farmers and district/state estimates reported nearly identical total days suitable for fieldwork in 2025. To assess seasonal patterns, the 28-week period was divided into three intervals: Spring (weeks 1–11; April to mid-June), Summer (weeks 12–23; mid-June to mid-September), and Fall (weeks 24–34; mid-September to Nov. 23). The spring period is especially important in this analysis because it represents the most operationally sensitive window of the growing season, when producers are performing critical field activities such as tillage, fertilizer application, planting, and early-season weed management. Limited access to fields during this period can delay planting progress and other management operations, potentially affecting crop establishment, yield potential, and overall farm logistics for the remainder of the season.
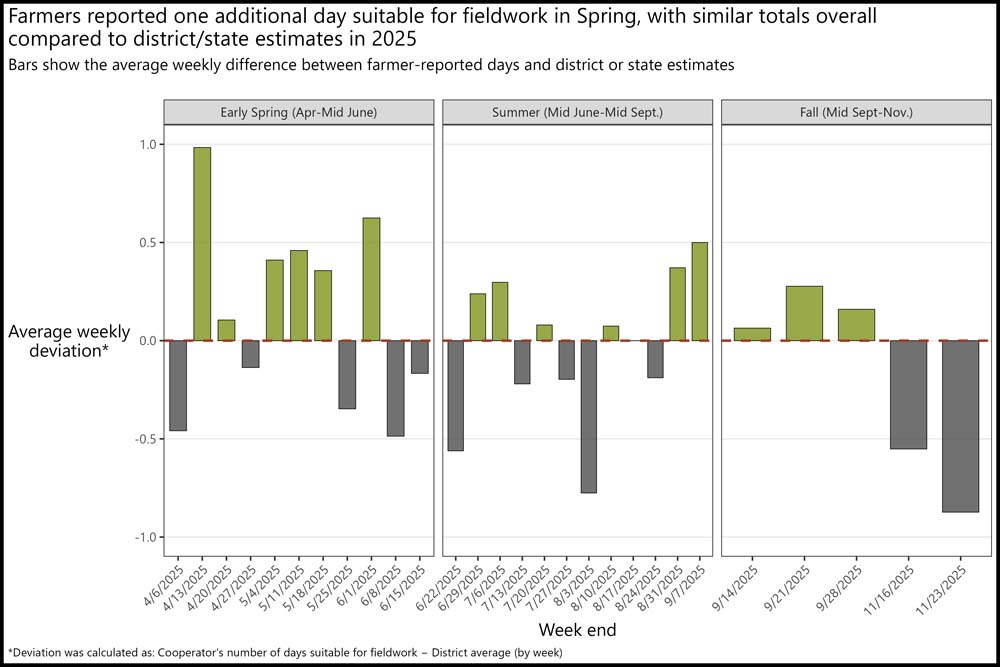
for fieldwork during the 2025 growing season. Each panel represents a season, and bars show the
average weekly difference between farmer-reported days and district or state estimates. Positive values (bars
above the dashed red line) indicate weeks in which farmers reported more days suitable for fieldwork
than district or state averages while negative values indicate fewer days. Overall, farmer-reported totals
were similar to USDA estimates across the full growing season; however, farmers reported approximately
one additional day suitable for fieldwork during the spring period. Click to enlarge.
Across seasons, differences between farmer-reported and district or state estimates were small. Farmers reported one additional day suitable for fieldwork in spring (51 vs. 50), similar values in Summer (51), and one day less in the Fall (27 vs. 28).
When breaking down the results across Iowa districts, comparisons between cooperator-reported and USDA district averages showed varying regional patterns (Table 1). Cooperators in the Northeast, Northwest, and Southwest districts reported more total days suitable for fieldwork than the USDA district averages, with the largest positive differences observed in the Northeast and Southeast districts. Interestingly, these findings differ somewhat from long-term historical trends reported in Iowa. The ISU report published in 2020 showed that the Northwest district experienced the sharpest decline in spring field days over time, followed closely by the Northeast district, with losses averaging one suitable field day every four and five years, respectively [2]. That same report estimated average spring fieldwork suitability between April 2 and June 17 at 42.2 days for Northwest Iowa and 41.3 days for Northeast Iowa. In contrast, PFI cooperators located in the Northwest and Northeast districts reported averages of 53.5 and 60.7 days suitable for fieldwork, respectively, during the same period in 2025.
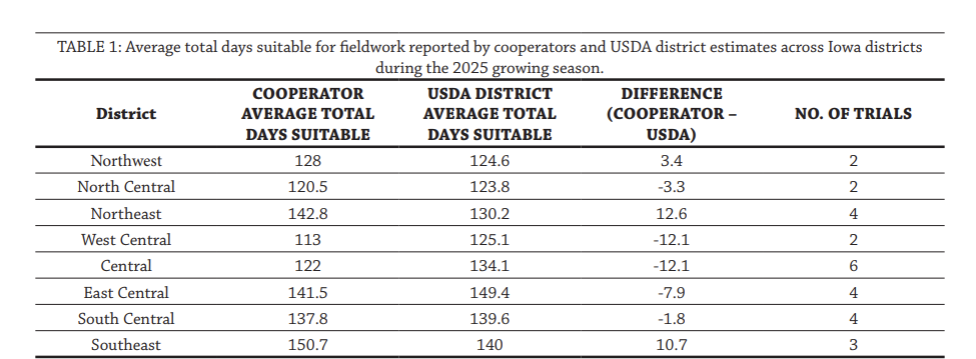
Conversely, USDA averages were higher in the Central, West Central, North Central, South Central, and East Central districts. The Central district included the greatest number of participating trials. Trials that reported fewer than 24 weeks of data were excluded from these calculations to reduce potential bias associated with incomplete reporting coverage.
Despite the well-documented benefits, cover crop adoption remains limited. In Iowa, estimates vary: the 2022 USDA Census reports that 1.3 million acres of the cropland was planted with cover crops, while a recent statewide survey suggests the number could be as high as 3.8 million acres in 2023, out of a total of 22.6 million acres cultivated with corn and soybeans [10], [11]. Common concerns among non-adopters include the potential for delayed spring planting and limited time between harvest and winter to justify the use of cover crops [12]. Results from this project help address these perceptions, indicating that fields managed with cover crops can maintain – or in some cases increase – the number of days suitable for fieldwork during critical spring periods.
Participation in the trial also encouraged farmers to more closely monitor field conditions and reflect on the factors influencing fieldwork opportunities. When asked what the most valuable aspect was of conducting the trial, cooperator Neil Peterson noted: “Reflecting on the soil and weather conditions. I enjoy observing the conditions of my farm.” For some, the results reinforced prior observations. Cooperator Josh Hiemstra stated, “I was sure that I would have more days. I didn't know it was that drastic,” while Jarret Horn added, “[This trial] clearly reinforced that cover crops and residue can increase field workability.”
Farmer Perceptions of Fieldwork Suitability
It is important to acknowledge that the assessment of days suitable for fieldwork is inherently subjective. Although farmers were provided with the USDA definition of a “suitable” day, individual interpretations can vary. Farmer perception and decision-making are known to vary across individuals and management contexts [13], [14], [15]. What one farmer considers acceptable conditions for field operations – such as driving equipment or planting – may differ from another’s threshold, depending on management style, equipment, and risk tolerance.
Reflections from participating farmers highlight these challenges. For example, cooperator Dennis Rossiter noted: “We had a persistently wet year, but so did a lot of Minnesota. I was surprised that I was in the field much less than average. I struggled with how I would answer some days. Different times of the season influenced my answers. Early spring, I could take the gator out and pick rocks but never drive on it with a tractor. Is that a ‘1’ (suitable) or ’0’ (not suitable)? As weeds were growing, I found it tough to say ‘0’ when a sprayer should be in the field. I hoped that my soil health journey would say that I could have access sooner than the average."
Similarly, cooperator Joe Rowe described how perspective influenced his responses: “I took the approach at times - If I was a ’conventional’ farmer could I make those passes, whereas my personal bias might be to wait another day for field travel to avoid compaction, I knew the majority of farmers / commercial applicators would be able or willing to go regardless of the soil effects. I thought that mindset was likely more in tune with how the USDA district evaluations were looking at things, thus making a better comparison (vs my overly conservative approach).”
This variability introduces an element of observer bias into the dataset. However, farmer-reported observations also capture real-world decision-making processes shaped by practical experience and operational constraints. As such, they remain highly relevant for evaluating fieldwork opportunities under actual farm conditions.
Conclusions and Next Steps
The second year of this project expanded the dataset, increasing representation across Iowa districts and additional Midwestern states. Although the results do not yet support definitive conclusions, findings indicate that cover crop adoption did not reduce the total number of days suitable for fieldwork, with farmer-reported and district or state estimates showing nearly identical seasonal totals. Notably, farmers reported a small advantage in spring, with approximately one additional day suitable for fieldwork relative to district or state averages.
Moreover, farmer-to-farmer learning and outreach emerged as key outcomes of this work. As the project continues, efforts will focus on engaging a broader network of farmers across the Midwest to expand data collection and capture year-to-year variability. This will strengthen understanding of how cover crops contribute to soil health and resilience under variable weather conditions. Participating farmers also play an important role in sharing their experiences. As cooperator Margaret Hogan noted, “The most valuable aspect of conducting this trial for me is being able to show others another reason to use cover crops.”
Appendix A – Fred Abels; Holland, IA
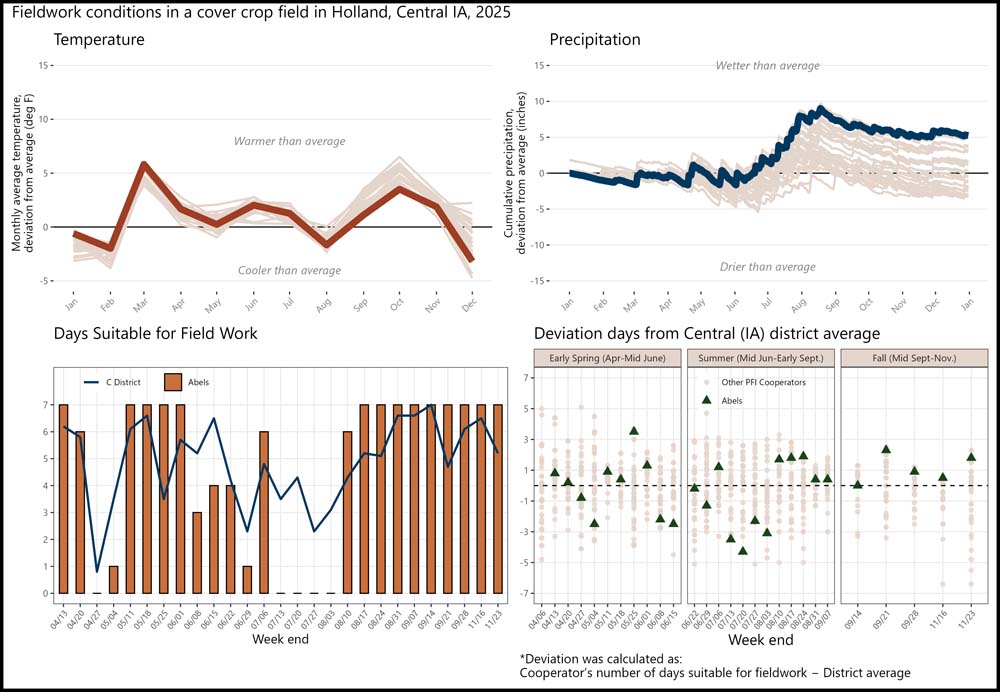
Abels reported a total of 129 days suitable for fieldwork from 04/13 to 11/23, while the central district had 132 days suitable for fieldwork over the same period. By season, Abels reported 49 days suitable in early spring compared with 50 for the central district; 45 days in summer compared with 52; and 35 days in fall compared with 30.
Appendix B – Alec Amundson; Osage, IA
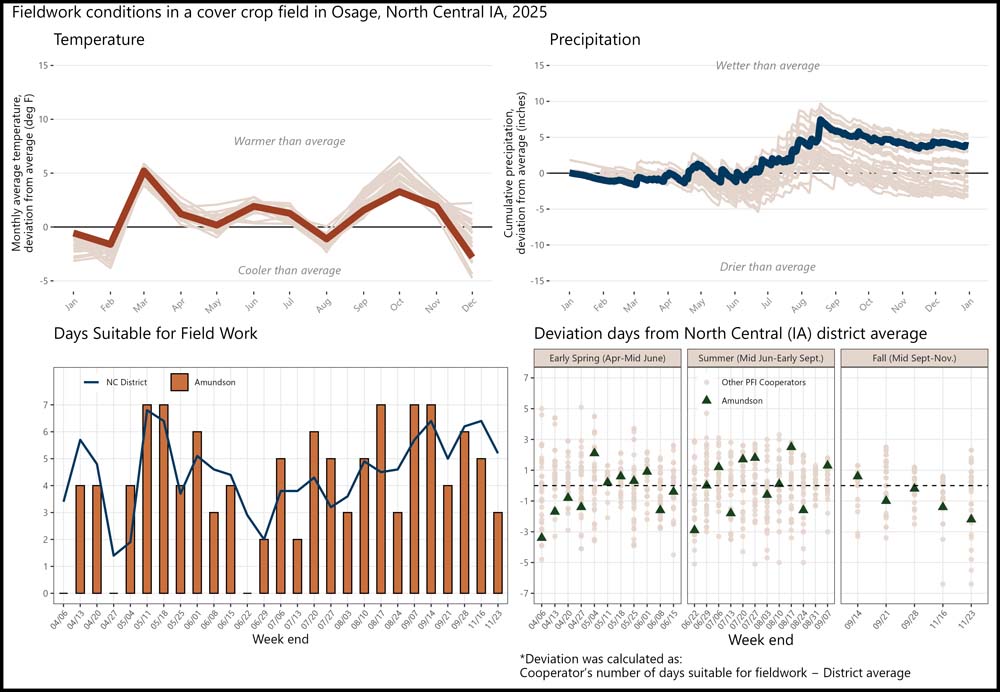
Amundson reported a total of 113 days suitable for fieldwork from 04/06 to 11/23, while the north central district had 121 days suitable for fieldwork over the same period. By season, Amundson reported 43 days suitable in early spring compared with 48 for the north central district; 45 days in summer compared with 43; and 25 days in fall compared with 29.
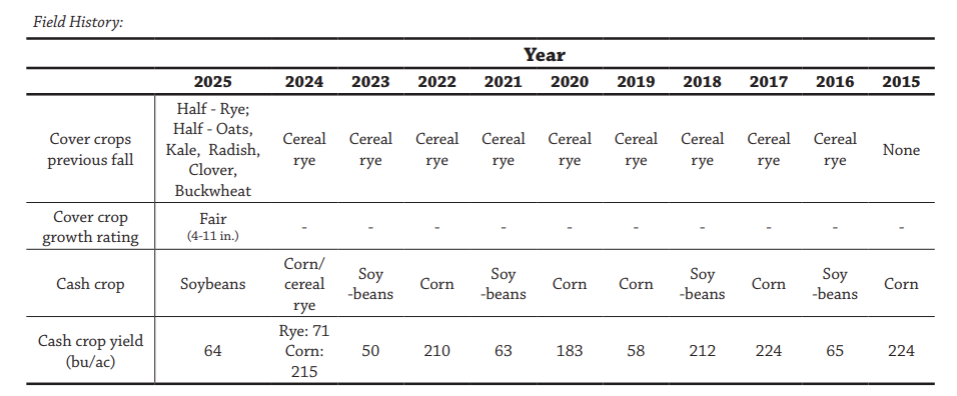
Appendix C – Jacob Bolson; Hubbard, IA
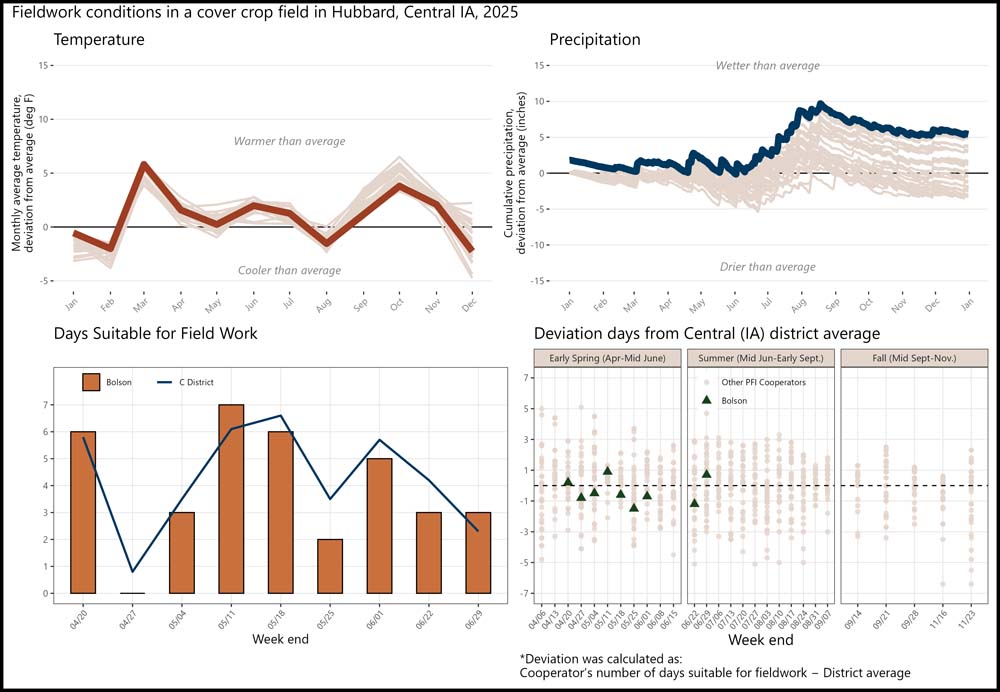
Bolson reported a total of 35 days suitable for fieldwork from 04/20 to 06/29, while the central district had 38 days suitable for fieldwork over the same period. By season, Bolson reported 29 days suitable in early spring compared with 32 for the central district.
Appendix D – Landon Brown; New Providence, IA
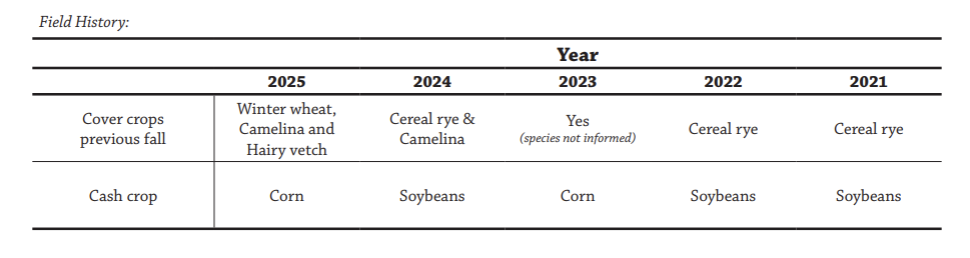
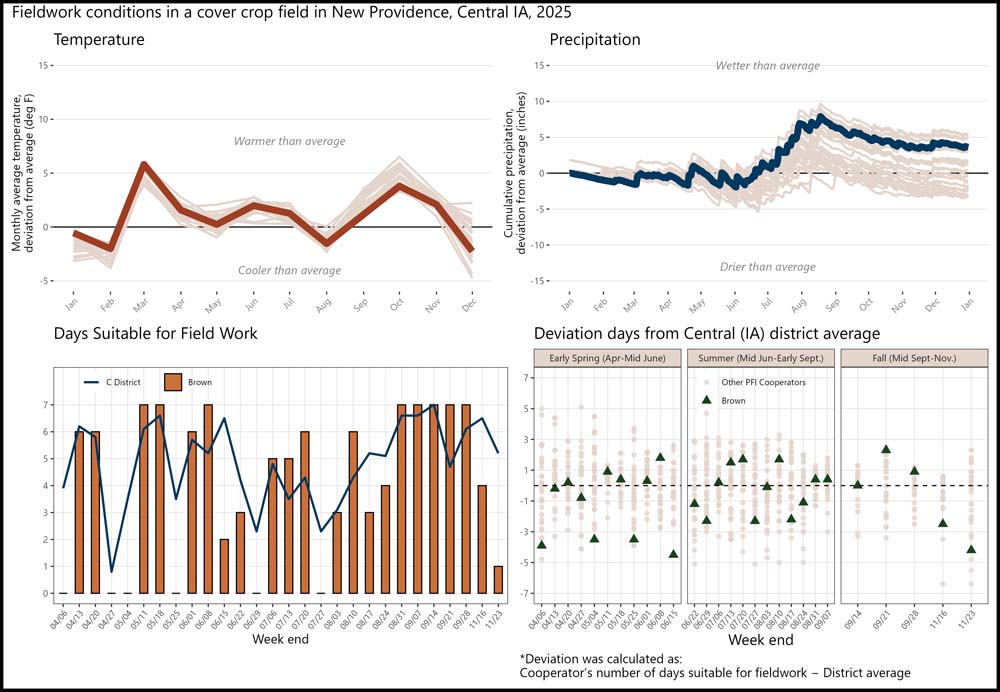
Brown reported a total of 116 days suitable for fieldwork from 04/06 to 11/23, while the central district had 136 days suitable for fieldwork over the same period. By season, Brown reported 41 days suitable in early spring compared with 54 for the central district; 49 days in summer compared with 52; and 26 days in fall compared with 30.
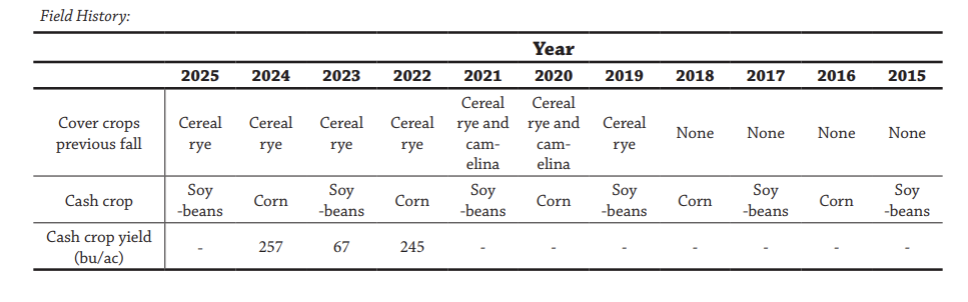
Appendix E – Craig De Vries; New Virginia, IA
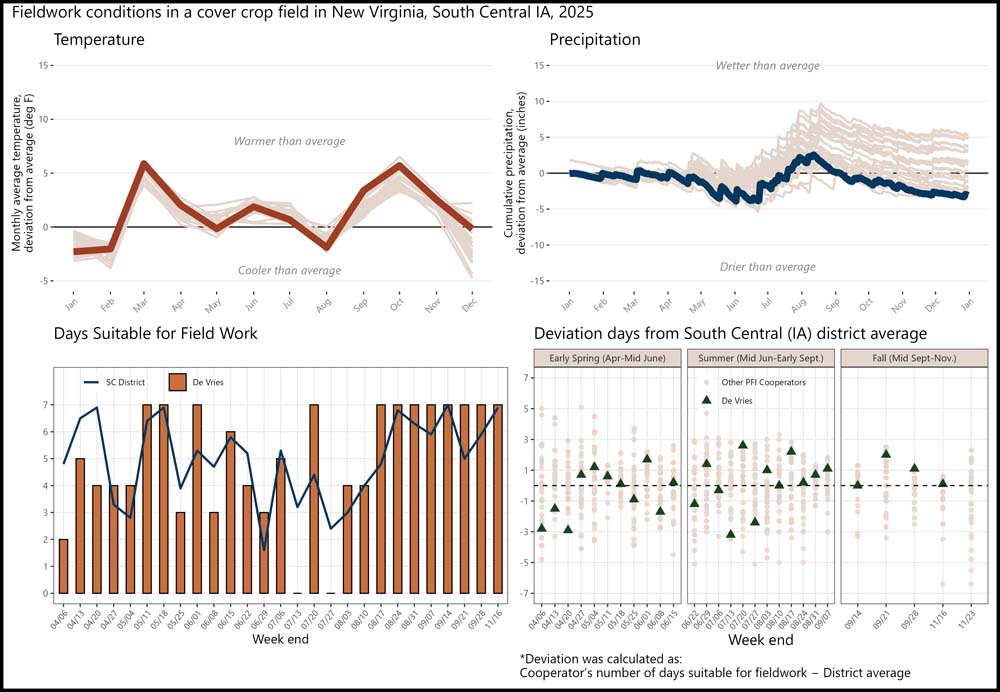
De Vries reported a total of 135 days suitable for fieldwork from 04/06 to 11/16, while the south central district also had 135 days suitable for fieldwork over the same period. By season, De Vries reported 52 days suitable in early spring compared with 57 for the south central district; 55 days in summer compared with 53; and 28 days in fall compared with 25.
Appendix F – Dwight Dial; Lake City, IA
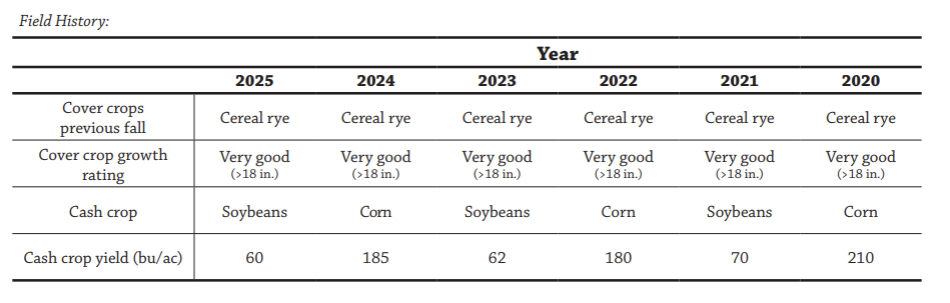
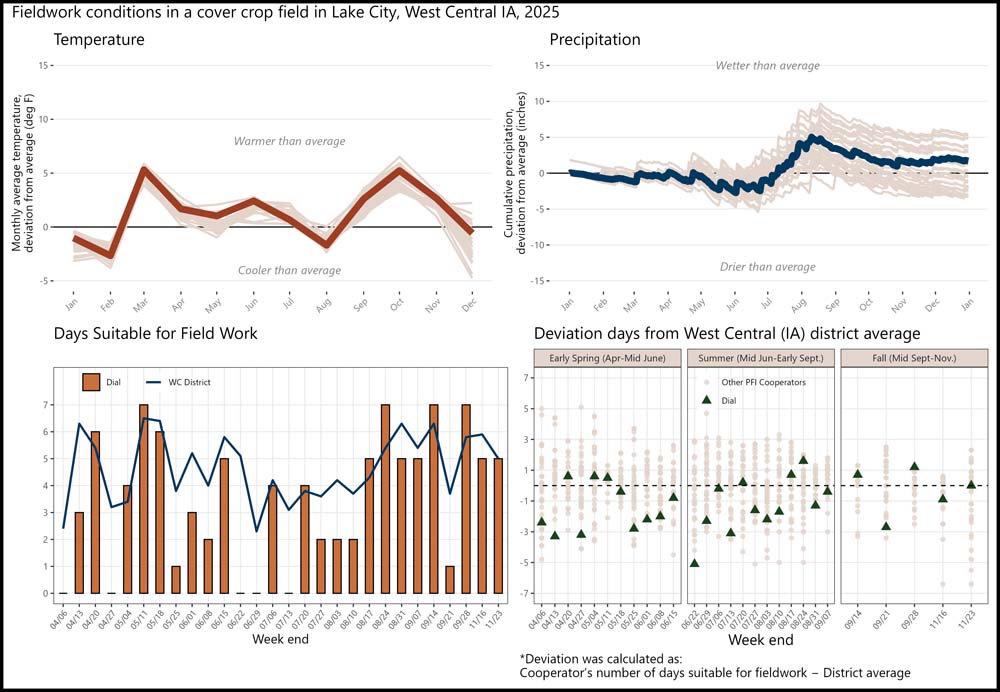
Dial reported a total of 98 days suitable for fieldwork from 04/06 to 11/23, while the west central district had 130 days suitable for fieldwork over the same period. By season, Dial reported 37 days suitable in early spring compared with 52 for the west central district; 36 days in summer compared with 51; and 25 days in fall compared with 27.
Appendix G – Richard Faris; Mount Ayr, IA
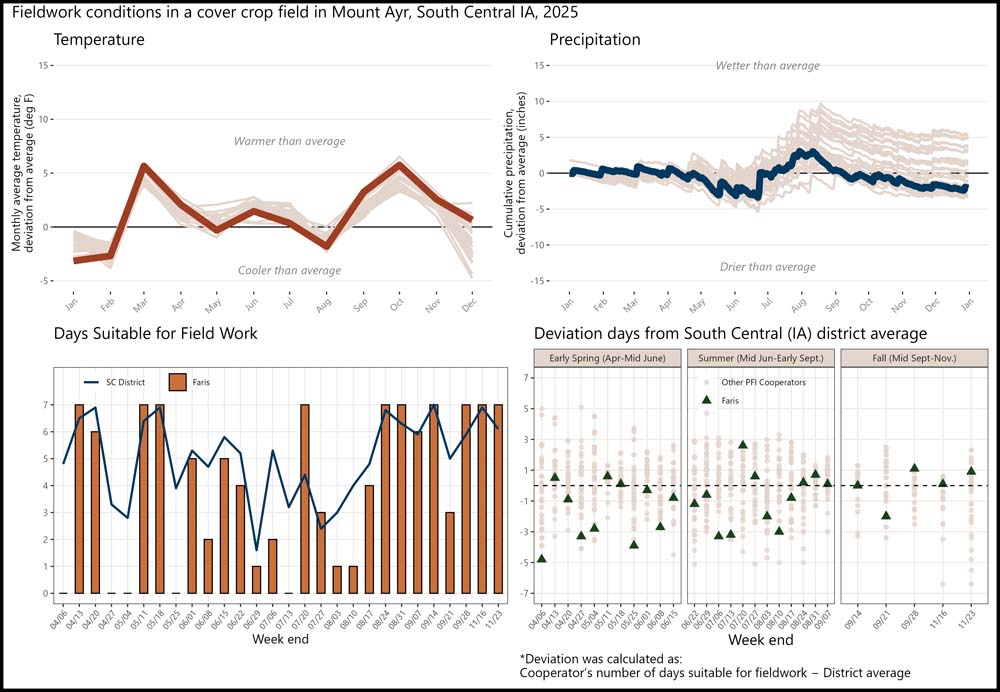
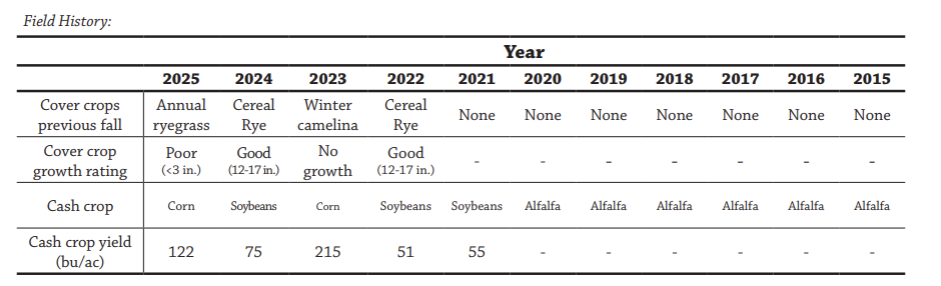
Faris reported a total of 113 days suitable for fieldwork from 04/06 to 11/23, while the south central district had 141 days suitable for fieldwork over the same period. By season, Faris reported 39 days suitable in early spring compared with 57 for the south central district; 43 days in summer compared with 53; and 31 days in fall compared with 31.
Appendix H – Jim Fitkin; Cedar Falls, IA
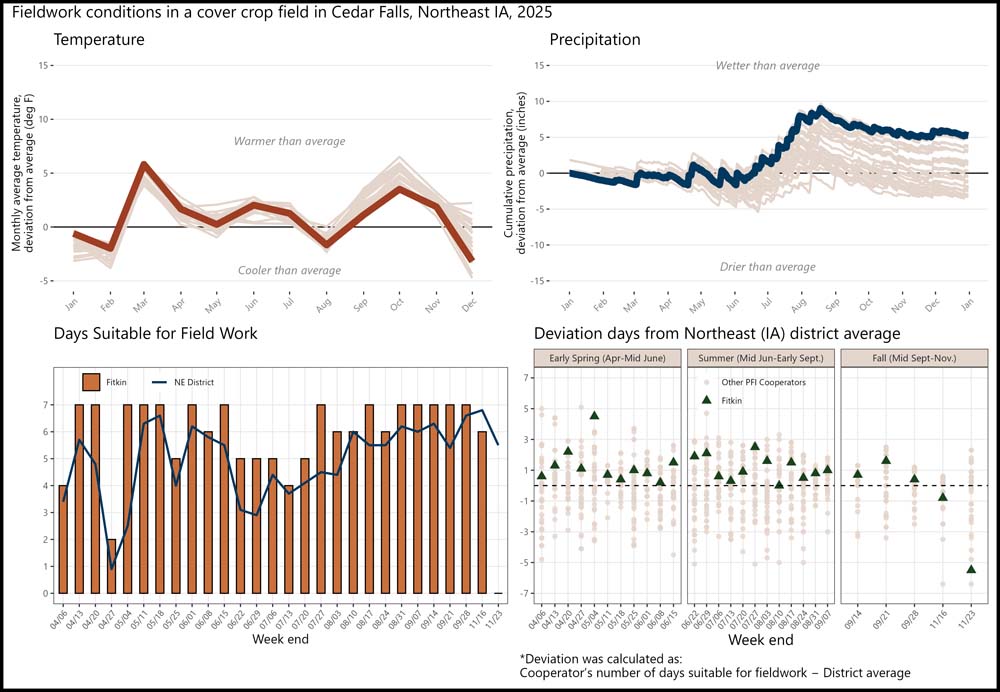
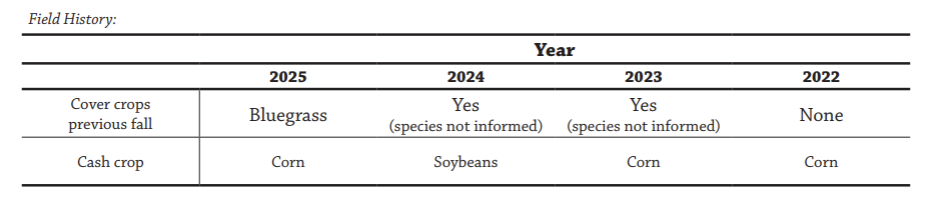
Fitkin reported a total of 163 days suitable for fieldwork from 04/06 to 11/23, while the northeast district had 139 days suitable for fieldwork over the same period. By season, Fitkin reported 66 days suitable in early spring compared with 52 for the northeast district; 70 days in summer compared with 56; and 27 days in fall compared with 31.
Appendix I – Michael Fosdick; Sperry, IA
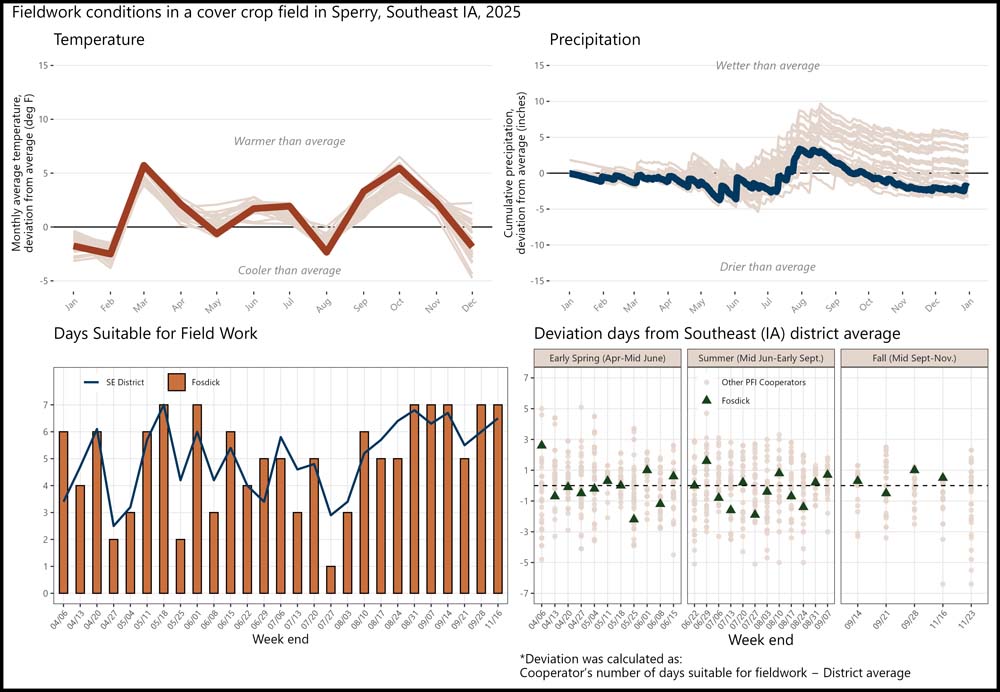
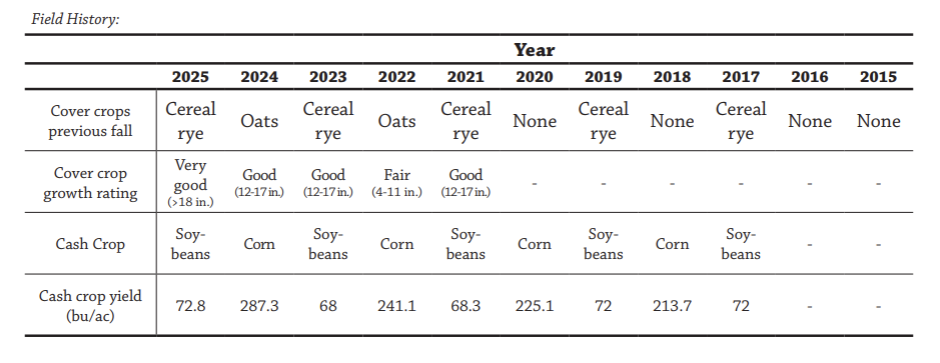
Fosdick reported a total of 134 days suitable for fieldwork from 04/06 to 11/16, while the southeast district had 136 days suitable for fieldwork over the same period. By season, Fosdick reported 52 days suitable in early spring compared with 52 for the southeast district; 56 days in summer compared with 59; and 26 days in fall compared with 25.
Appendix J – Robert Harvey; Redfield, IA
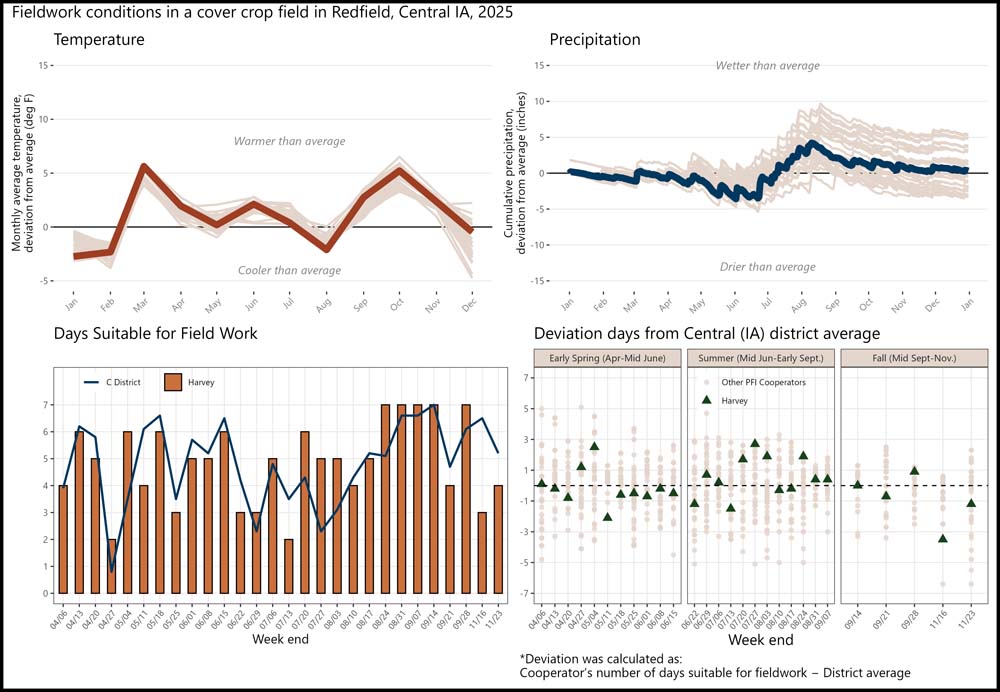
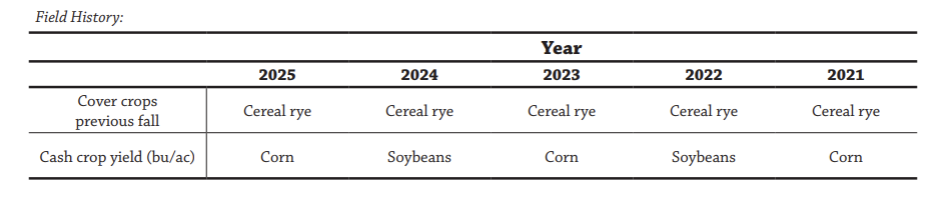
Harvey reported a total of 136 days suitable for fieldwork from 04/06 to 11/23, while the central district also had 136 days suitable for fieldwork over the same period. By season, Harvey reported 52 days suitable in early spring compared with 54 for the central district; 59 days in summer compared with 52; and 25 days in fall compared with 30.
Appendix K – Josh Hiemstra; Brandon, WI
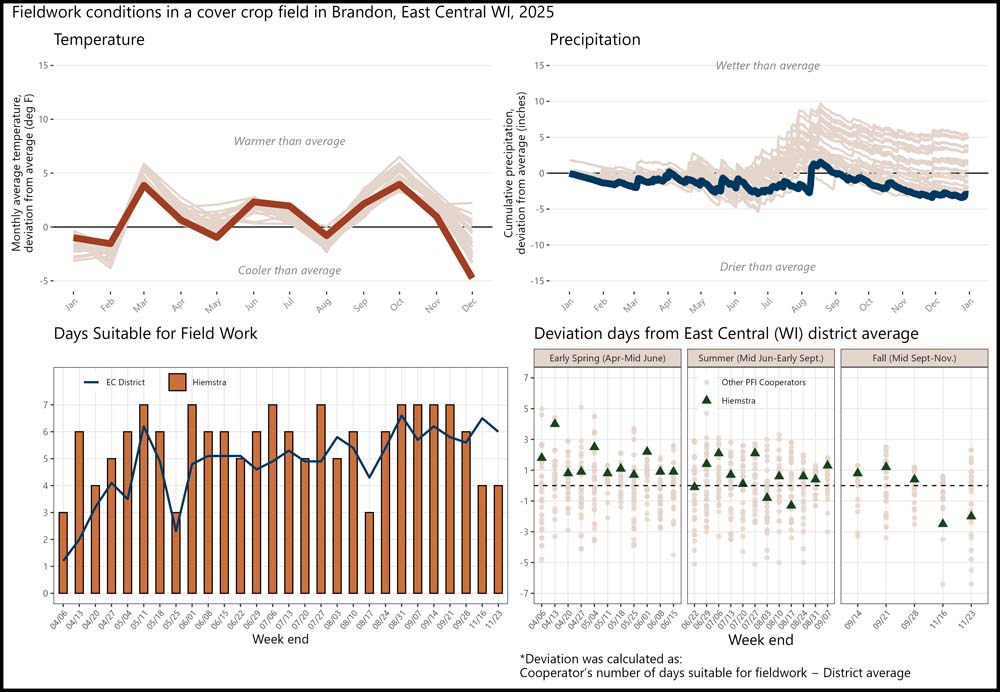
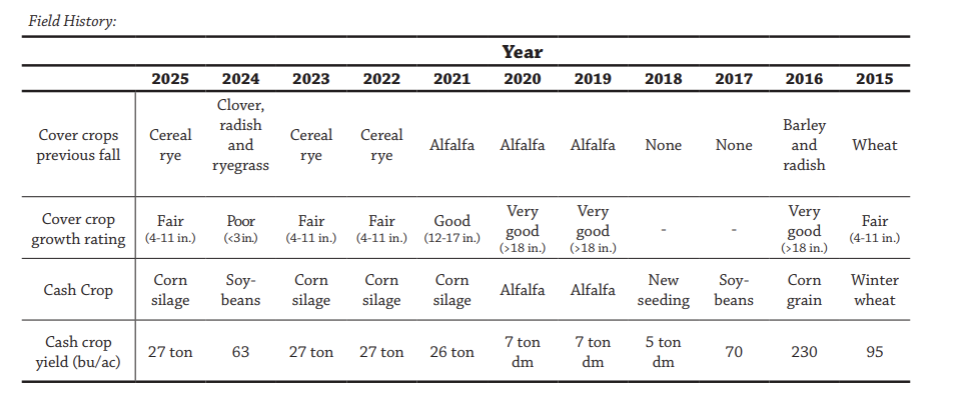
Hiemstra reported a total of 157 days suitable for fieldwork from 04/06 to 11/23, while the east central district in Wisconsin had 135 days suitable for fieldwork over the same period. By season, Hiemstra reported 59 days suitable in early spring compared with 42 for the east central district; 70 days in summer compared with 63; and 28 days in fall compared with 30.
Appendix L – Margaret Hogan; Earlville, IA
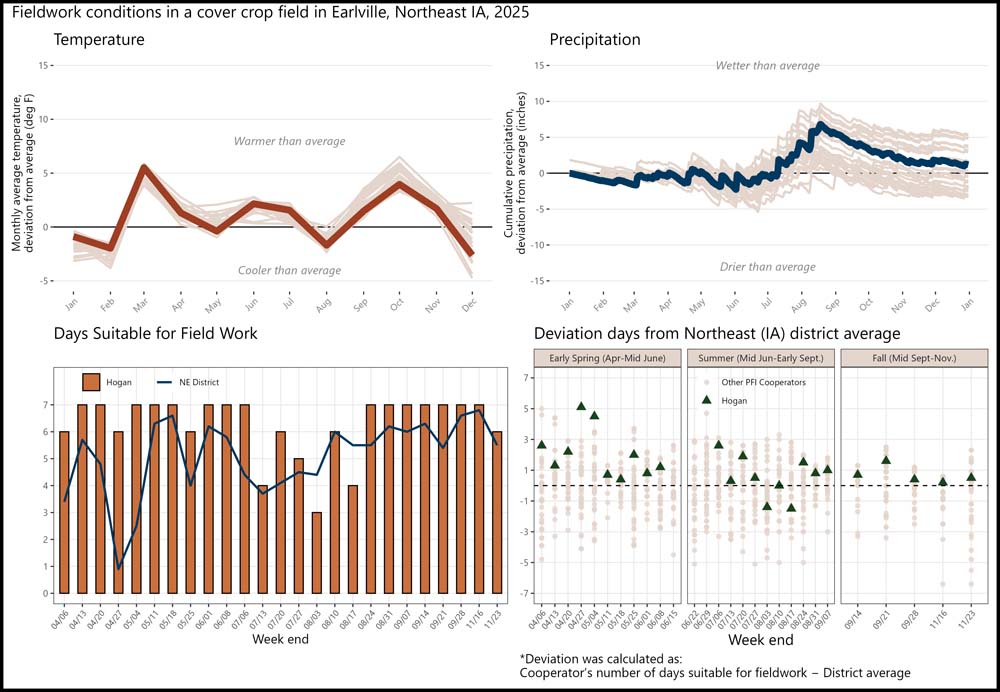
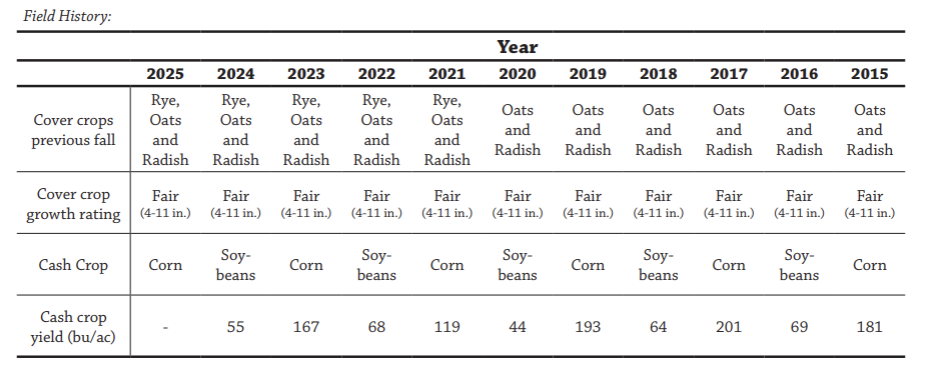
Hogan reported a total of 157 days suitable for fieldwork from 04/06 to 11/23, while the northeast district had 127 days suitable for fieldwork over the same period. By season, Hogan reported 67 days suitable in early spring compared with 46 for the northeast district; 56 days in summer compared with 50; and 34 days in fall compared with 31.
Appendix M – Jarret Horn; Newton, IA
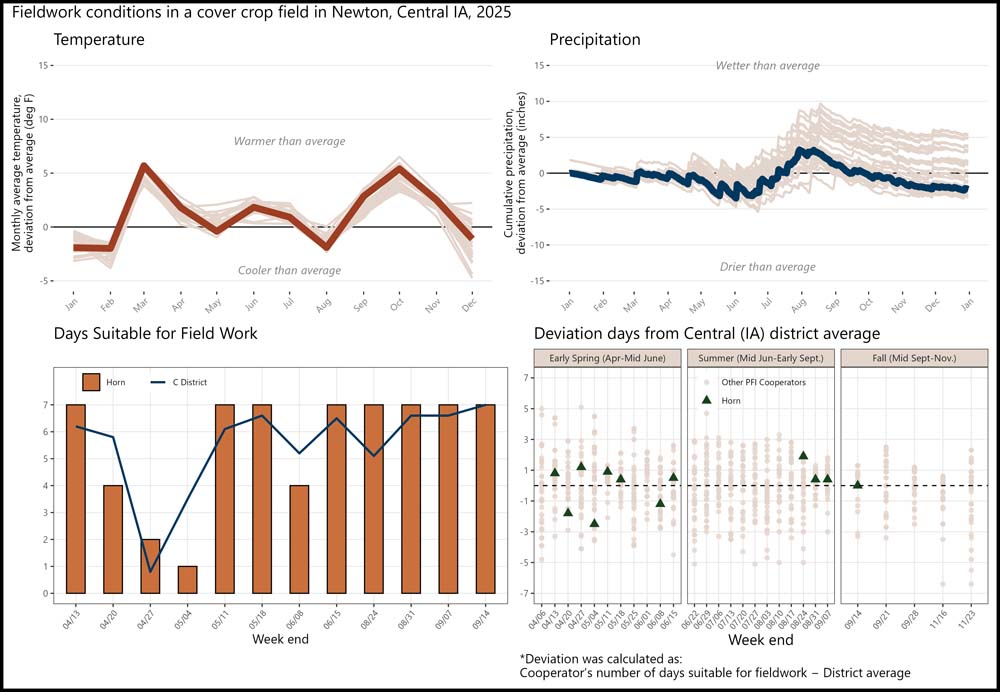
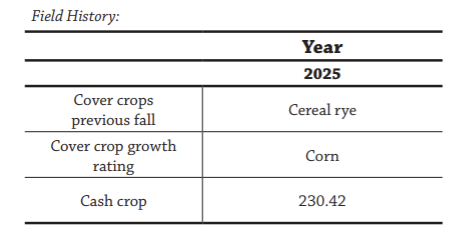
Horn reported a total of 67 days suitable for fieldwork from 04/13 to 09/14, while the central district had 66 days suitable for fieldwork over the same period. By season, Horn reported 39 days suitable in early spring compared with 41 for the central district; 21 days in summer compared with 18; and 7 days in fall compared with 7.
Appendix N – Kurtis Kadolph; Hubbard, IA
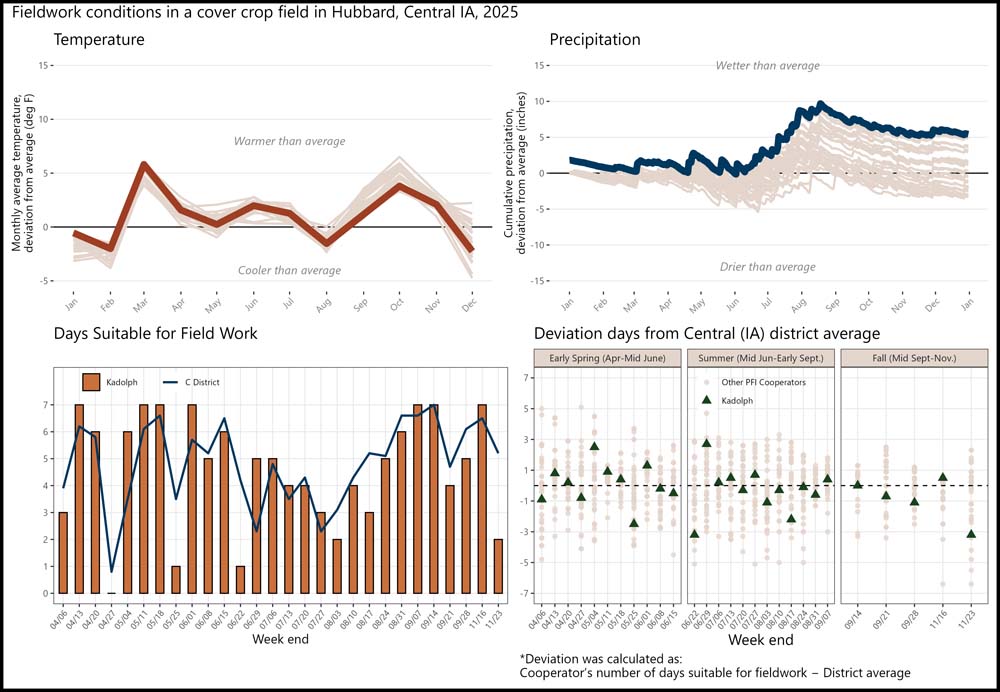
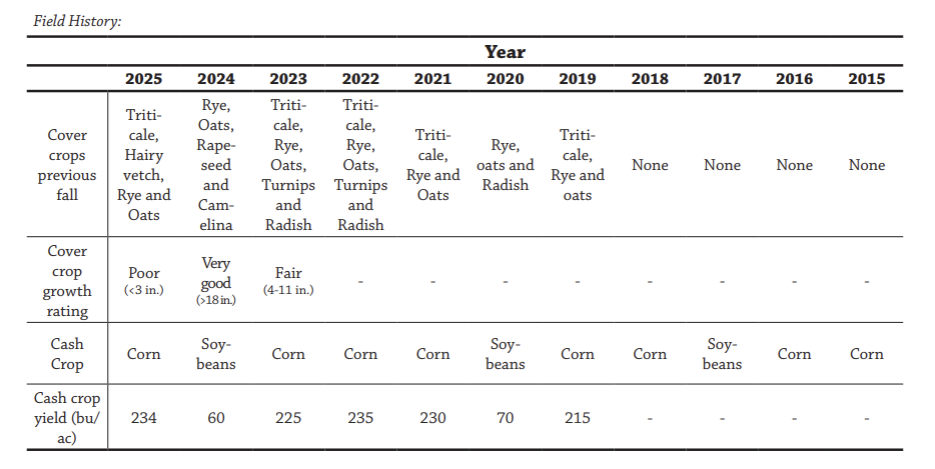
Kadolph reported a total of 129 days suitable for fieldwork from 04/06 to 11/23, while the central district had 136 days suitable for fieldwork over the same period. By season, Kadolph reported 55 days suitable in early spring compared with 54 for the central district; 49 days in summer compared with 52; and 25 days in fall compared with 30.
Appendix O – Keaton Krueger; Ogden, IA
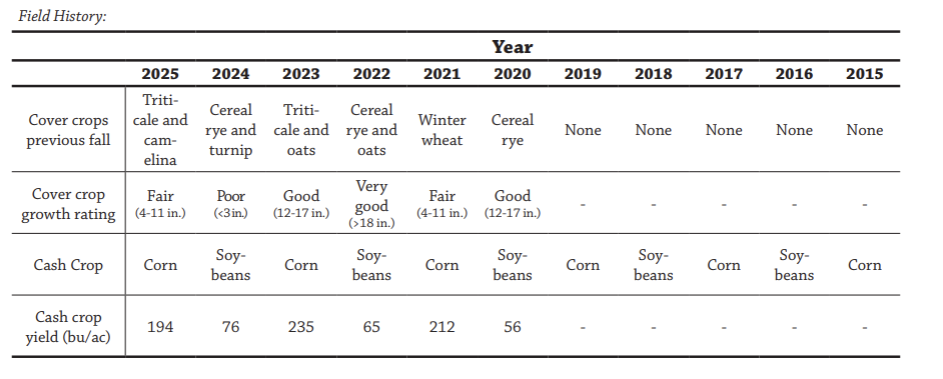
Krueger reported a total of 113 days suitable for fieldwork from 04/06 to 11/23, while the central district had 136 days suitable for fieldwork over the same period. By season, Krueger reported 52 days suitable in early spring compared with 54 for the central district; 37 days in summer compared with 52; and 24 days in fall compared with 30.
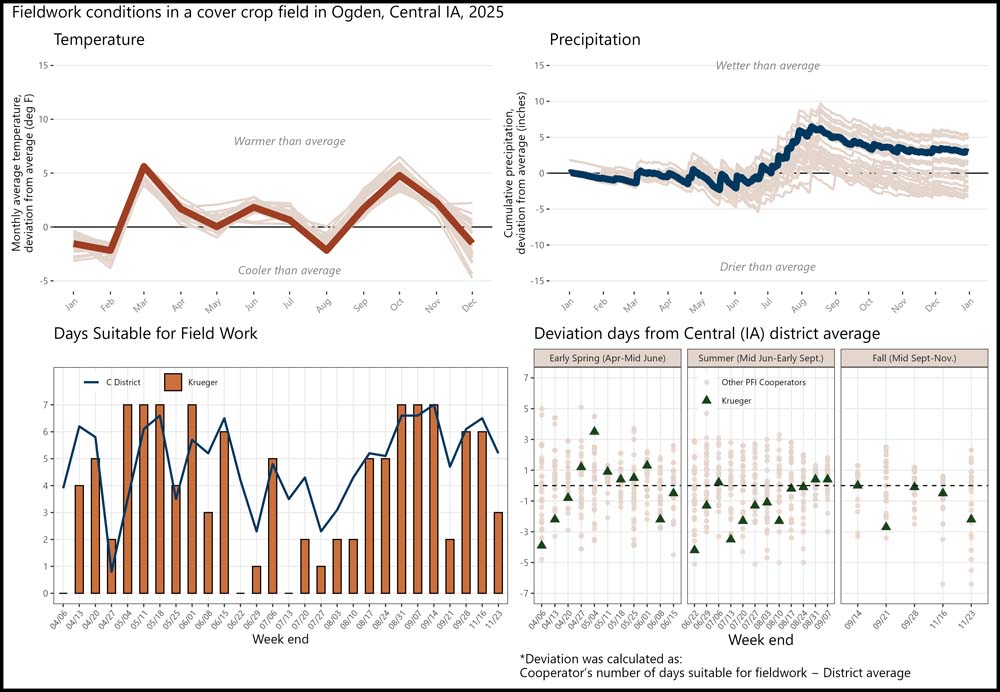
Appendix P – Ross Kurash; Fort Atkinson, IA
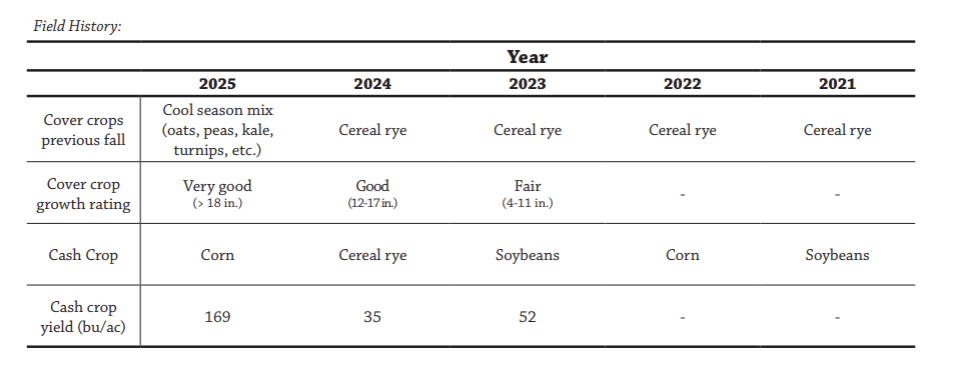
Kurash reported a total of 124 days suitable for fieldwork from 04/06 to 11/23, while the northeast district had 139 days suitable for fieldwork over the same period. By season, Kurash reported 52 days suitable in early spring compared with 52 for the northeast district; 45 days in summer compared with 56; and 27 days in fall compared with 31.
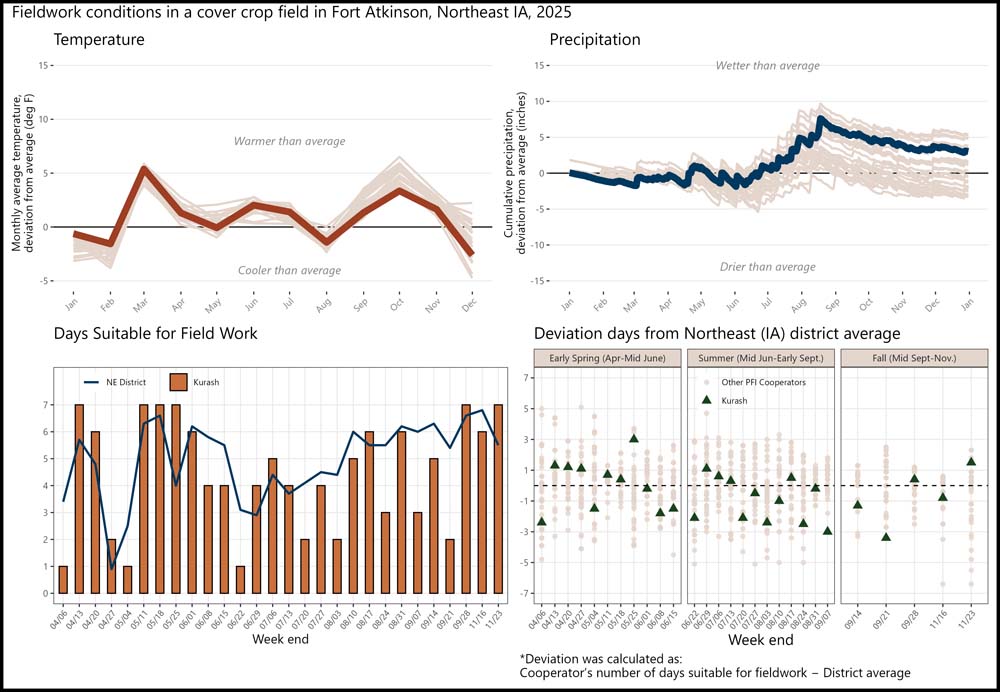
Appendix Q – Scott Lightly; Oakland, MN
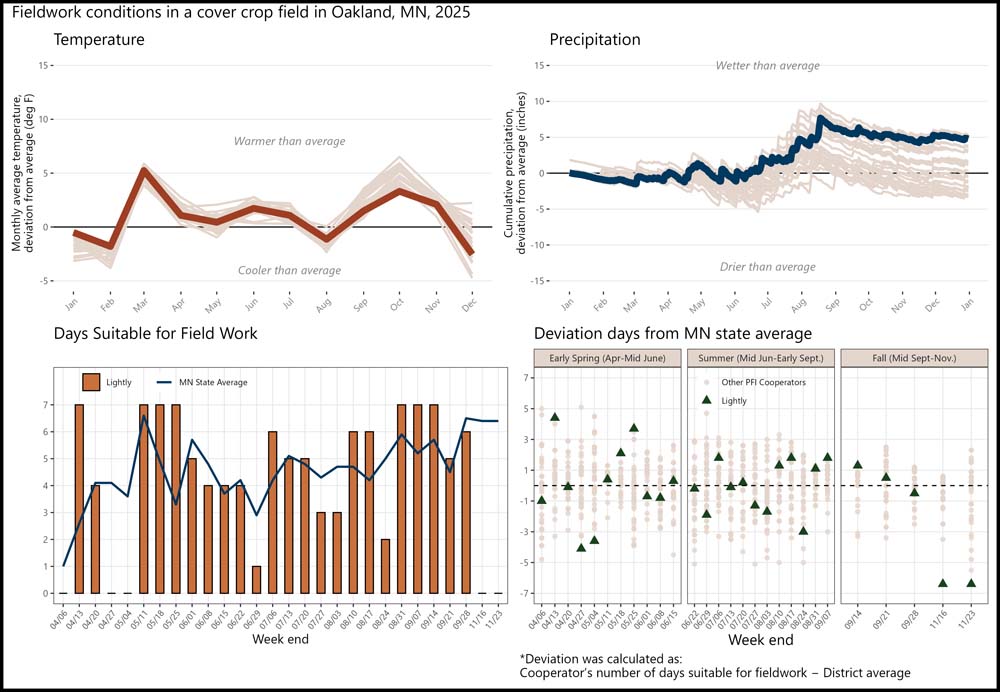
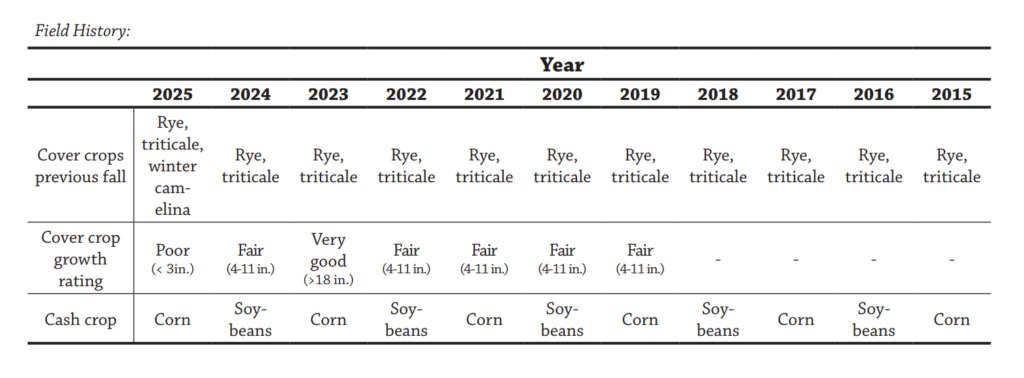
Lightly reported a total of 118 days suitable for fieldwork from 04/06 to 11/23, while the MN state average had 129 days suitable for fieldwork over the same period. By season, Lightly reported 45 days suitable in early spring compared with 44 for the MN state average; 55 days in summer compared with 55; and 18 days in fall compared with 30.
Appendix R – Ross McCaw; Marengo, IA
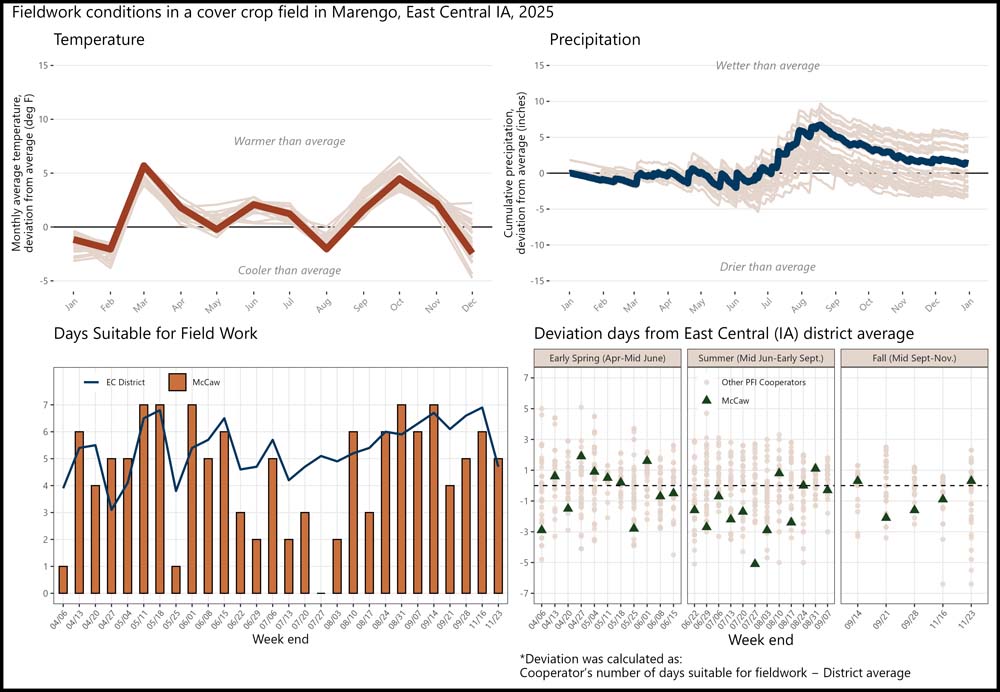
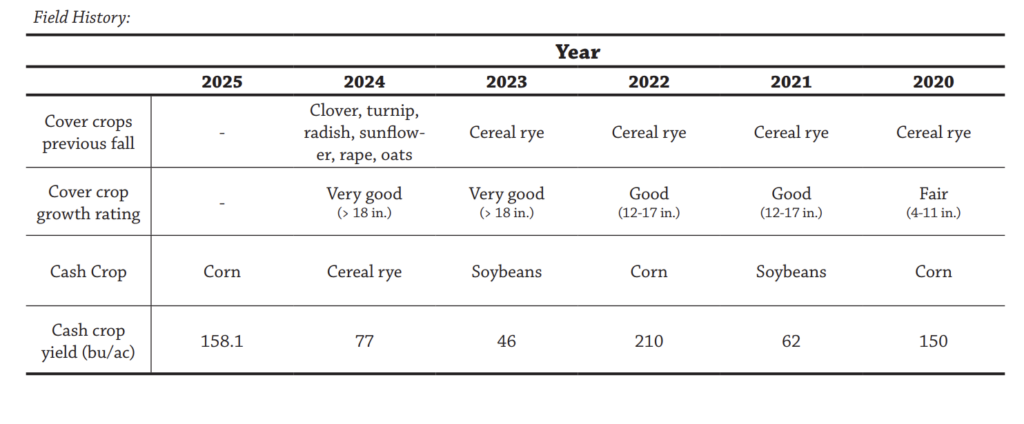
McCaw reported a total of 126 days suitable for fieldwork from 04/06 to 11/23, while the east central district had 150 days suitable for fieldwork over the same period. By season, McCaw reported 54 days suitable in early spring compared with 57 for the east central district; 45 days in summer compared with 63; and 27 days in fall compared with 31.
Appendix S – Michael McDonald; Palmyra, NE
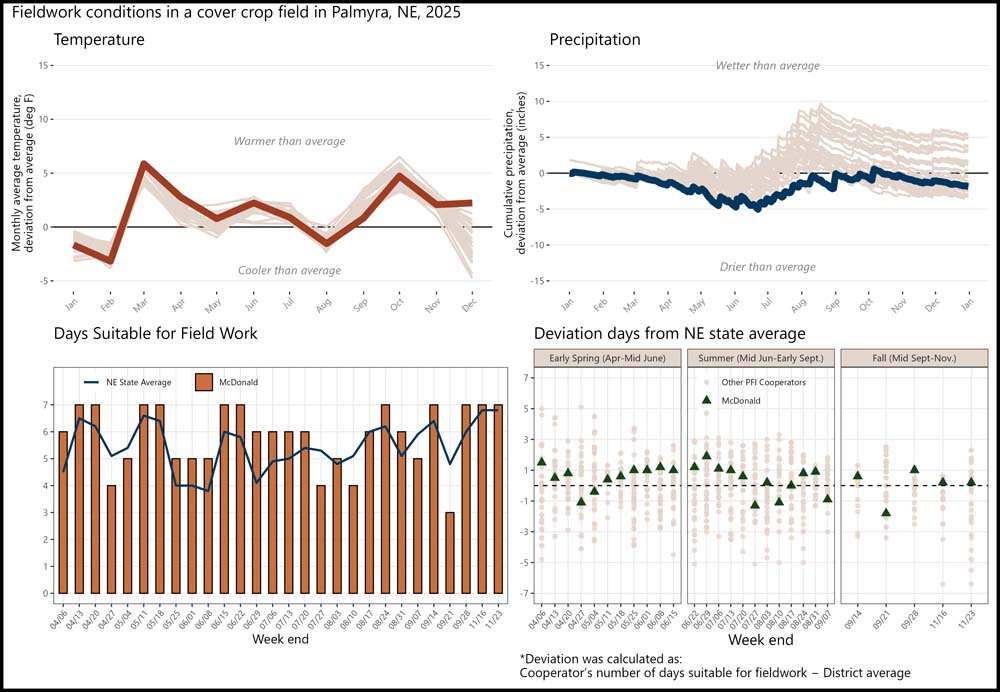
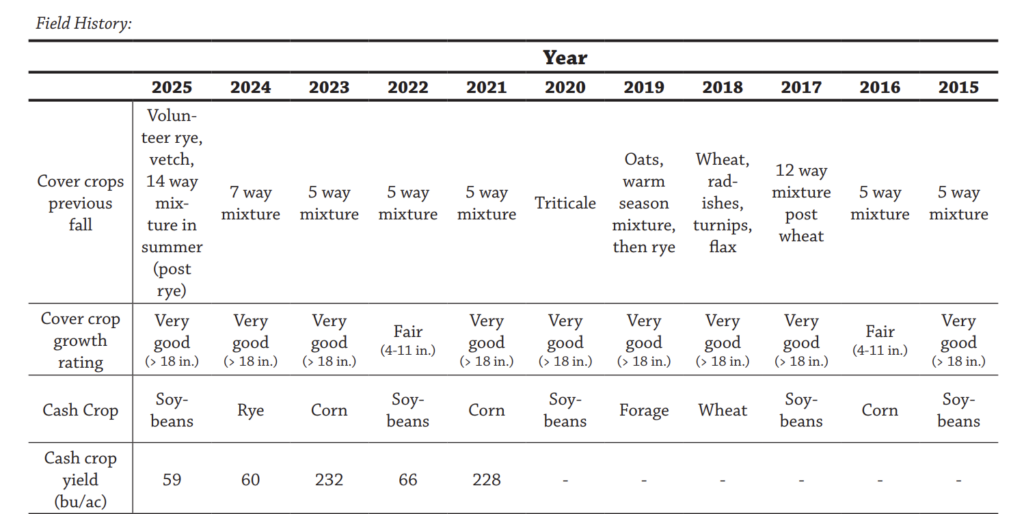
McDonald reported a total of 164 days suitable for fieldwork from 04/06 to 11/23, while the NE state average had 153 days suitable for fieldwork over the same period. By season, McDonald reported 65 days suitable in early spring compared with 58 for the NE state average; 68 days in summer compared with 64; and 31 days in fall compared with 31.
Appendix T – Laban Miller; Leon, IA
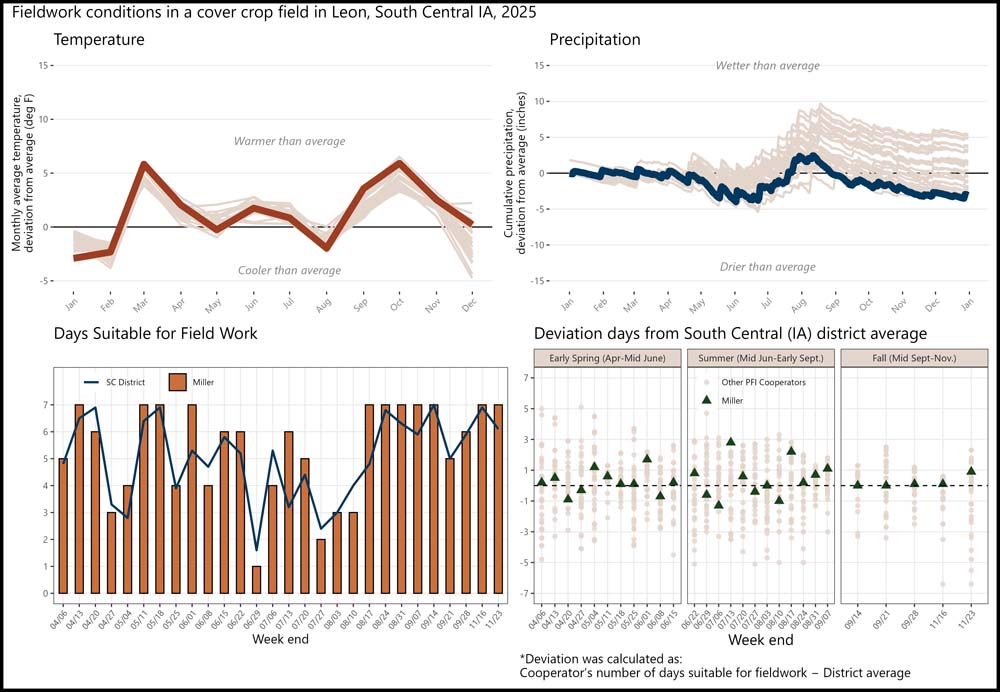
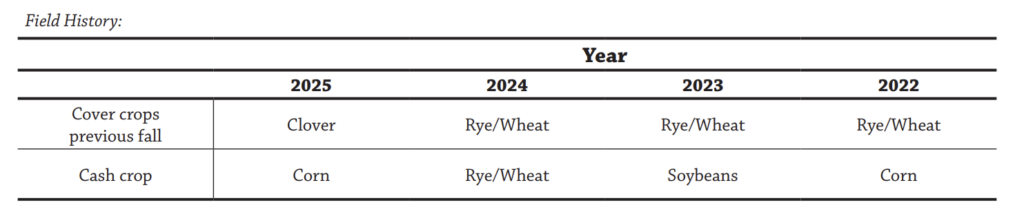
Miller reported a total of 150 days suitable for fieldwork from 04/06 to 11/23, while the south central district had 141 days suitable for fieldwork over the same period. By season, Miller reported 60 days suitable in early spring compared with 57 for the south central district; 58 days in summer compared with 53; and 32 days in fall compared with 31.
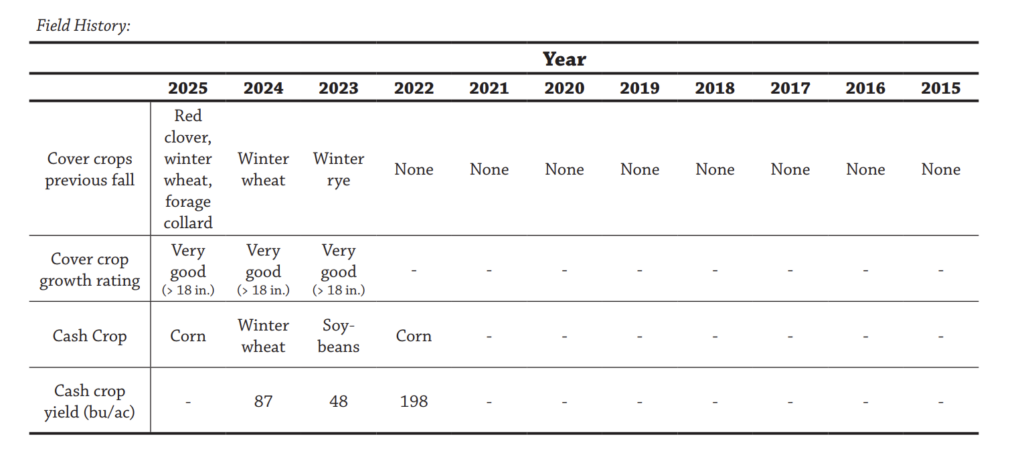
Appendix U – Kyle Nilsestuen; Arcadia, WI
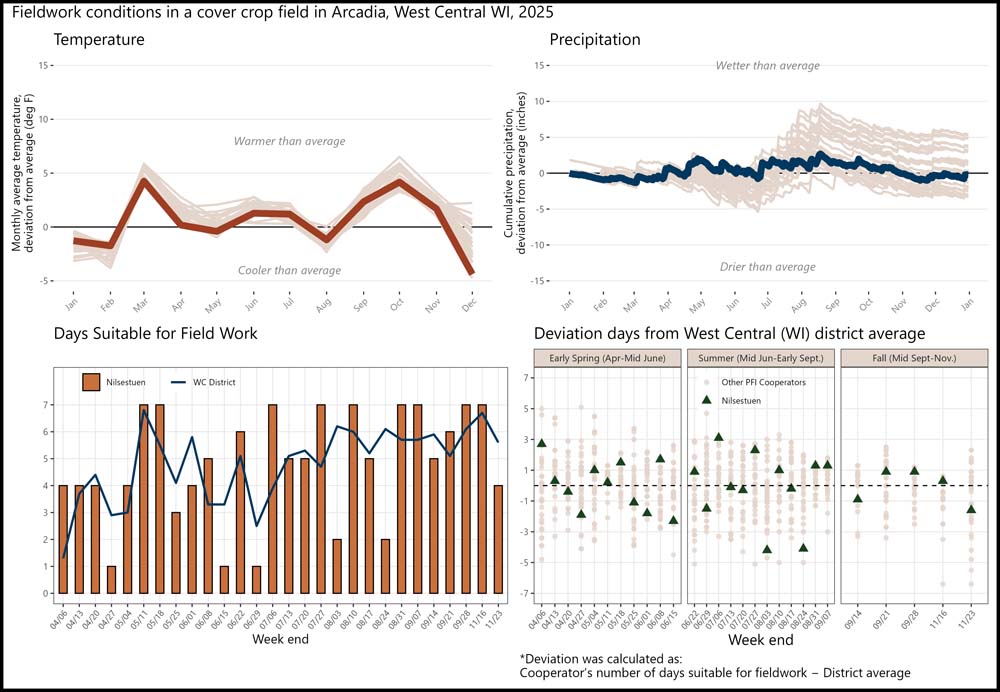
Nilsestuen reported a total of 134 days suitable for fieldwork from 04/06 to 11/23, while the west central district had 135 days suitable for fieldwork over the same period. By season, Nilsestuen reported 44 days suitable in early spring compared with 44 for the west central district; 61 days in summer compared with 62; and 29 days in fall compared with 29.
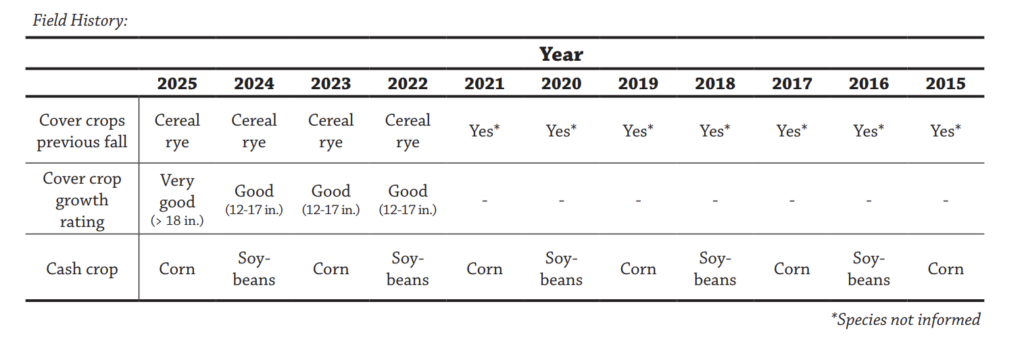
Appendix V – David Oberbroeckling; Davenport, IA
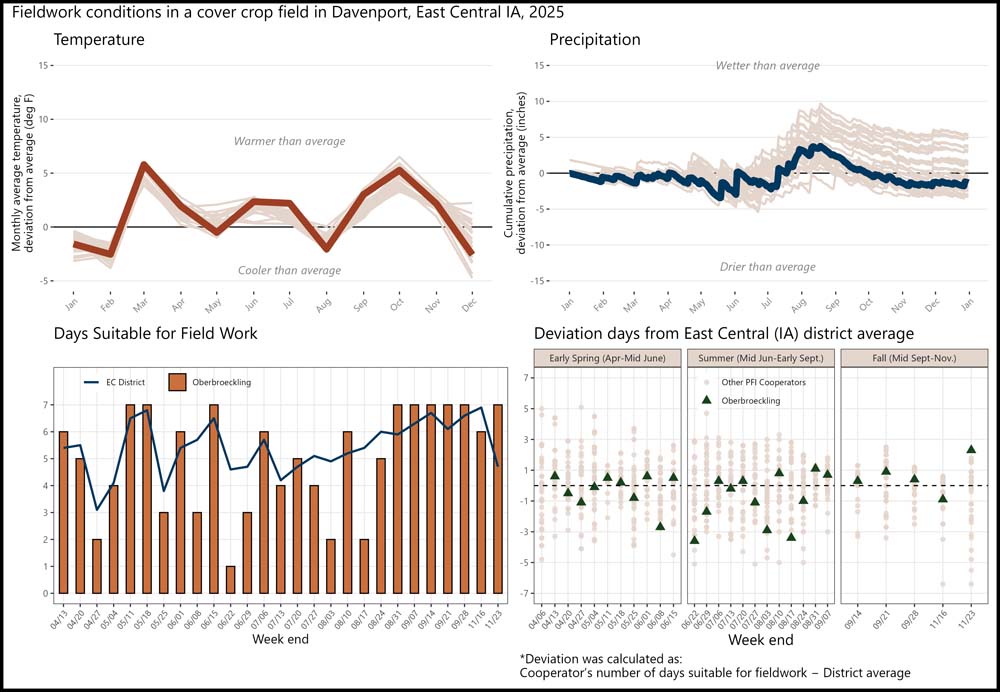
Oberbroeckling reported a total of 136 days suitable for fieldwork from 04/13 to 11/23, while the east central district had 146 days suitable for fieldwork over the same period. By season, Oberbroeckling reported 50 days suitable in early spring compared with 53 for the east central district; 52 days in summer compared with 63; and 34 days in fall compared with 31.
Appendix W – Lucas Olen; Mora, MN
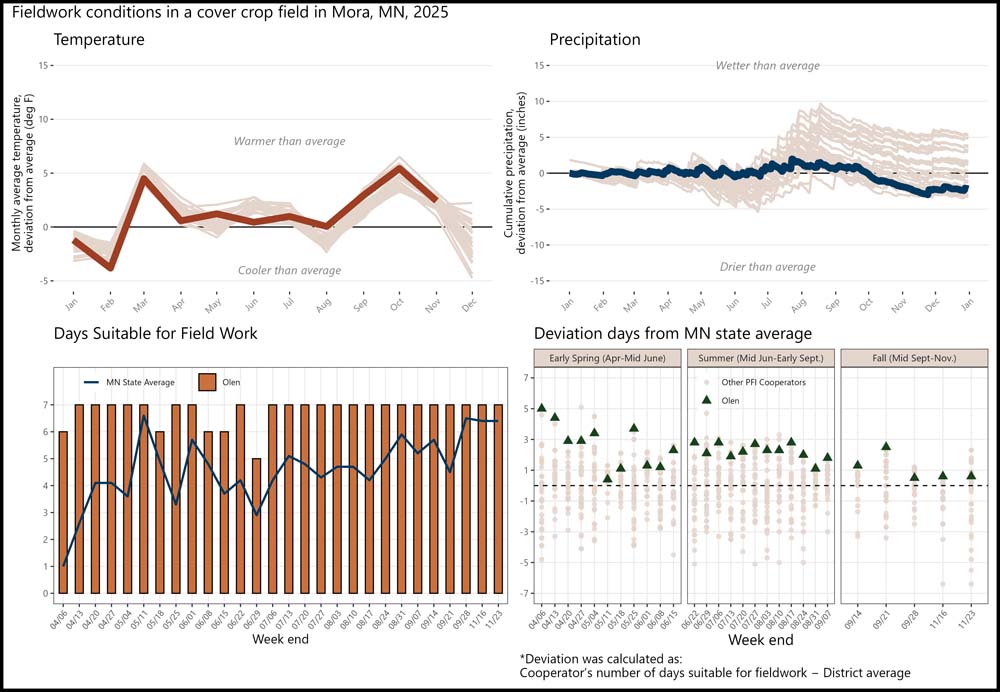
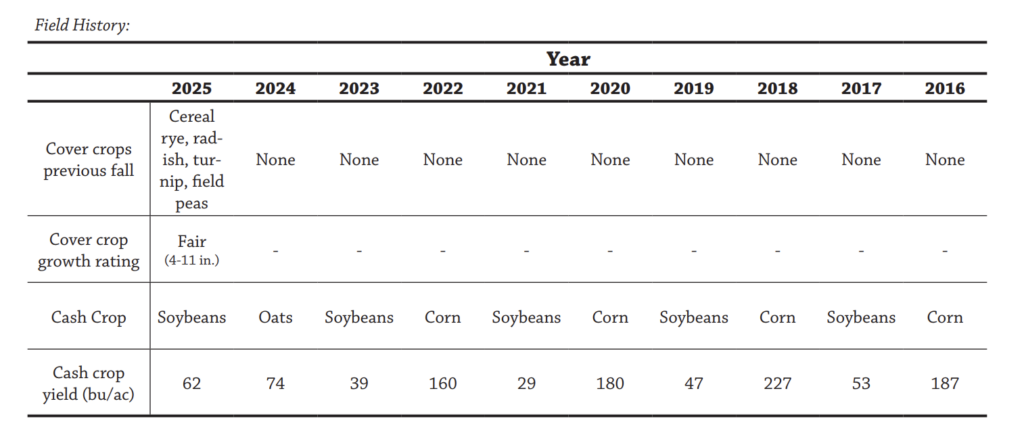
Olen reported a total of 190 days suitable for fieldwork from 04/06 to 11/23, while the MN state average had 129 days suitable for fieldwork over the same period. By season, Olen reported 73 days suitable in early spring compared with 44 for the MN state average; 82 days in summer compared with 55; and 35 days in fall compared with 30.
Appendix X – Matt Ollendieck; La Porte City, IA
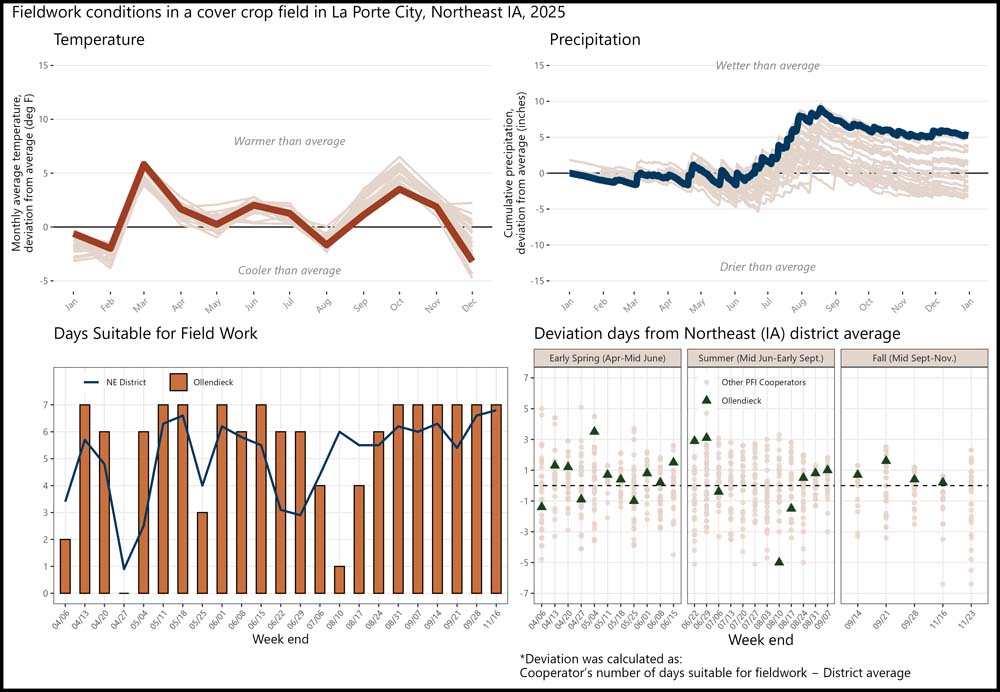
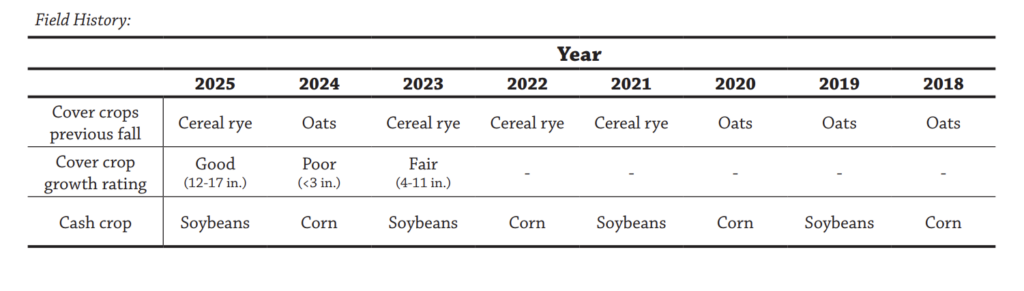
Ollendieck reported a total of 127 days suitable for fieldwork from 04/06 to 11/16, while the northeast district had 116 days suitable for fieldwork over the same period. By season, Ollendieck reported 58 days suitable in early spring compared with 52 for the northeast district; 41 days in summer compared with 40; and 28 days in fall compared with 25.
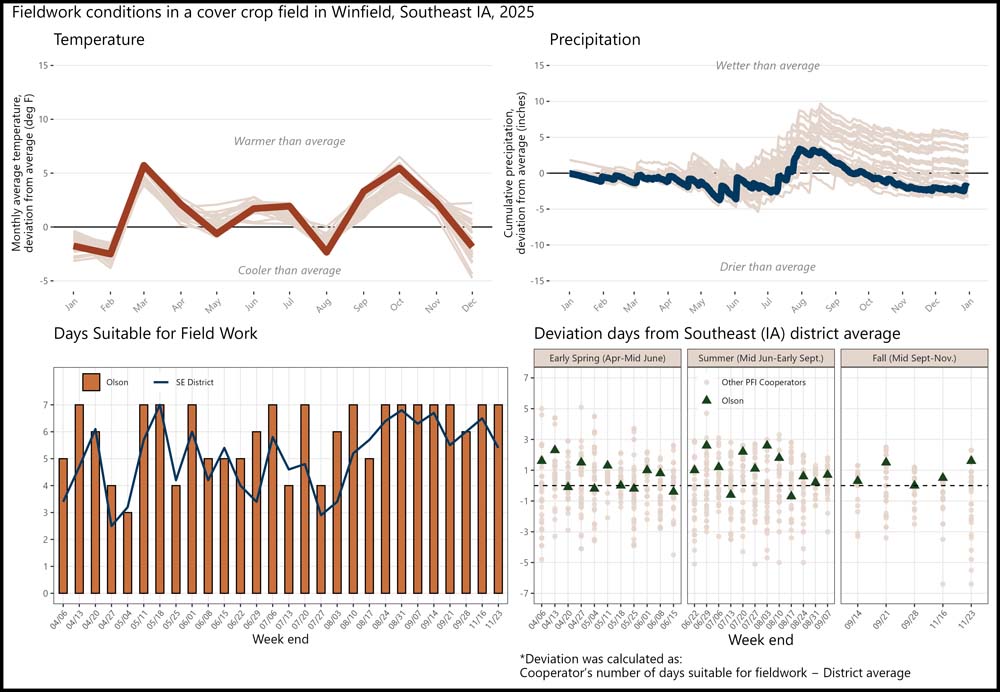
Appendix Y – Jeff Olson; Winfield, IA
Olson reported a total of 166 days suitable for fieldwork from 04/06 to 11/23, while the southeast district had 142 days suitable for fieldwork over the same period. By season, Olson reported 60 days suitable in early spring compared with 52 for the southeast district; 72 days in summer compared with 59; and 34 days in fall compared with 30.
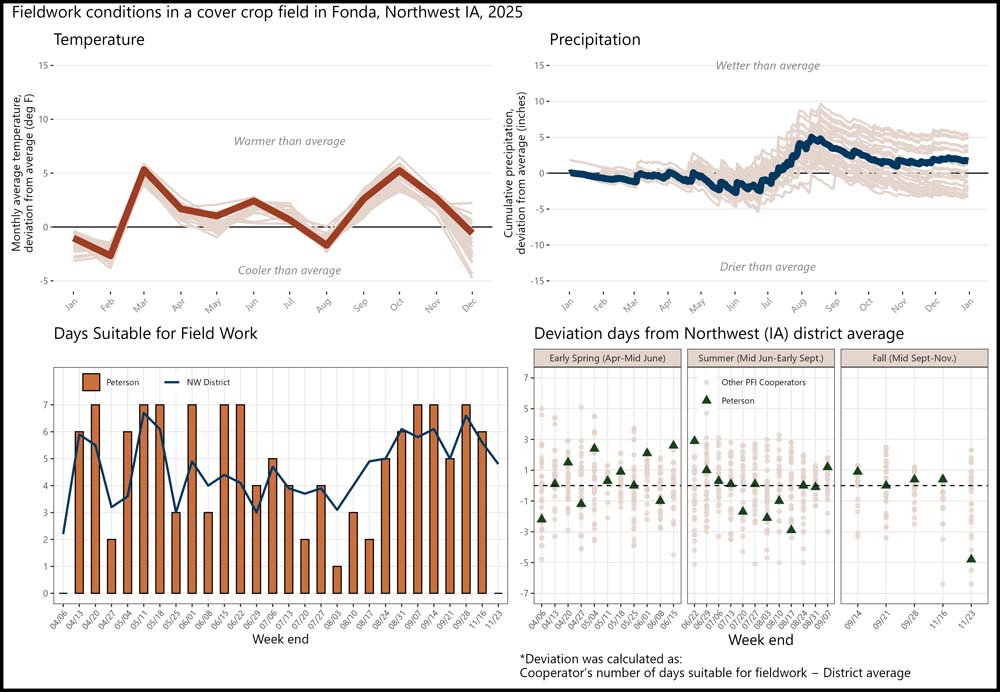
Appendix Z – Neil Peterson; Fonda, IA
Peterson reported a total of 130 days suitable for fieldwork from 04/06 to 11/23, while the northwest district also had 130 days suitable for fieldwork over the same period. By season, Peterson reported 55 days suitable in early spring compared with 50 for the northwest district; 50 days in summer compared with 52; and 25 days in fall compared with 28.
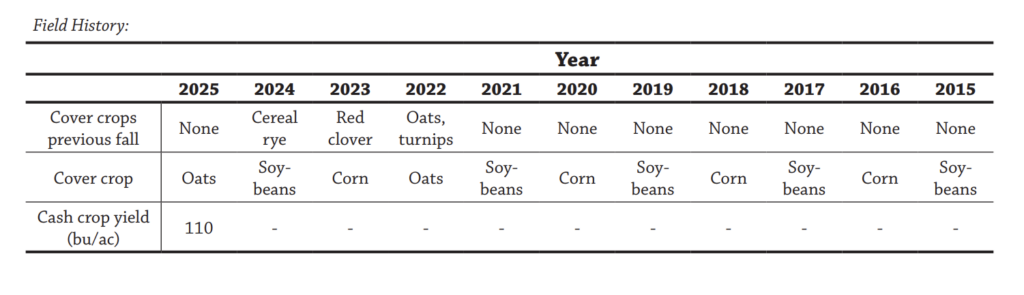
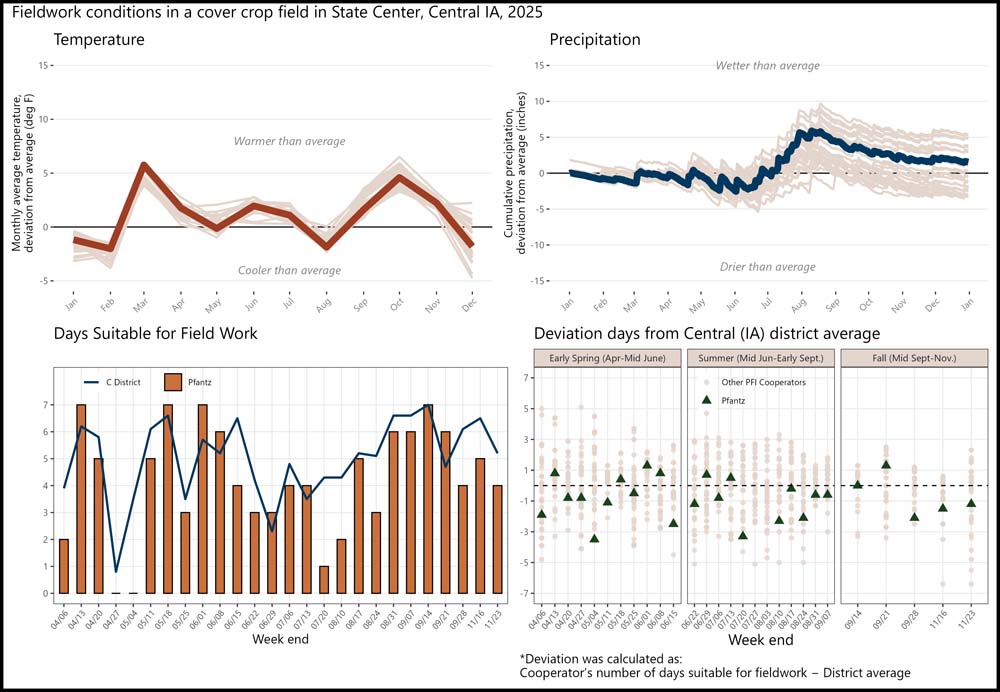
Appendix AA – Craig Pfantz; State Center, IA
Pfantz reported a total of 109 days suitable for fieldwork from 04/06 to 11/23, while the central district had 130 days suitable for fieldwork over the same period. By season, Pfantz reported 46 days suitable in early spring compared with 54 for the central district; 37 days in summer compared with 47; and 26 days in fall compared with 30.
Appendix AB – Max Pitt; Lamoni, IA
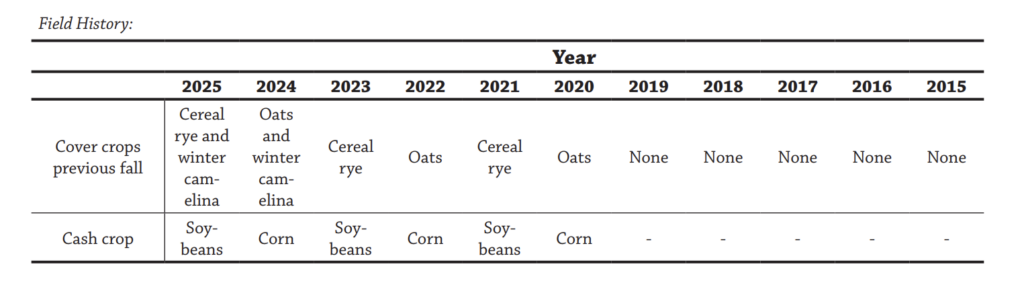
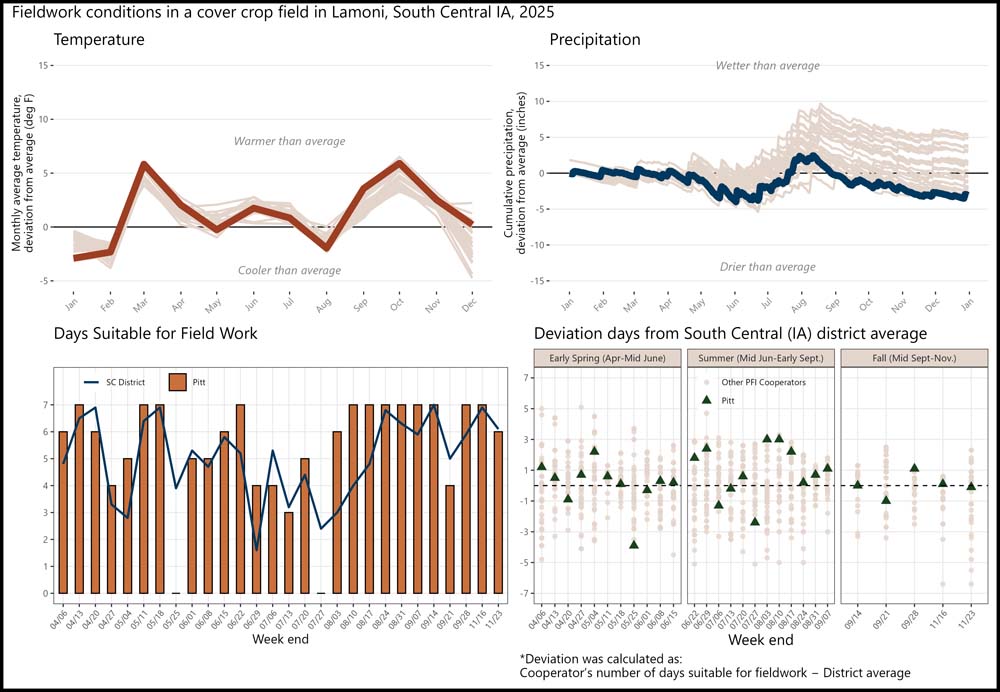
Pitt reported a total of 153 days suitable for fieldwork from 04/06 to 11/23, while the south central district had 141 days suitable for fieldwork over the same period. By season, Pitt reported 58 days suitable in early spring compared with 57 for the south central district; 64 days in summer compared with 53; and 31 days in fall compared with 31.
Appendix AC – Kevin Prevo; Bloomfield, IA
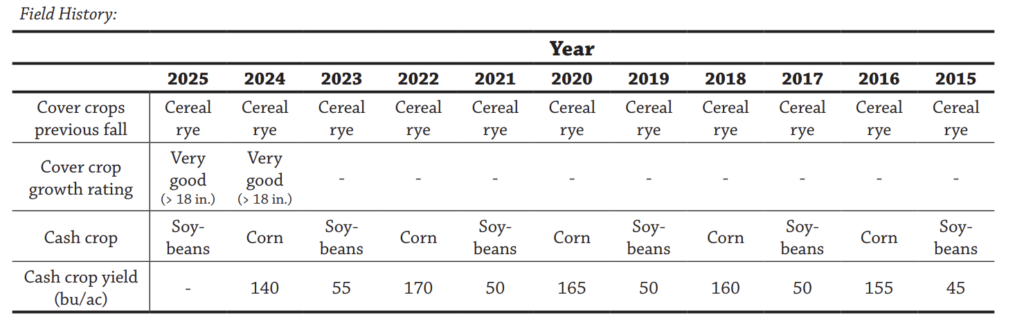
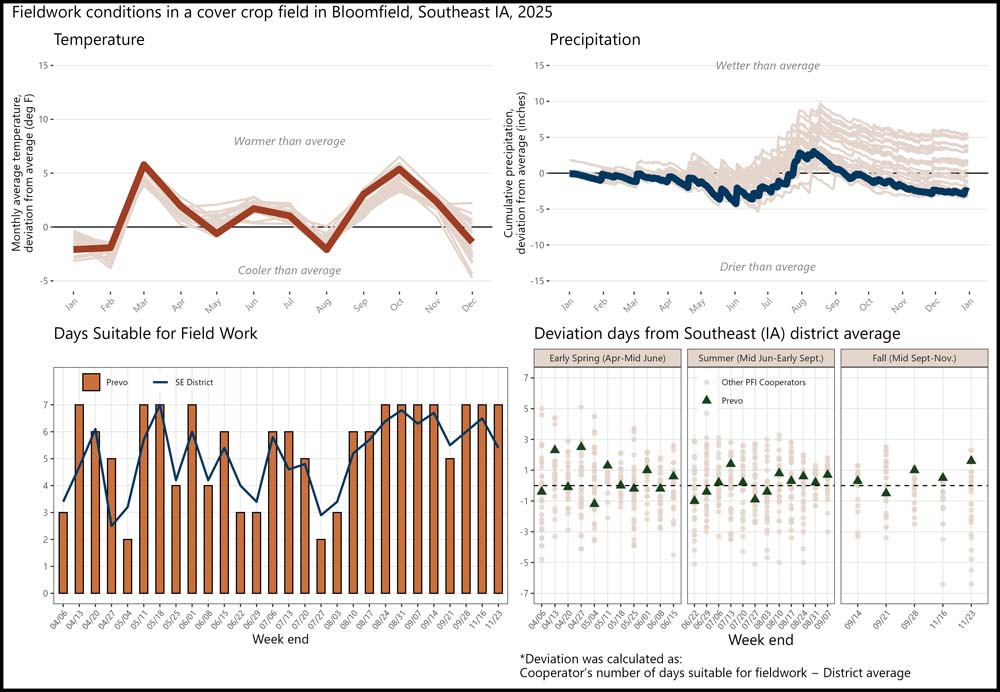
Prevo reported a total of 152 days suitable for fieldwork from 04/06 to 11/23, while the southeast district had 142 days suitable for fieldwork over the same period. By season, Prevo reported 58 days suitable in early spring compared with 52 for the southeast district; 61 days in summer compared with 59; and 33 days in fall compared with 30.
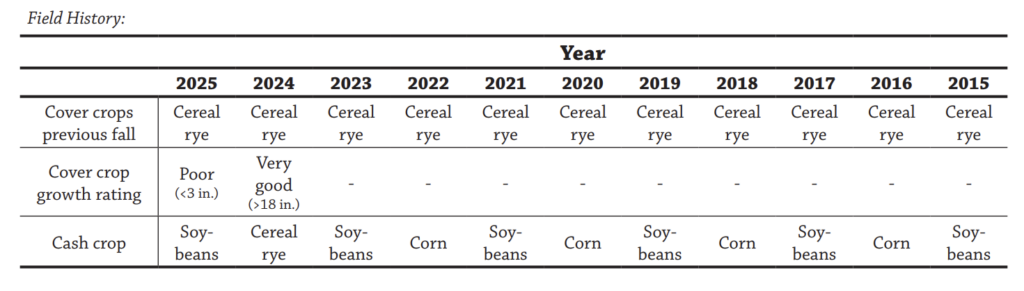
Appendix AD – William Roller; Anamosa, IA
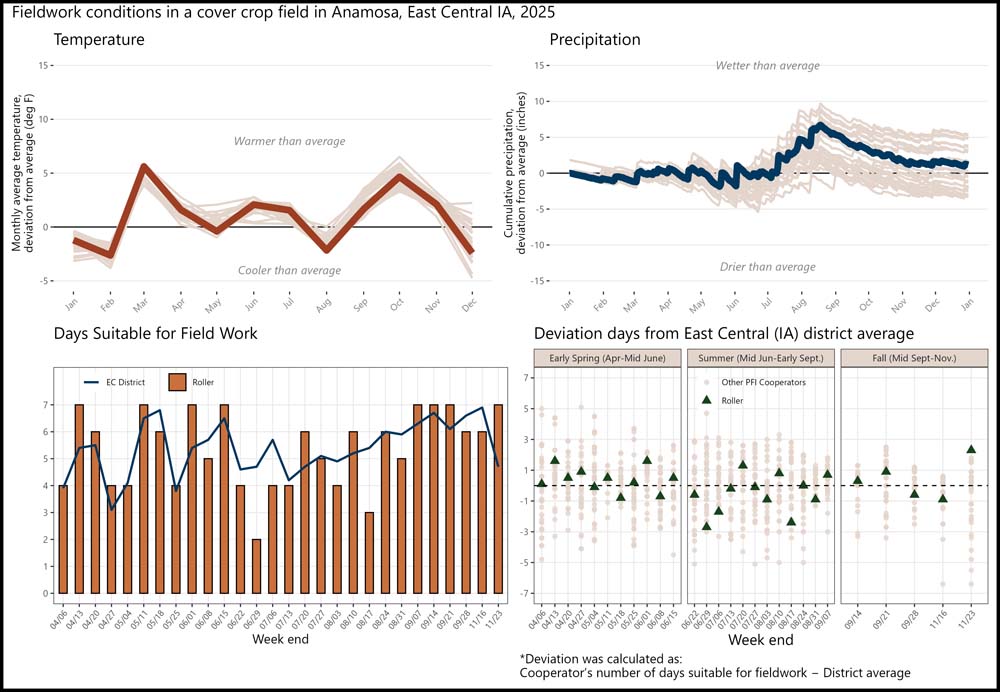
Roller reported a total of 150 days suitable for fieldwork from 04/06 to 11/23, while the east central district had 150 days suitable for fieldwork over the same period. By season, Roller reported 61 days suitable in early spring compared with 57 for the east central district; 56 days in summer compared with 63; and 33 days in fall compared with 31.
Appendix AE – Dennis Rossiter; Saint Peter, MN
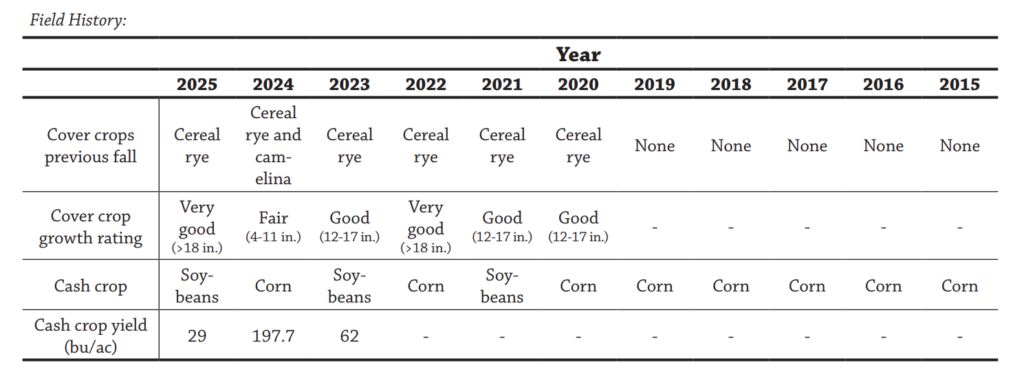
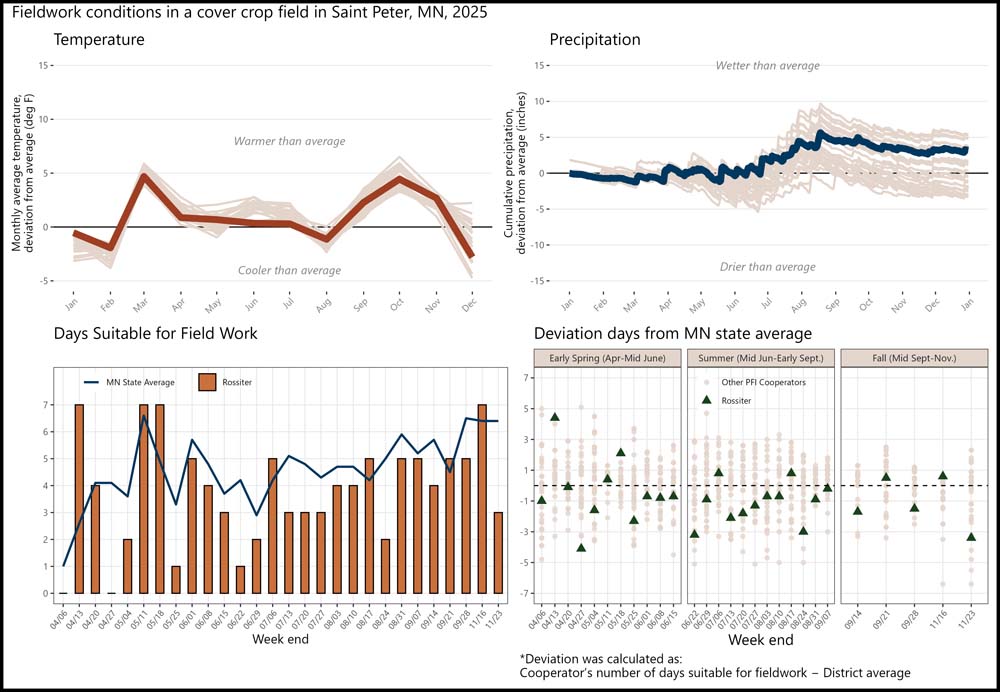
Rossiter reported a total of 106 days suitable for fieldwork from 04/06 to 11/23, while the MN state average had 129 days suitable for fieldwork over the same period. By season, Rossiter reported 40 days suitable in early spring compared with 44 for the MN state average; 42 days in summer compared with 55; and 24 days in fall compared with 30.
Appendix AF – Joe Rowe; Manly, IA
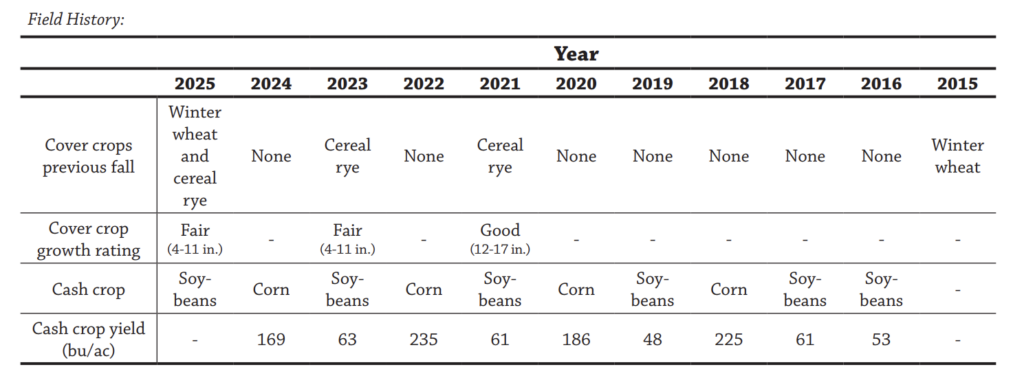
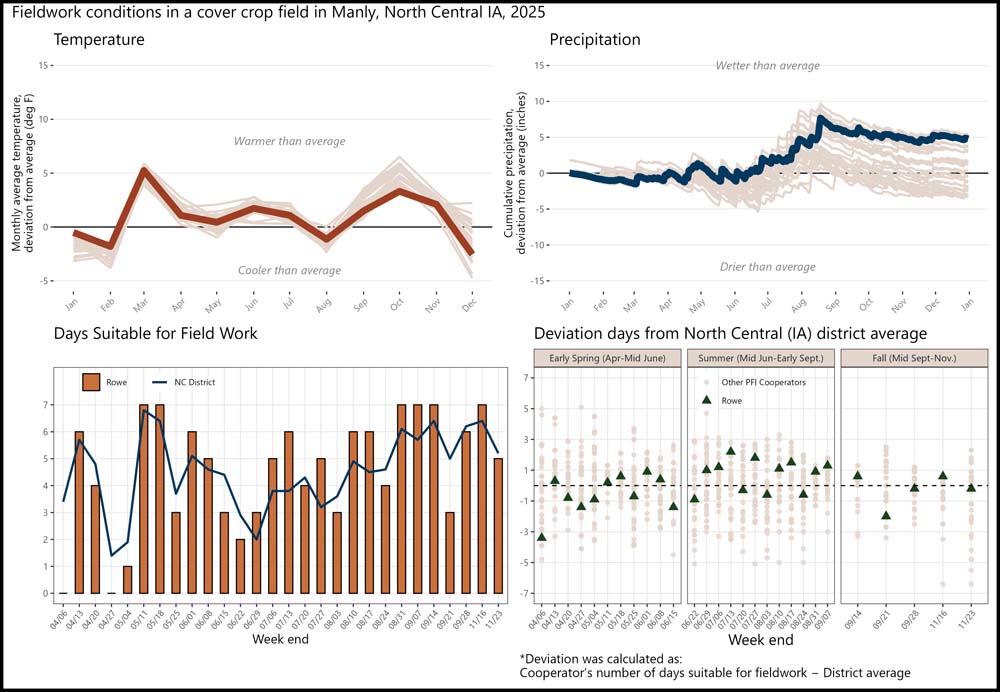
Rowe reported a total of 128 days suitable for fieldwork from 04/06 to 11/23, while the north central district had 127 days suitable for fieldwork over the same period. By season, Rowe reported 42 days suitable in early spring compared with 48 for the north central district; 58 days in summer compared with 49; and 28 days in fall compared with 29.
Appendix AG – William Schreurs; Alvord, IA
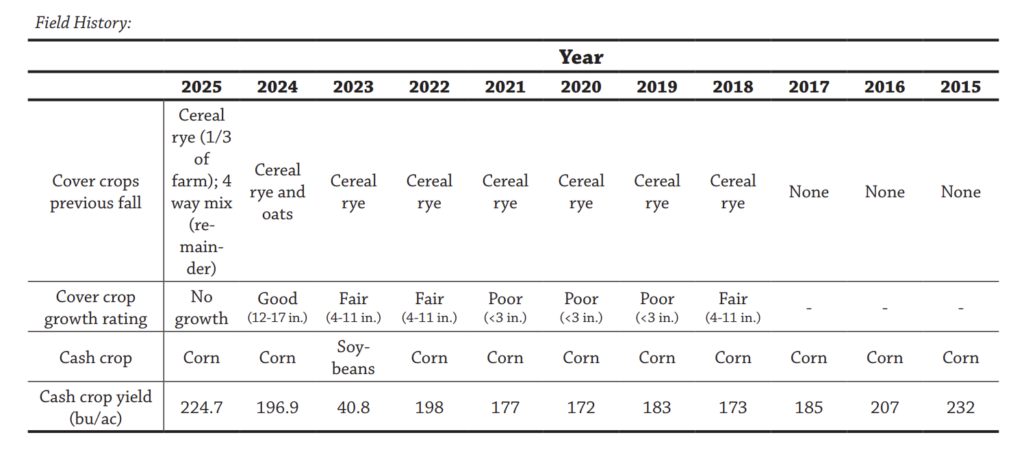
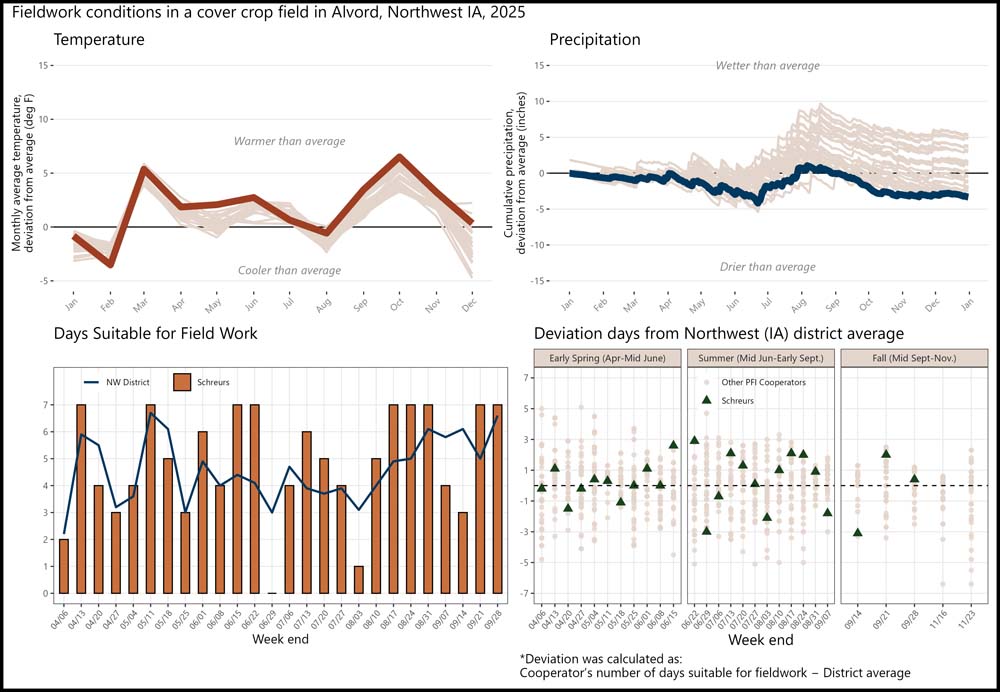
Schreurs reported a total of 126 days suitable for fieldwork from 04/06 to 09/28, while the northwest district had 119 days suitable for fieldwork over the same period. By season, Schreurs reported 52 days suitable in early spring compared with 50 for the northwest district; 57 days in summer compared with 52; and 17 days in fall compared with 18.
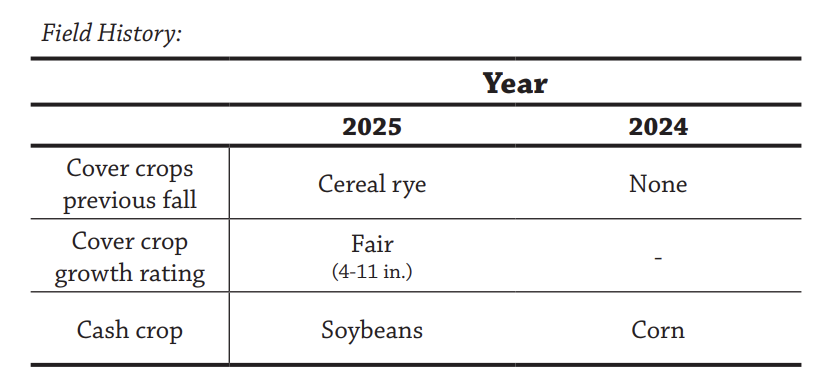
Appendix AH – Phil Schwantz; Altura, MN
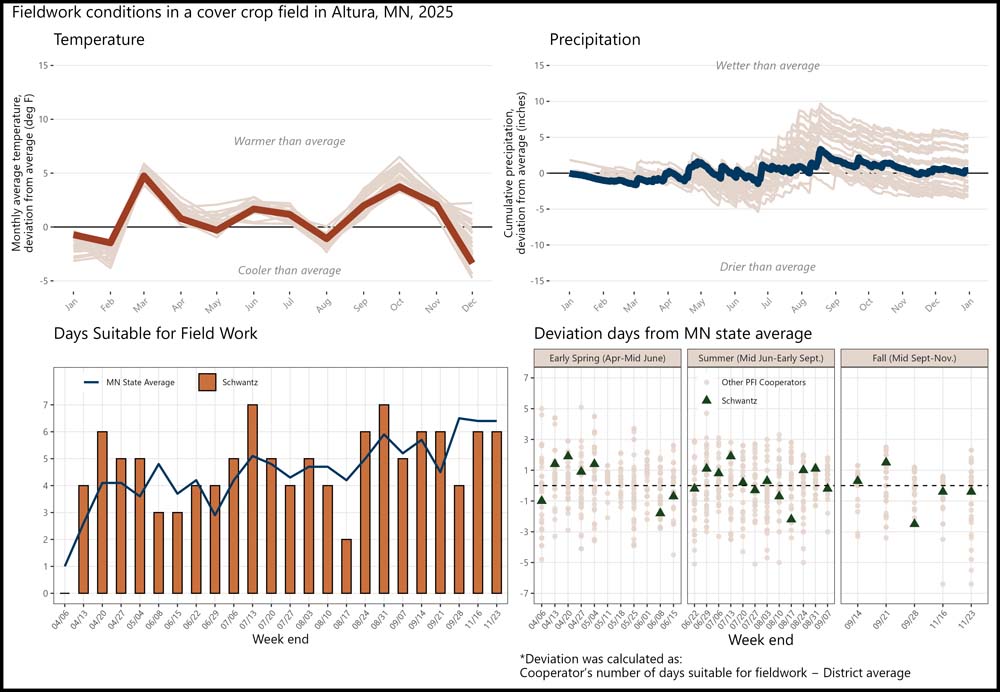
Schwantz reported a total of 112 days suitable for fieldwork from 04/06 to 11/23, while the MN state average had 109 days suitable for fieldwork over the same period. By season, Schwantz reported 26 days suitable in early spring compared with 24 for the MN state average; 58 days in summer compared with 55; and 28 days in fall compared with 30.
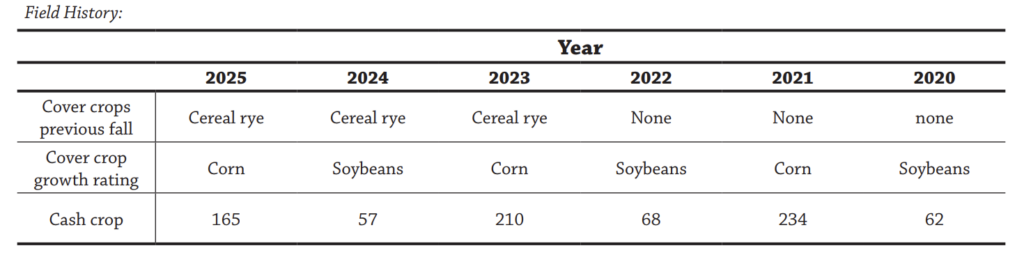
Appendix AI – Bailey Scott Hobbs; Dunnell, MN
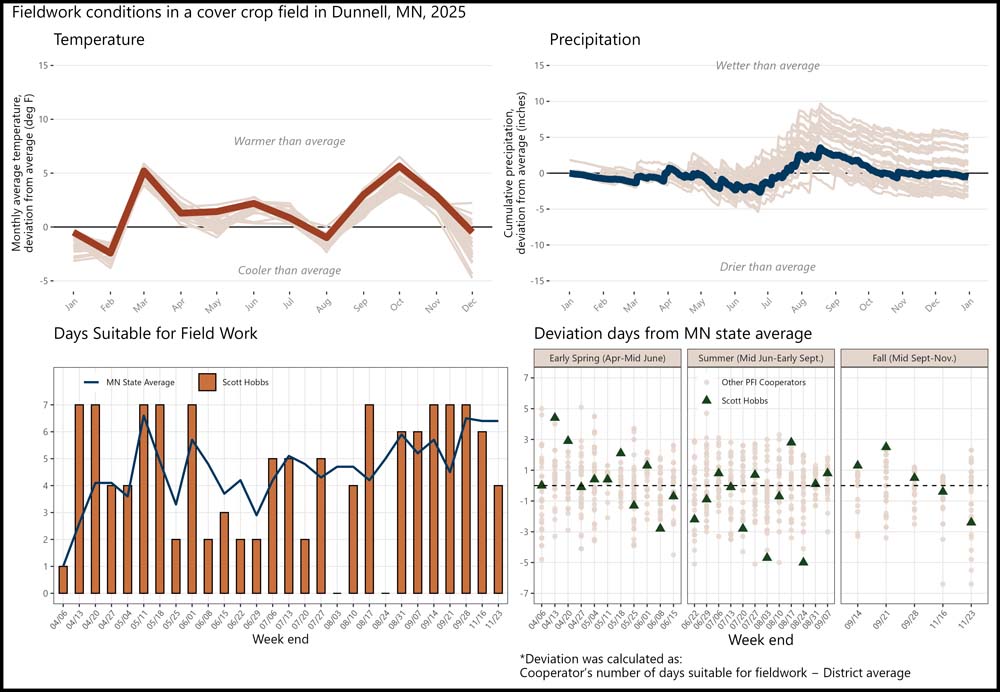
Scott Hobbs reported a total of 126 days suitable for fieldwork from 04/06 to 11/23, while the MN state average had 129 days suitable for fieldwork over the same period. By season, Scott Hobbs reported 51 days suitable in early spring compared with 44 for the MN state average; 44 days in summer compared with 55; and 31 days in fall compared with 30.
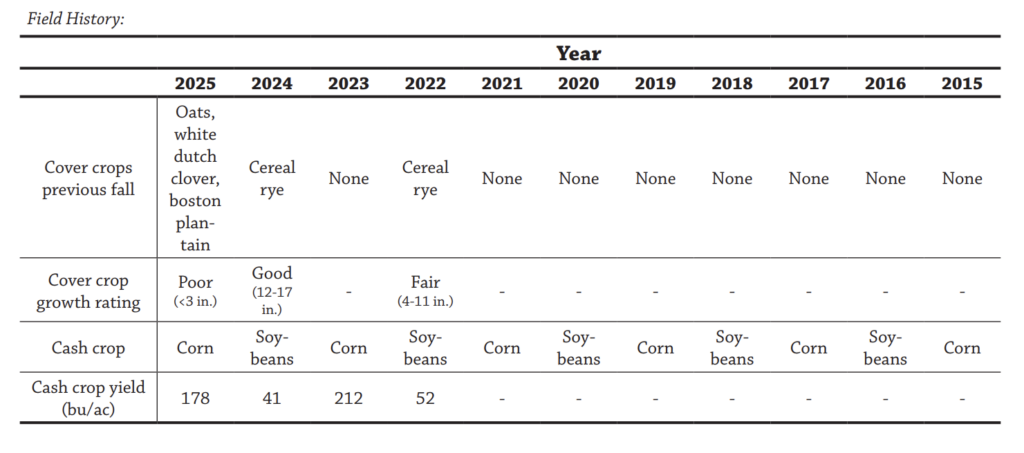
Appendix AJ – Kyle Spowart; Tripoli, IA
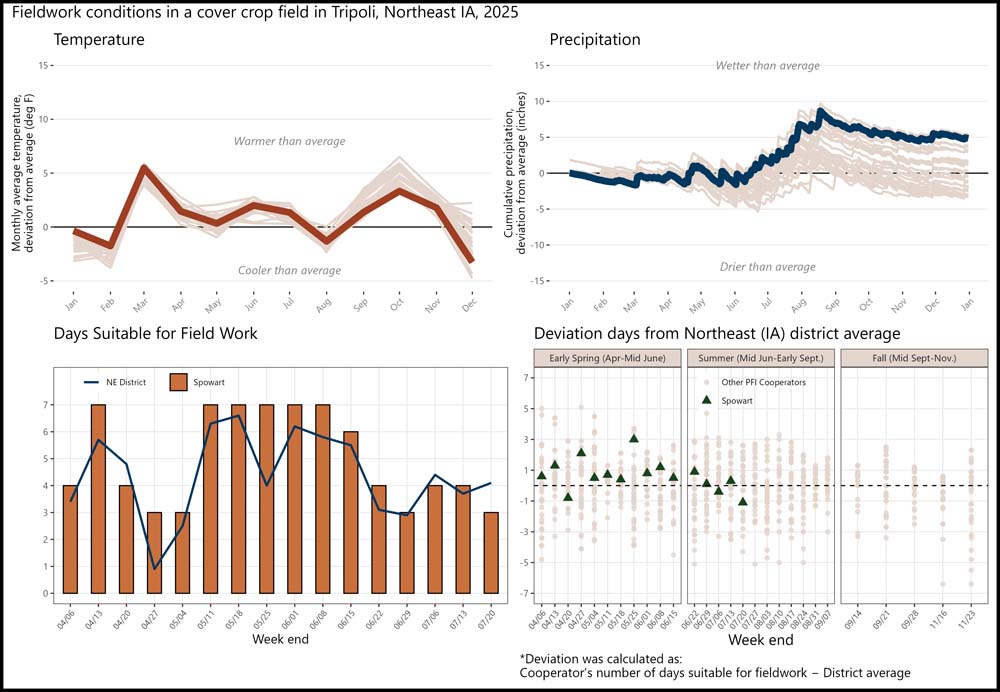
Spowart reported a total of 80 days suitable for fieldwork from 04/06 to 07/20, while the northeast district had 70 days suitable for fieldwork over the same period. By season, Spowart reported 62 days suitable in early spring compared with 52 for the northeast district.
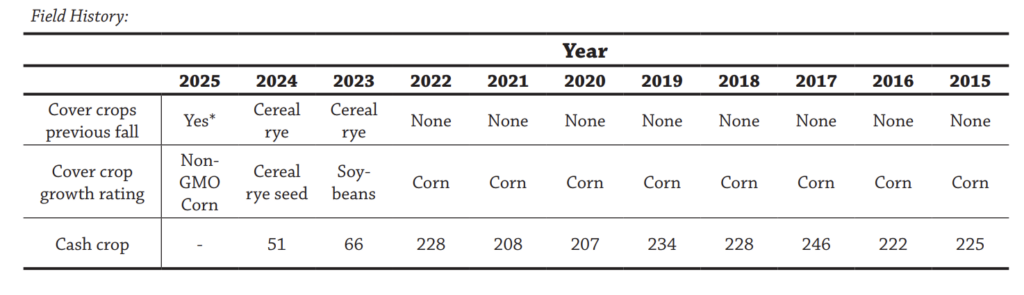
Appendix AK – Bob Sullivan; Woodbine, IA
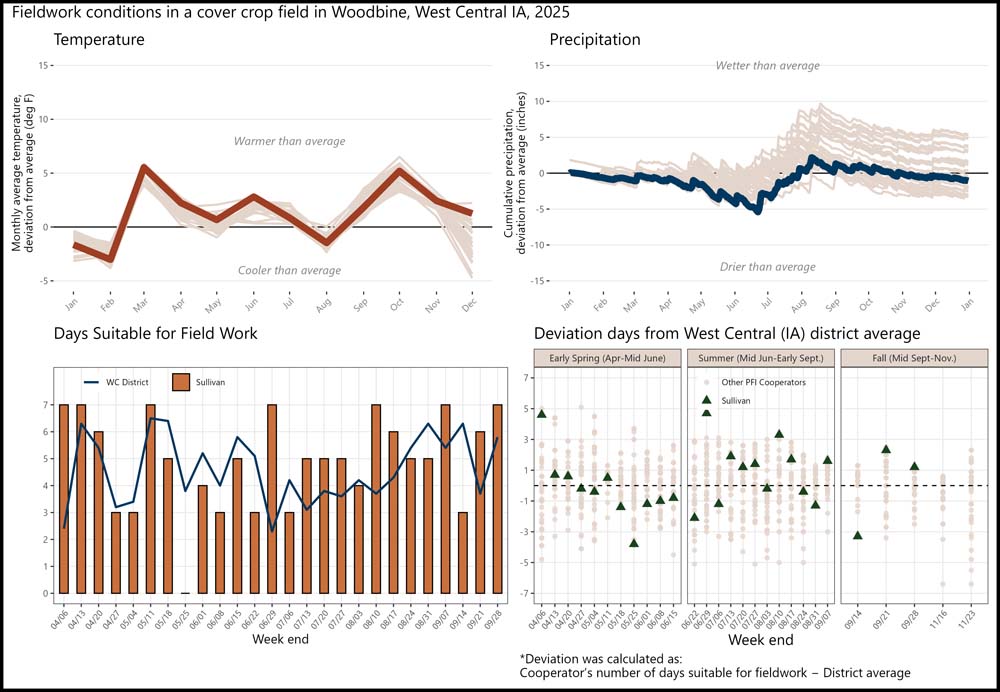
Sullivan reported a total of 128 days suitable for fieldwork from 04/06 to 11/09, while the west central district had 120 days suitable for fieldwork over the same period. By season, Sullivan reported 50 days suitable in early spring compared with 52 for the west central district; 62 days in summer compared with 51; and 16 days in fall compared with 16.
Appendix AL – Brian Voss; Palo, IA
Voss reported a total of 154 days suitable for fieldwork from 04/06 to 11/23, while the east central district had 150 days suitable for fieldwork over the same period. By season, Voss reported 58 days suitable in early spring compared with 57 for the east central district; 64 days in summer compared with 63; and 32 days in fall compared with 31.
Appendix AM – Detailed Methods
Weather Data
Each cooperator chose a US Census-recognized town with which to associate their trial. The latitude and longitude of the chosen town were used to retrieve weather data from the National Aeronautics and Space Administration (NASA) Prediction of Worldwide Energy Resources (POWER) project using the nasapower package [12] for R software [16]. Data was downloaded for the period spanning January 1, 1995 through December 31, 2025. Two weather variables were used: (1) cumulative daily precipitation values and (2) the average daily air temperature at two meters above ground level. The weather data was separated into two data sets: one comprising the entire 30 years of data (historical weather data), and one containing only data from January 1 – December 31, 2025 (trial year data).
To provide context for each trial’s temperatures, the historical mean temperature for month at a given site was calculated using the historical weather dataset. The historical value was subtracted from the trial year average temperature for that month to provide an estimate of the deviation from average conditions.
References
- “USDA - National Agricultural Statistics Service - Publications - National Crop Progress - Terms and Definitions.” Accessed: Apr. 09, 2025. [Online]. Available: https://www.nass.usda.gov/Publications/National_Crop_Progress/Terms_and_Definitions/index.php#days
- W. Edwards and M. Hanna, “Days Suitable for Fieldwork in Iowa,” Iowa State Univ. Ext., 2020, [Online]. Available: https://www.extension.iastate.edu/agdm/crops/pdf/a3-25.pdf
- A. Johanns, “Days Suitable for Fieldwork in Iowa,” Iowa State Univ. Ext., 2025, [Online]. Available: extension.iastate.edu/agdm store.extension.iastate.edu
- S. Won, R. M. Rejesus, B. K. Goodwin, and S. Aglasan, “Understanding the effect of cover crop use on prevented planting losses,” Am. J. Agric. Econ., vol. 106, no. 2, pp. 659–683, Mar. 2024, doi: 10.1111/ajae.12396.
- S. Aglasan, R. M. Rejesus, S. Hagen, and W. Salas, “Cover crops, crop insurance losses, and resilience to extreme weather events,” Am. J. Agric. Econ., p. ajae.12431, Oct. 2023, doi: 10.1111/ajae.12431.
- “USDA - National Agricultural Statistics Service - Iowa - Crop Progress and Condition.” Accessed: Apr. 10, 2025. [Online]. Available: https://www.nass.usda.gov/Statistics_by_State/Iowa/Publications/Crop_Progress_&_Condition/
- “USDA - National Agricultural Statistics Service - Minnesota - Crop Progress and Condition Reports.” Accessed: Apr. 10, 2025. [Online]. Available: https://www.nass.usda.gov/Statistics_by_State/Minnesota/Publications/Crop_Progress_&_Condition/
- “USDA - National Agricultural Statistics Service - Nebraska - 2024 Crop Progress and Condition.” Accessed: Apr. 22, 2026. [Online]. Available: https://www.nass.usda.gov/Statistics_by_State/Nebraska/Publications/Crop_Progress_&_Condition/
- “USDA - National Agricultural Statistics Service - Wisconsin - Crop Progress and Condition Report.” Accessed: Apr. 10, 2025. [Online]. Available: https://www.nass.usda.gov/Statistics_by_State/Wisconsin/Publications/Crop_Progress_&_Condition/
- T. Vilsack, “2022 Census of Agriculture United States Summary and State Data,” United States Department of Agriculture National Agriculture Statistics Service, AC-22-A-51, Feb. 2024. [Online]. Available: https://www.nass.usda.gov/Publications/AgCensus/2022/index.php
- B. Gleason, “2017-2023 Nutrient Reduction Survey Results,” Iowa Nutrient Research + Education Council. Accessed: Apr. 15, 2025. [Online]. Available: https://iowanrec.org/2017-2023-nutrient-reduction-survey-results/
- J. G. Arbuckle Jr. and G. Roesch-McNally, “Cover crop adoption in Iowa: The role of perceived practice characteristics,” J. Soil Water Conserv., vol. 70, no. 6, pp. 418–429, Nov. 2015, doi: 10.2489/jswc.70.6.418.
- M. Beetstra, R. Wilson, and E. Toman, “The influence of the seasons: how the agricultural calendar impacts farmer perceptions of cover crops,” Renew. Agric. Food Syst., vol. 37, no. 3, pp. 187–197, Jun. 2022, doi: 10.1017/S1742170521000521.
- L. S. Prokopy et al., “Adoption of agricultural conservation practices in the United States: Evidence from 35 years of quantitative literature,” J. Soil Water Conserv., vol. 74, no. 5, pp. 520–534, Sep. 2019, doi: 10.2489/jswc.74.5.520.
- M. Dunn, J. D. Ulrich-Schad, L. S. Prokopy, R. L. Myers, C. R. Watts, and K. Scanlon, “Perceptions and use of cover crops among early adopters: Findings from a national survey,” J. Soil Water Conserv., vol. 71, no. 1, pp. 29–40, Jan. 2016, doi: 10.2489/jswc.71.1.29.
- R Core Team, “R: A language and environment for statistical computing.” R Foundation for Statistical Computing, Vienna, Austria, 2022. Accessed: Mar. 28, 2024. [Online]. Available: https://www.r-project.org/