A Financial Analysis of Conversion to Habitat
In part one of this blog series, I mentioned signing up for two different conservation programs in areas that were identified as underperforming row crop areas. There are multiple ways to do a financial analysis of this decision. The easiest thing to do is talk with a precision conservation specialist at Pheasants Forever.
Stephanie Nelson is the contact for Iowa, and BJ Werks is the representative for Minnesota. Their contact information is at the bottom of this article. They will take you through a precision conservation analysis that is customized for your farm operation.
How to Determine the Profitability of Habitat
I will explain my thought process as a landowner and farm manager. To determine profitability, we must know three things: cost of production, yield and commodity price.
In the example below, I will use a yield map from a farm my family owns in Madison County, Iowa. I would not make a decision based on one year of data but I thought this example of a yield map during a drought year would show why a financial analysis is important.
Iowa State University Extension and Outreach publishes a report on the estimated costs of crop production on their website. I chose corn following beans under the 182 bushels per acre scenario.
This scenario has a lower cost than the 202 and 222 bushel per acre scenarios. Each farmer will have a different cost of production and it will likely change annually based on fertilizer, seed, machinery, herbicide cost, etc.
The 2023 ISU cost of corn production is $883 per acre. The $883 cost of production includes $242 per acre for cash rent for land. To determine the cost of production without cash rent for land, simply subtract the cost of production ($883) from the cash rent cost ($242).
Revenue can be calculated by multiplying the yield by the commodity price. I will use $5 per bushel for this example. The yield under the bushels category was determined by taking the median of the range from the yield map. For example, the range of yield for orange is 62-91. I used 76 as the median bushels per acre for areas mapped in orange.
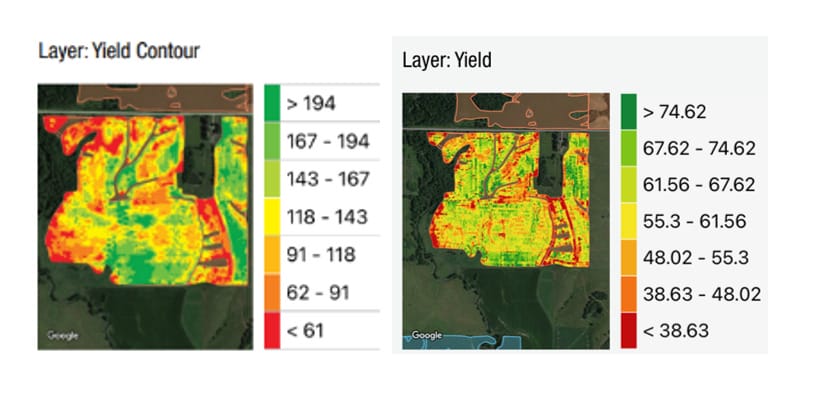
Table 1: Profit and loss based on $883 cost of production.
| Map Color | Bushels per acre | Corn Price | Revenue per acre | Profit or loss per acre |
| Red | 60 | $5 | $300 | -$583 |
| Orange | 76 | $5 | $380 | -$503 |
| Light orange | 104 | $5 | $520 | -$363 |
| Yellow | 130 | $5 | $650 | -$233 |
| Light green | 155 | $5 | $775 | -$108 |
| Medium green | 180 | $5 | $900 | +$17 |
| Dark green | 200 | $5 | $1,000 | +$117 |
There are several variables that can change the profitability equation. The price of corn (or beans) can certainly change. If you know your cost of production, you divide the price of corn into that to get the break-even yield. If the yield on your map is over that amount, that area is profitable; if it is below the break-even yield, you are losing money from that area. If you look at several years of yield maps and an area is consistently under 100 bushels per acre for corn, then it is losing money based on the price of corn.
Table 2: Calculating break-even yield.
| Cost of production | Price of corn | Break-even yield |
| $883 | $5 | = 176 bushels/acre |
| $833 | $6 | = 147 bushels/acre |
| $883 | $7 | = 126 bushels/acre |
Determining break-even price is another important calculation. Divide the cost of production by the yield to get break-even price. If you know certain areas of a field never produce more than 150 bushels per acre and the price of corn is below $5.88, then that area will be losing money.
Table 3: Calculating break-even price.
| Cost of production | Yield | Break-even price |
| $883 | 150 bushels/acre | $5.88 |
| $883 | 165 bushels/acre | $5.35 |
| $883 | 180 bushels/acre | $4.90 |
All three variables, cost of production, yield and commodity price, change annually. You could even make the case that a farmer has only limited control over these three variables. However, a farmer must work hard to manage these variables to remain profitable.
Farmers are used to making things work and being innovative. However, if forced to say if they could make every acre profitable, I have to think they would say they could not.
Looking back up at the yield map and the Profit and Loss Calculation in Table 1, we can see the areas in red, orange, light orange, yellow and light green were unprofitable in 2022. I want to stress that 2022 was a drought year in Madison County and yields were abnormally poor. The 2023 soybean yield showed the entire field to be much more profitable. The 2022 yield map is being used for illustrative purposes only.
How to Decide What Areas to Remove From Production
The next step is to actually decide what area to take out of production. The map below shows 46 acres that would be converted to a Switchgrass RCPP (36 acres) and Quail SAFE CRP program (10 acres).
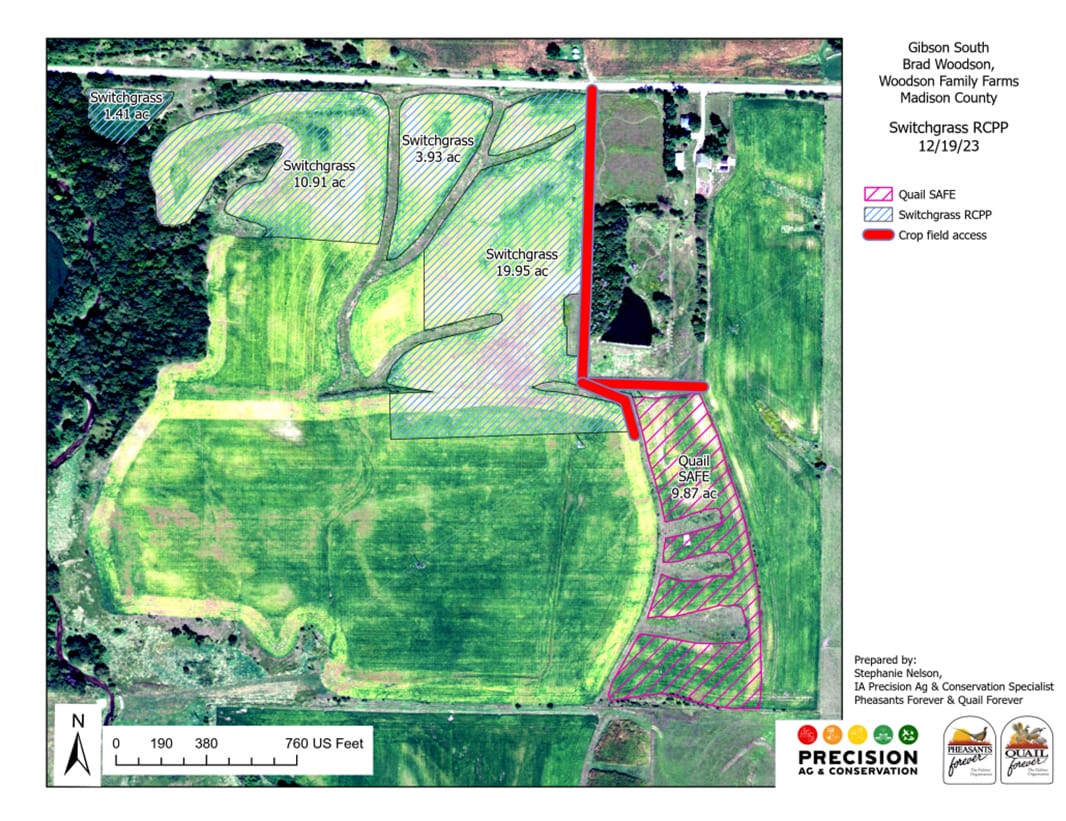
I estimated the acreage in each color from the corn yield map in Figure 1. The table below allows me to calculate the loss for the 46 acres we will take out of production. This equates to an average loss of $371 on 46 acres.
Table 4: Approximate loss from acres removed from production.
| Map Color | Profit or loss per acre | Acres | Profit or loss per area (color) |
| Red | -$583 | 15 | -$8,745 |
| Orange | -$503 | 8 | -$4,024 |
| Light orange | -$363 | 7 | -$2,541 |
| Yellow | -$233 | 7 | -$1,631 |
| Light green | -$108 | 4 | -$432 |
| Medium green | +$17 | 3 | +$51 |
| Dark green | +117 | 2 | +$234 |
| Total | 46 | -$17,088 |
How to Calculate the Profitability of Creating Habitat
We are finally at the point of calculating the profitability of creating habitat. The variables are the cost to plant and maintain the habitat, plus the rental rate.
When evaluating the cost of habit, we should look at the cost of seeding, planting and mowing. The seed cost for 10 acres of “Quail Safe” CRP, which is a diverse native seed mix with 7 short grass and 18 forb species, is $1,732.50.
The seeding and seedbed preparation are estimated at $1,954.50 and mowing to control weeds for two growing seasons is estimated at $372. There will also be an early successional small grain seeding every three years, which I am estimating at a total of $600. The total cost to establish and maintain this CRP acreage will be approximately $4,647.
Approximately 50% of these costs are covered by cost-share from FSA which brings my cost to $2,323.50. There is no cost-share for mid contract management, so I will only include the $500 cost of a mid-contract management burn at year five or six as well.
This brings my total cost to plant and maintain the CRP habitat to $2,823.50. Taking those 10 acres out of production and signing them up for CRP makes the calculations much easier.
To calculate the profitability of the Quail Safe CRP, multiply 9.87 acres by $212 per acre (CRP rental rate) to get $2,092.44 per year. Then multiply $2,092.44 by 10 years to get $20,924.40; subtract planting expenses of $2,823.50 from $20,924.40 to arrive at $18,100.90 of potential profitability. The average income will be $183.39 per acre on 9.87 acres.
Additional Incentives for Planting Habitat
Switchgrass RCPP
The Switchgrass RCPP is a five-year program with eligibility in certain counties in southern Iowa. It has an incentive payment of $222 for the first two years. Years 3-5 will pay $50 per ton for the switchgrass that is harvested.
The expected yield is three to four tons per acre which is $150-$200 per acre. The company FDC Enterprises, Inc. is administering this program. They will pay for the establishment costs and harvest and hauling of the switchgrass. There will be 36 acres will be enrolled in this program.
To calculate an estimate for the Switchgrass RCPP incentives payment, add $222 and $222 for the first two years and $150 for each of the next three years to get $178.8 per acre for five years.
I am going to average this payment out over 10 years because this land will be out of crop production and years 6-10 for the switchgrass crop are counted under IDALS. The average rental rate over 10 years is $89.40 per acre or $3,218.40 for the 36 acres.
Iowa Department of Agriculture and Land Stewardship
The switchgrass RCPP has an extra incentive provided by Iowa Department of Agriculture and Land Stewardship (IDALS) that can be added to the Switchgrass RCPP funds.
In Year 1, the incentive payment is $1,212 and in Year 2, the incentive payment is $252. There isn't an incentive payment in years 3-5. For years 6-10, the incentive payment is equivalent to the market price of switchgrass, hay or pasture. For this example, I will put $150 per year in years 6-10.
This equates to $146.40 per acre guarantee from IDALS or $221.40 when the value of the switchgrass is included. This is the average over the 10 years of the contract. Since I counted the value of the switchgrass in years 3-5 at $150 per acre under the RCPP, I will count $150 per acre in years 6-10 under IDALS. The annual revenue from IDALS for 36 acres is $7,970.40.
Conservation Innovation Grant
Finally, there is a Conservation Innovation Grant (CIG from NRCS) incentive payment based on the percentage of acres that are farmed. This is important part of Pheasants Forever's precision conservation analysis. This financial incentive was designed to stack the acres that will continue to be farmed rather than the habitat acres. Pheasants Forever's precision ag and conservation specialist staff coordinate these financial incentives and figure out the correct acres from the maps they produce.
In my case, there is a high adoption rate of $26 per acre incentive payment because 46 of the 139-acre field is being converted to conservation cover. The $26 is multiplied by the acres remaining in row crop production which is 93 acres. This equates to a one-time incentive payment of $2,418 or $5.25 per acres on all 46 acres averaged over 10 years.
The final comparison on 46 acres that were delineated as unprofitable using the precision conservation analysis are:
- Row crop returned to the farmer on 46 acres is a $17,088 loss.
- Cash rent to landowner on 46 acres is $11,132 ($242 per acre based on Iowa State data).
If 36.2 acres arecsigned up for the switchgrass RCPP, IDALS and NRCS CIG (through Pheasants Forever), and 9.87 acres are signed up for CRP through FSA, the return averaged over 10 years is as follows:
The farmer's return is zero. No acres were farmed. No profit or loss was realized.
Landowner's return is $18,10.05 on 9.87 acres of CRP:
- $3,218.40 on 36 acres from Switchgrass RCPP
- $7,970.40 on 36 acres from IDALS
- $5.25 per acre on 46 acres from NRCS CIG
- $13,004.10 total per year or $282.69 per acre equivalent cash rent on 46 acres
According to my calculations, this is a win win win scenario. The farmer wins by not trying to farm and turn a profit on the poorest ground. If this was rented ground, the loss on 46 acres was calculated at $17,088 or $371 per acre. It would be substantially less if the farmer owned the land.
The landowner would see an increase in rent of $40 per acre on the 46 acres. This would add up to $18,400 over the 10-year contract period. The other win is all the benefits of habitat on the landscape. Erosion control, water infiltration, soil building, reduced pesticide and fertilizer use, and 46 more acres of wildlife habitat.
In part 3 of this blog, I will talk about my decision-making process. I will also explore one more financial benefit that has to do with the increased value of the remaining acres that will be farmed.
Do you agree with my financial analysis? Has anyone calculated the benefits of “resting” land for 10 years? How important is diversifying crop production to reducing overall risk? Send me an email at brad.woodson(at)practicalfarmers(dot)org and let me know what you think about the questions above.
To learn more about putting data to work for you, contact Pheasants Forever's Precision Ag & Conservation Specialist Stephanie Nelson at (712) 266-3977 for assistance in Iowa or BJ Werk at (701) 238-6504 for assistance in Minnesota.