
Comparing the Profitability of Corn – Soybean vs Extended Rotation: Introducing the “Crop Rotation Analyzer” Tool
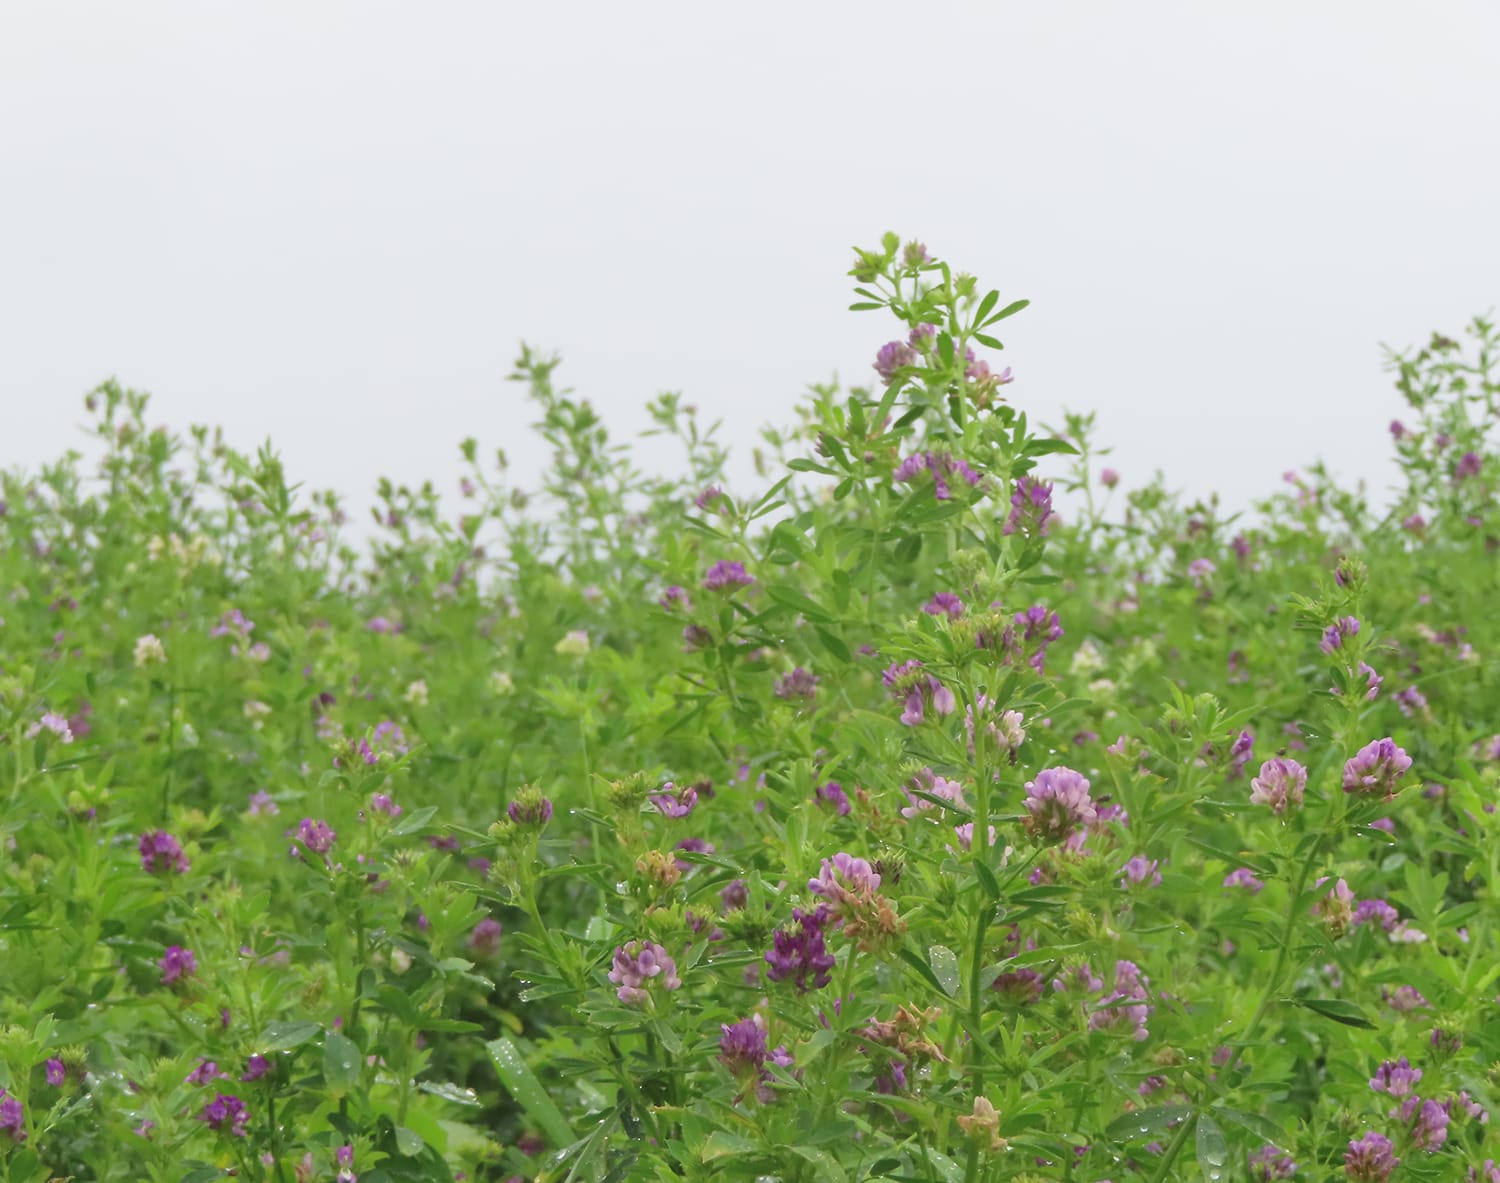
Looking at profitability over a rotation helps one take into account how input costs might be affected. For example, a corn crop following an alfalfa crop (pictured) would have lower nitrogen rate requirements than a corn crop following corn or soybeans.
More farmers are becoming interested in raising crops beyond corn and soybeans to break up pest cycles and reduce input costs, but the crop rotation with the alternative crop must be financially competitive. A new tool co-developed by Practical Farmers of Iowa and Iowa State University Extension seeks to simplify economic decision-making for selecting crop rotations.
The “Crop Rotation Analyzer” tool provides a holistic profitability summary for each rotation, which includes how yields and inputs can vary from one rotation to the next. By looking at the whole rotation instead of a single crop year, a farmer can account for factors like increased corn and soybean yields when grown in extended rotation or lower recommended N application rates following a legume cover crop. This multi-year view more accurately reflects profitability.
The spreadsheet tool, built by Emeritus Professor of Agricultural Economics William Edwards, can be used as a predictive economic tool, helping you plan what your crop rotation should be in the coming year. It can also be used as a reflective tool.
You can easily alter variables, such as commodity prices or input prices, to see how these factors affect profitability of different rotations. For simplicity’s sake, the tool omits factors such as land rent and labor value, assuming those costs are fixed with respect to the rotation.
DOWNLOAD THE CROP ROTATION ANALYZER TOOL
What Goes into the Tool?
For each of the crop years in your selected rotations, you’ll input data into two categories. The Crop Budgets sheet will ask for revenue (factors like yield, expected price) and crop inputs (fertilizer, crop protectants, etc). The Machinery Operations sheet records the costs of different passes over the field such as tillage, planting, spraying, combining and baling.
The tool includes some example prices to get you started; however, the outputs of the tool will be most relevant to you and your farm if you enter your actual or estimated crop budgeting numbers. If you don’t know costs of production, you can look up input price information from the most recent Estimated Costs of Crop Production and machinery custom rate information from the most recent Iowa Farm Custom Rate Survey.
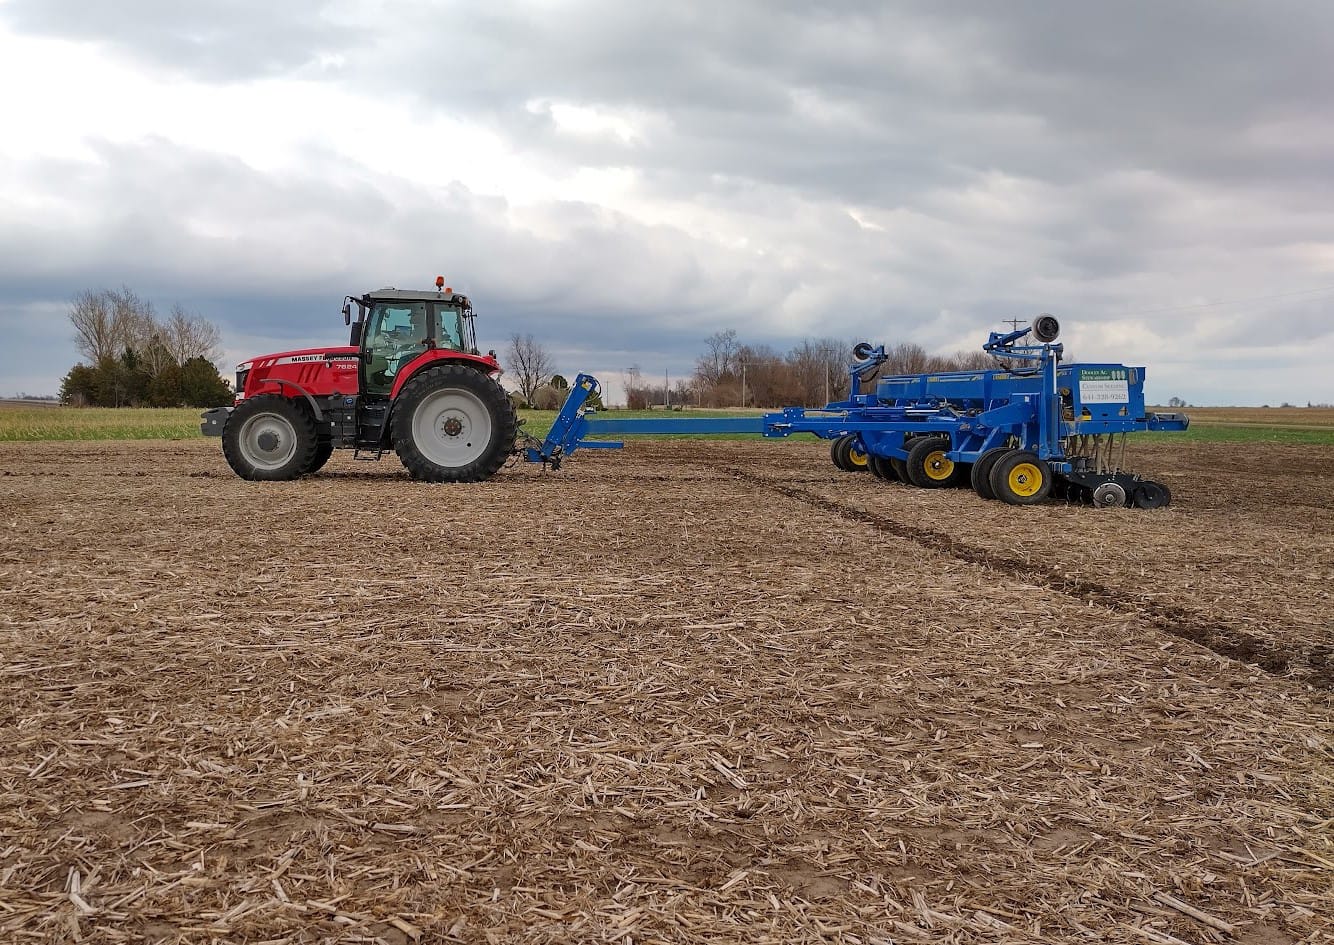
The tool includes the cost of passes over a field, such a drilling oats and red clover, as pictured here.
How Do You Use the Tool?
The Crop Rotation Analyzer has five simple steps outlined in the first page of the spreadsheet. For the sample data included in the tool, we used a comparison of three rotations:
- Two-year corn and soybean rotation
- Three-year corn and soybean, plus oats and clover rotation
- Continuous corn
Here are the steps of using the tool with some screenshots to guide you.
Step 1. Confirm the names of the crop rotations (blue box) and crop years (green box) you wish to compare are listed in Table 1 below. You can add a rotation or crop year by typing in any of the cells.
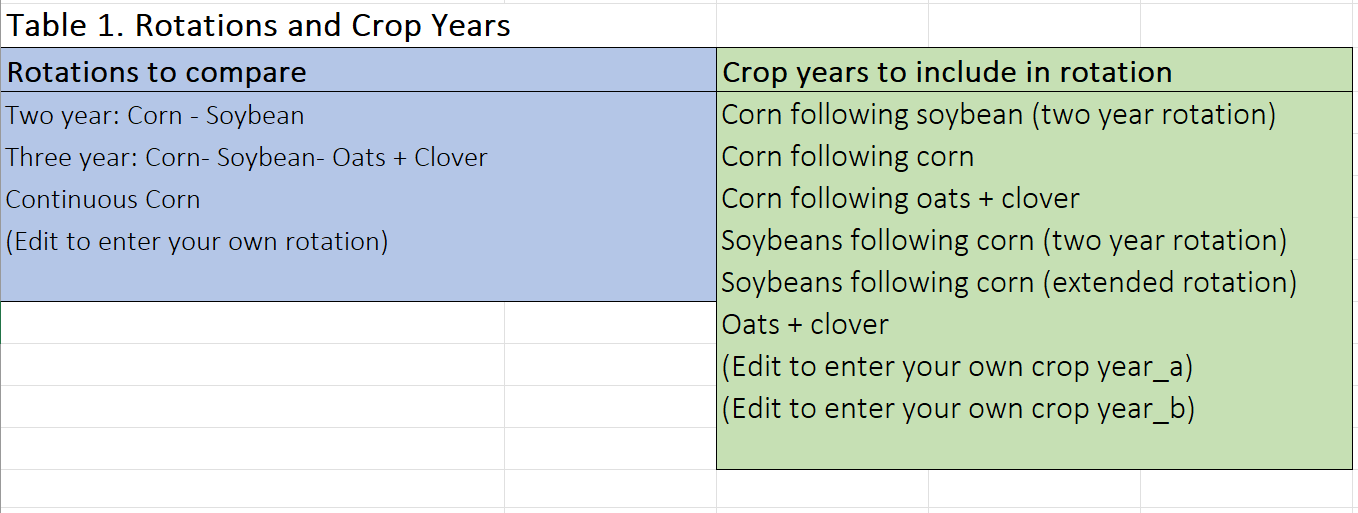
While it might seem redundant to have three versions of a corn year, we anticipate that the inputs and yields might be different among the corn years in the three rotations.
Step 2. Use the drop-down menu to select the crop rotations you wish to compare in Table 2, and add the corresponding crop years for each rotation.
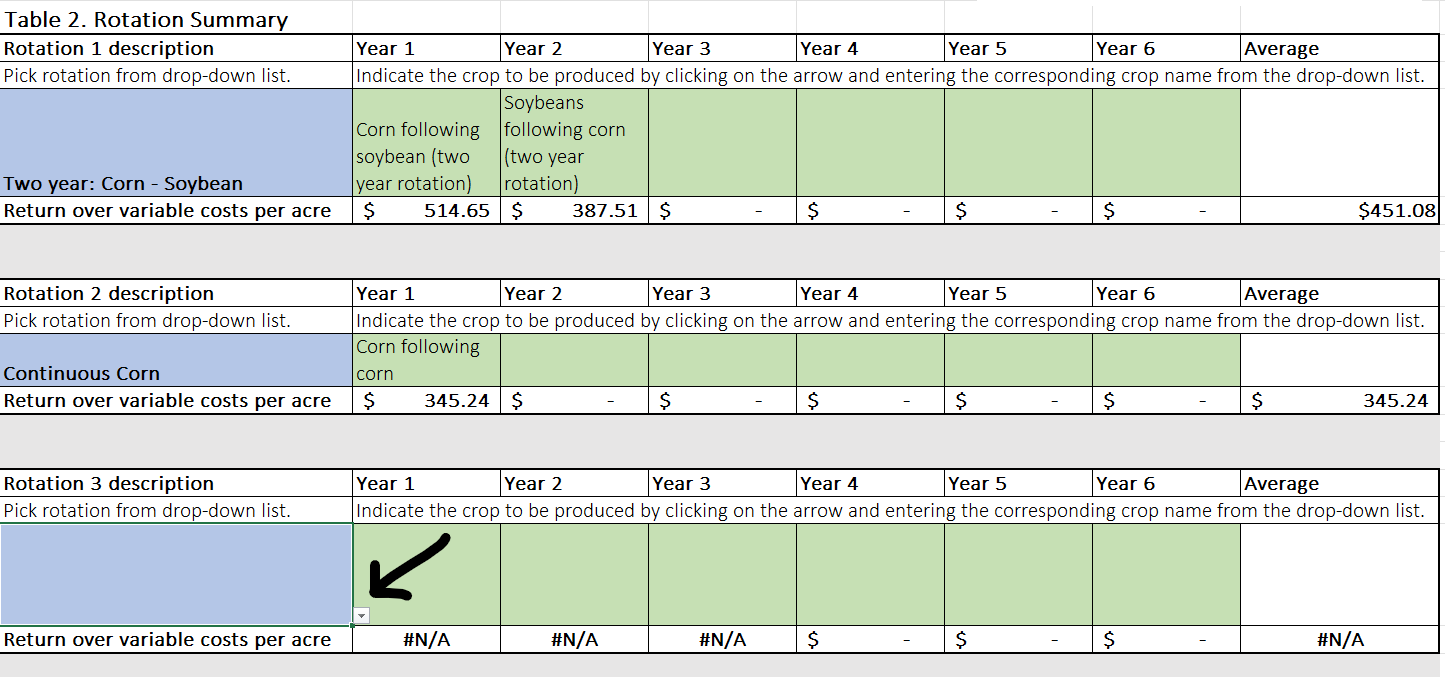
Note that you don’t need to fill out all six crop years; the tool will take the average of however many years are inputted.
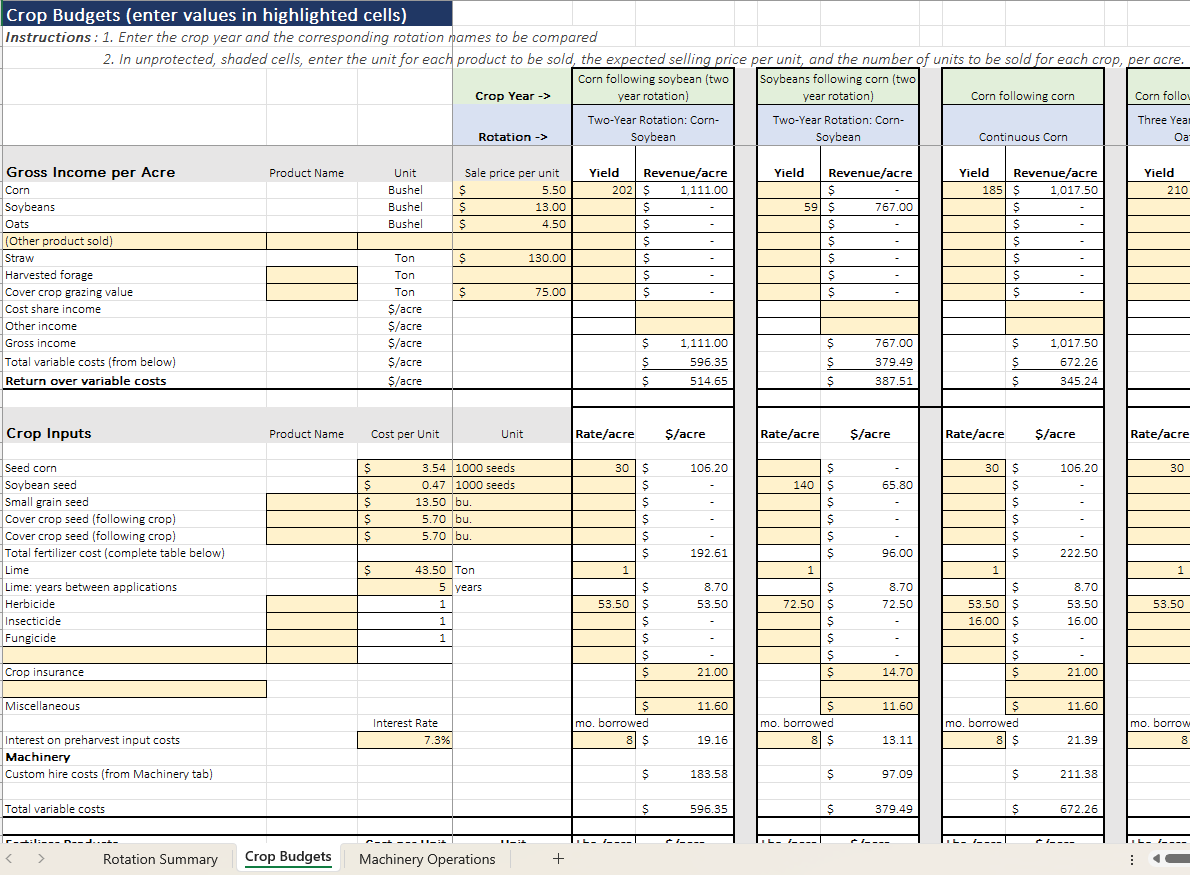
Step 3. Complete the Crop Budgets tab for each crop included in the rotations in Table 2.
Turn to the ‘Crop Budgets’ sheet of the tool. You’ll want to first confirm that you have each crop year in the rotation entered at the top of the sheet by selecting them on the drop-down menu.
In this step, you’ll fill in inputs such as gross income (yield per acre, plus price received per bushel) and crop input costs (seed cost, crop protectants, fertilizer, etc). The current input values are rough averages from 2021-2023, so you’ll likely want to edit values to better reflect the prices you’re experiencing. Pay attention to the units for each of these lines and adjust as needed.
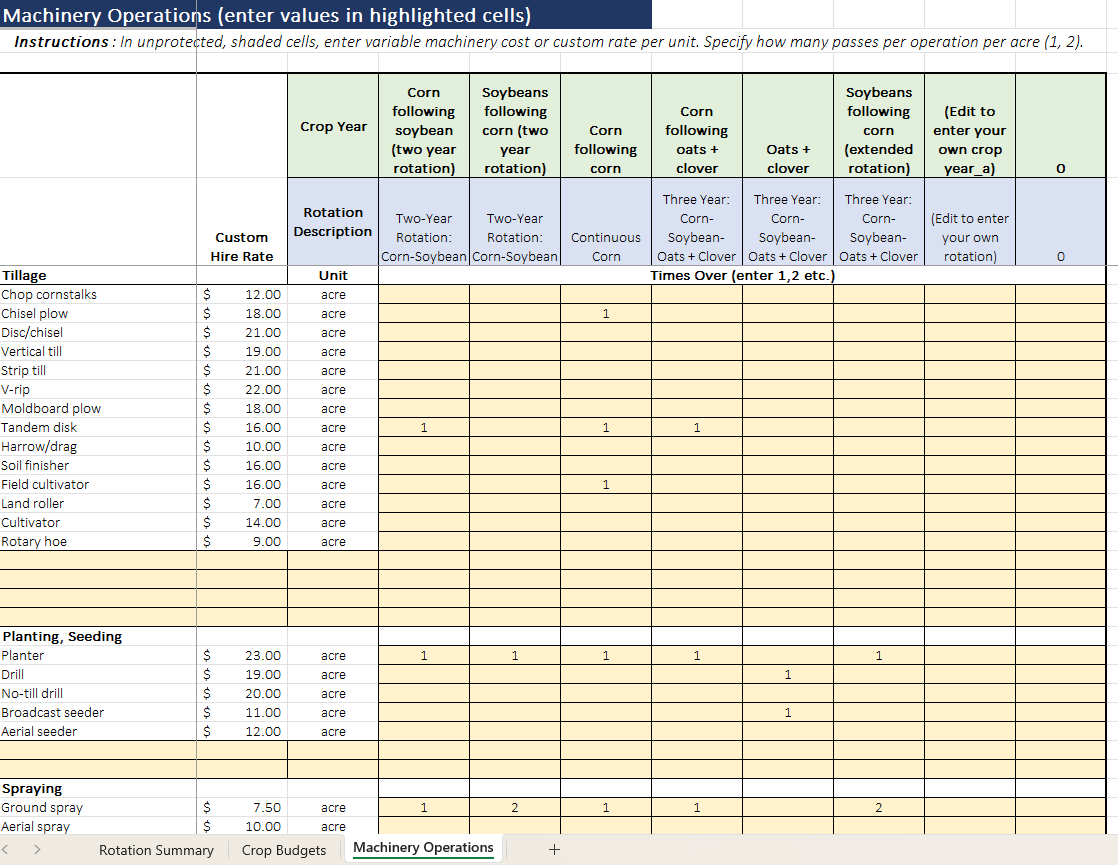
Step 4. Complete the Machinery Operations tab for each crop listed in the rotations in Table 2.
This step is intended to account for the costs of passes over the field such as tillage, planting, spraying, combining, etc. The crop years and rotation will auto-populate from the “Crop Budgets” sheet.
Add a 1, 2, etc. for each pass over the field or leave it blank if you didn’t make that type of pass. You can adjust the values under “Custom Hire Rate” for each of these passes to better reflect your actual expenses.
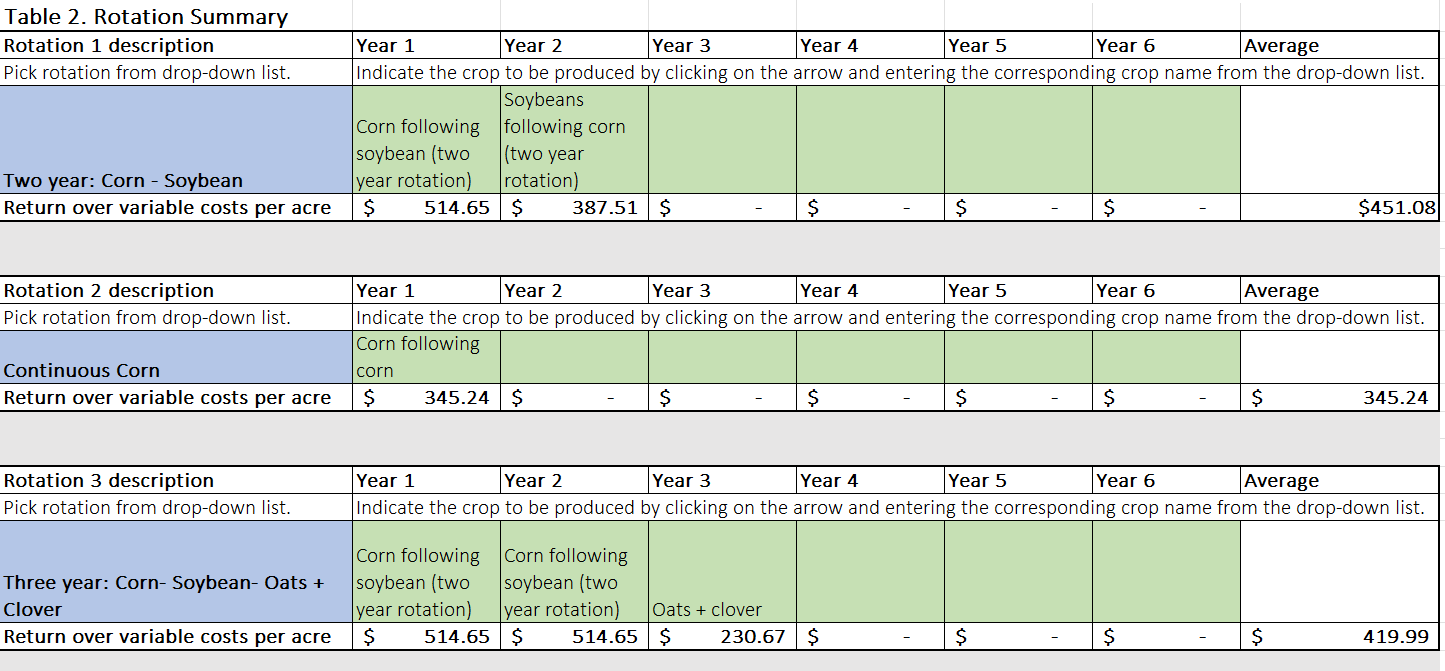
Step 5: Compare the average returns over variable costs for each rotation in Table 2 on the Rotation Summary tab.
Once you have completed the Crop Budgets sheet and the Machine Operations sheet, you turn back to the Rotation Summary sheet, and scroll to Table 2. Take a look at the return over variable costs for each year in the crop rotation and look at the average for all crop years in the rotation.
Looking at each crop year’s return over variable costs can help plan for cash flow, but it is also important to look at the average return across a rotation. In the example screenshotted below, the oats and clover crop year has the lowest dollars per acre in return over variable costs, but the corn and soybeans in the same rotation (the three-year rotation) have greater returns than the corn and soybeans in the other rotations being analyzed.
Closing Thoughts on the Tool
The Crop Rotation Analyzer tool was created to be useful to you, so we encourage modifications like adding expenses we left out (such as cash rent and paid labor) if they will vary according to the rotation chosen. Note that machinery custom rates implicitly include labor costs for machinery operations.
 Remember to account for the whole rotation when inputting information for a crop year. Will your nutrient management plan be different? How might your yields differ? Will your tillage or herbicide expenses be different? PFI staff are available to help you consider how different rotations will affect inputs. Contact rebecca.clay(at)practicalfarmers(dot)org to chat about cropping rotations or provide feedback on the tool.
Bonus: This tool was adapted with permission from the ISU Ag Decision Maker File A1-20, however there are minor structural differences. The Ag Decision Maker tool includes variable costs in addition to custom rates on the machinery sheet and leaves out some detail about the fertilizer choices on the budget tab for simplicity’s sake. Both are useful tools; use whichever you prefer.
This material is based upon work supported by the U.S. Department of Agriculture, under agreement number NR213A750013G024. Any opinions, findings, conclusions, or recommendations expressed in this publication are those of the author(s) and do not necessarily reflect the views of the U.S. Department of Agriculture. In addition, any reference to specific brands or types of products or services does not constitute or imply an endorsement by the U.S. Department of Agriculture for those products or services.