In a Nutshell:
- Strategies are needed to offset the cost of cover crops that precede corn while minimizing yield drag and seedling diseases and maximizing cover crop benefits.
- Cooperators compared the effects of planting a cereal rye cover crop earlier versus later and of reducing the seeding rate from 55 lb/ac to 28 lb/ac on indicators of corn crop success and cover crop performance.
Key Findings:
-
Reducing the seeding rate reduced rye biomass at 5 of 7 farms and had no effect at the other farms. Seeding later reduced biomass at 5 of 6 farms and had no effect at the other farm.
- Reducing the seeding rate and seeding later reduced fall groundcover at one farm, but neither treatment affected soil health or corn yields at any farm.
- Incidence of disease in corn seedlings was not affected as a result of reducing the rye seeding rate of seeding rye later.
- Reducing the seeding rate of rye before corn shows signs of promise as a potential strategy to reduce cover crop costs without sacrificing corn crop success, but this may not be true if one's goal is to maximize cover crop biomass and groundcover. Further research is needed to investigate these strategies under different weather conditions.
Background
Cover crop use in corn-soybean systems has been shown to provide abundant soil and water benefits. They can provide fall and spring groundcover to protect against soil erosion, increase water infiltration and soil moisture retention, and reduce nutrient loss in runoff and tile drainage.[1–3] Despite these and other benefits, the number of acres planted to cover crops remains low in Iowa.[4] Barriers to adoption include the cost to plant and terminate cover crops as well as the risk of yield drag. In soybeans the costs of a cereal rye cover crop can be offset by maximizing rye biomass, which has been shown to improve weed control and reduce herbicide expenses without reducing soybean yield.[5,6] However, when cereal rye precedes corn it can result in yield drag and increase the prevalence of corn seedling diseases.[2] Additional research is needed to develop strategies for offsetting the cost of cover crop adoption in corn while minimizing yield drag and seedling diseases and maximizing cover crop benefits. Seeding cereal rye at a reduced rate has been proposed as one possible strategy. A common seeding rate for rye is 55 lb/ac, but cutting the rate 50% would reduce costs and may also reduce rye biomass, corn seedling diseases and yield drag. Additionally, seeding rye earlier or later in the season could contribute to the success or failure of seeding rye at a particular rate. Seeding rye earlier has been demonstrated to produce more biomass.[7] It is possible that seeding rye earlier could increase the chance of successfully seeding it at a reduced rate. Alternatively, seeding later at the common rate could reduce biomass enough to eliminate the risk of seedling disease and yield drag. The objective of this research was to evaluate the effects of the proposed cover crop management strategies on corn crop success and cover crop performance. To investigate this, cooperators seeded rye in strips on two dates (early, late) and at two rates (55 lb/ac, 28 lb/ac) and measured the effects on cereal rye biomass, corn yield, rye groundcover, soil health and corn seedling disease.
Methods
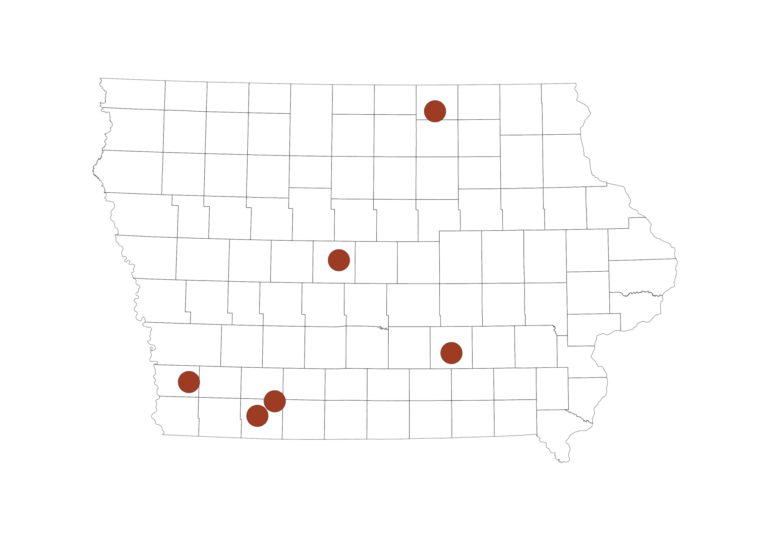
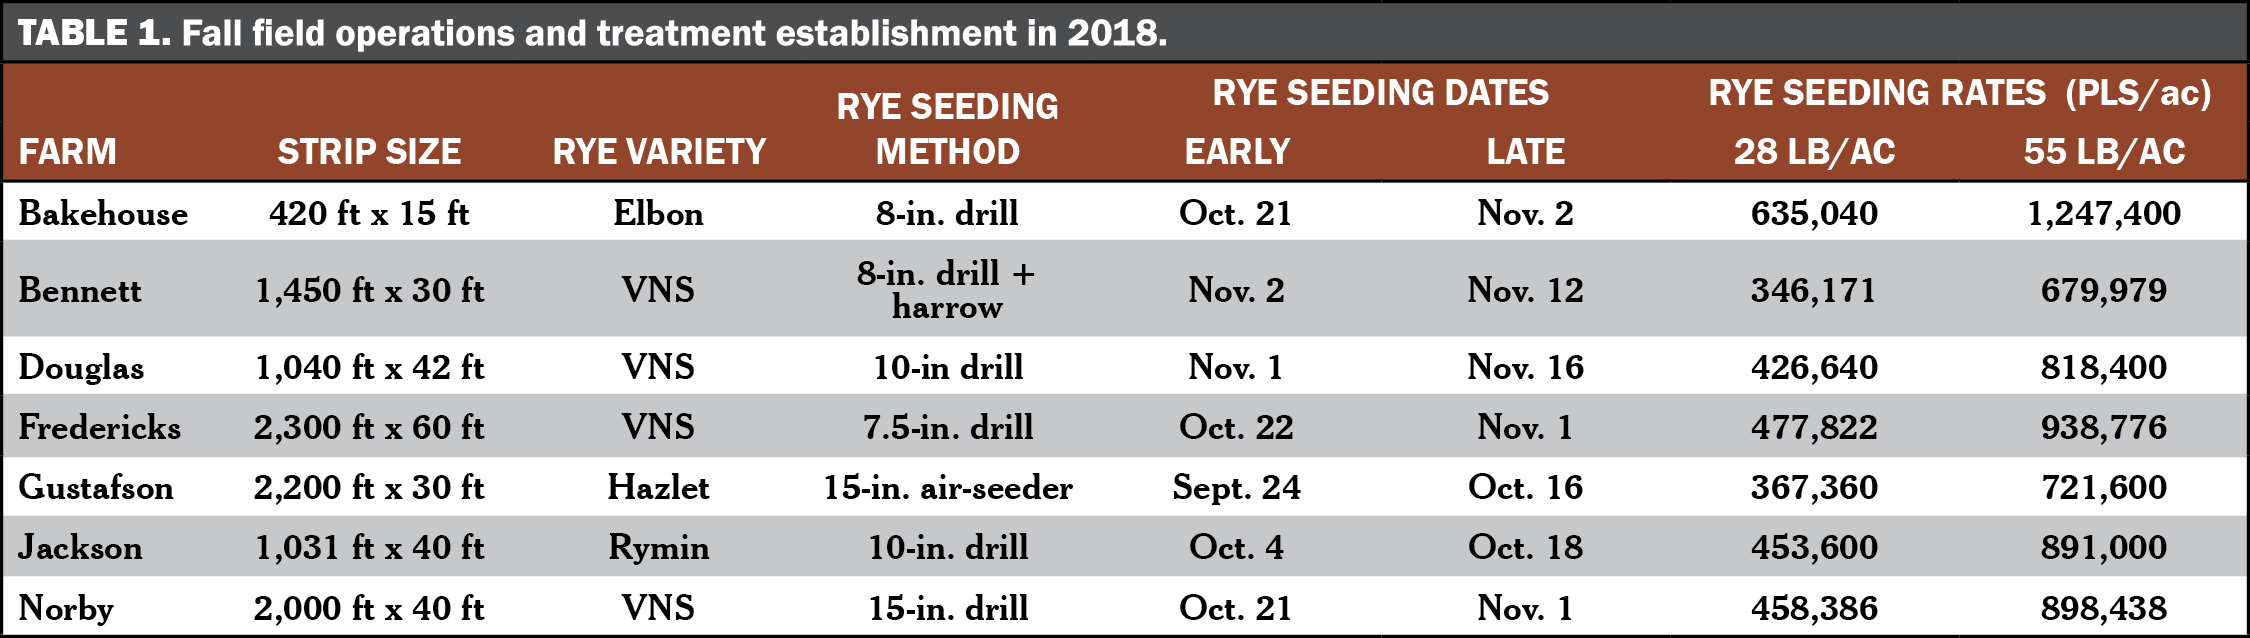
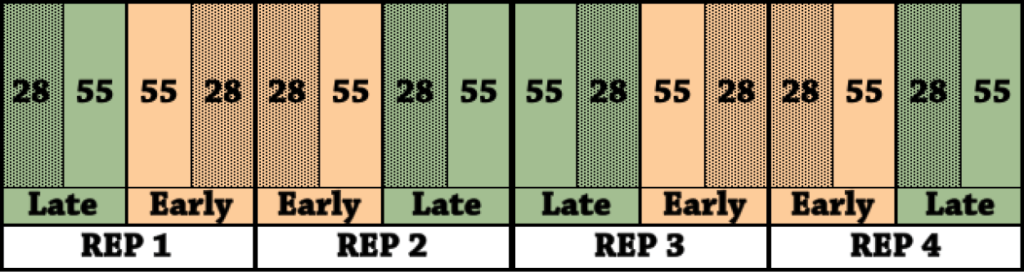
DesignCooperators established treatments the fall of 2018 by planting cereal rye in strips on each of the seeding dates and at each of the seeding rates (Table 1). Cereal rye followed soybean at all sites. At each farm, growers arranged treatment strips in a split-plot randomized complete block design. In this design, a block of land is divided into two whole plots and the levels of the seeding date treatment (early, late) are randomly assigned to a whole plot. After assigning treatments to whole plots, both whole plots are further divided into two subplots to which the levels of the seeding rate treatment (28 lb/ac, 55 lb/ac) are randomly assigned (Figure A1). Growers replicated each treatment four times for a total of 16 strips at each farm. This design allowed us to conduct statistical analyses and assess the effects of the seeding date and seeding rate treatments.
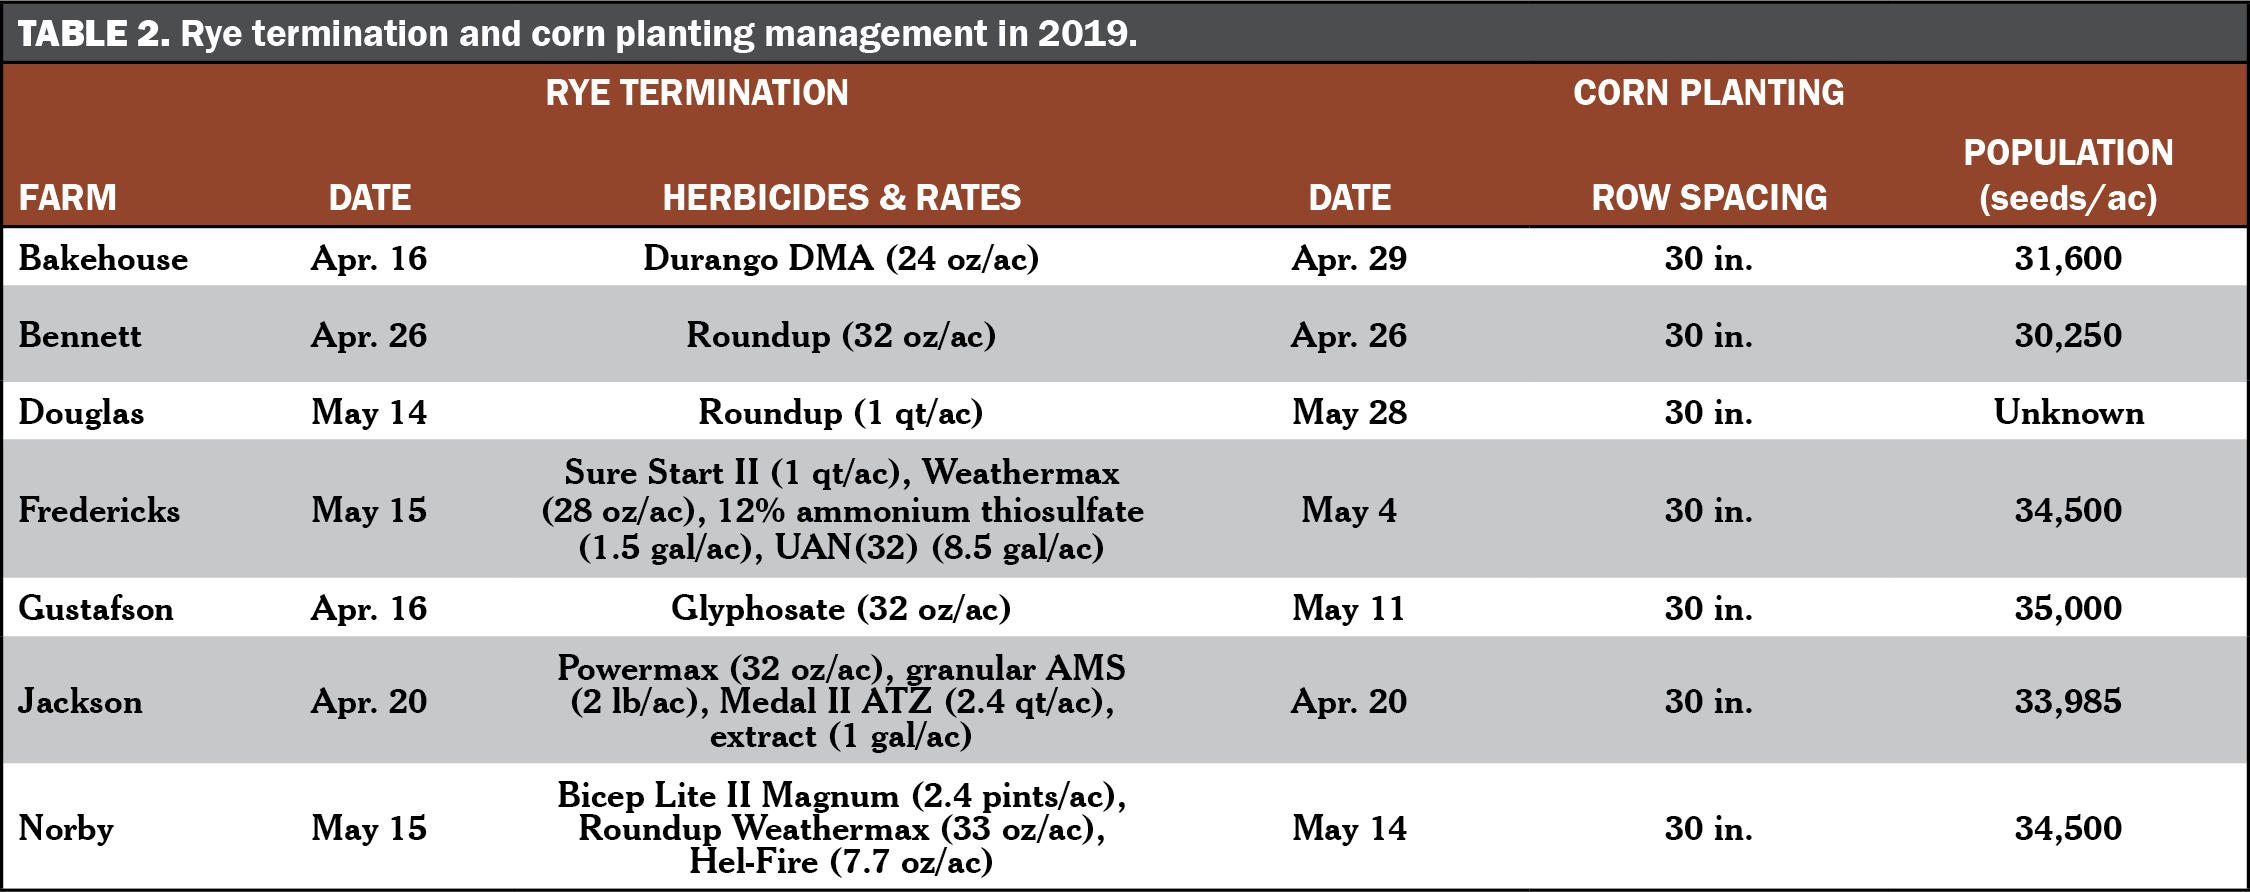
The spring after establishing rye treatments, cooperators chemically terminated rye and planted corn in all strips (Table 2). Weed and nutrient management was unique at each farm and was applied equally to all strips.
Bakehouse applied 70 lb N/ac as UAN(32) and ammonium thiosulfate on April 19. For weed control, he applied Durango DMA (24 oz/ac) on May 4 and a tank mix of Halex GT (57.6 oz/ ac) and Re-Duce (25 oz/ac) on June 1.
Bennett applied 170 lb N/ac (anhydrous ammonia) to all strips on April 18, 2019. For weed control, Bennett added Harness (rate not given) to his rye burndown application on April 26.
Douglas did not apply nitrogen and relied only on cereal rye for weed control.
Fredericks applied P and K (0-123-59) at a variable rate with a strip-till pass on April 25. On May 4, Fredericks planted corn and applied UAN(32) (6.5 gal/ac), 12% ammonium thiosulfate (1.5 gal/ac) and 10-34-0 (2 gal/ac). For weed control, Fredericks sprayed Callisto Extra (16 oz/ac), Weathermax (22 oz/ac) and AMS (2 lb/ac) on June 13. Fredericks later side-dressed UAN(32) (23 gal/ac) and 12% ammonium thiosulfate (6 gal/ac) on June 22.
Gustafson applied 42 lb N/ac (dry AMS) on April 26. For weed control, he applied Volley ATZ (rate not given) on the same date of planting corn (May 11) and Impact Z (rate not given) on June 1. On June 15, Gustafson applied 130 lb N/ac as UAN(32).
Jackson applied 130 lb N/ac (swine manure) on Dec. 5, 2018, then applied 5 lb N/ac as an in-furrow popup starter on the same date of planting corn and terminating rye (Apr. 20). When corn reached V3 stage (date unknown), Jackson side-dressed 50 lb N/ac with a mix of Agrotain-treated urea (25 lb N/ac) and dry ESN (25 lb N/ac). For post-emergent weed control, Jackson sprayed Powermax (20 oz/ac) and mesotrione (4 oz/ac) (date unknown).
Norby applied 15 lb N/ac on April 23 using 2-6-12 liquid fertilizer (70 gal/ac). On the same date of planting corn (May 14), Norby applied 23 lb N/ac as UAN(32) and ammonium thiosulfate. On June 8, Norby side-dressed UAN(32) at a variable rate (averaged 133 lb N/ac). For weed control, Norby applied a mix of Roundup (22 oz/ ac), Hel-Fire (7.7 oz/ac), Atrazine 4F (16 oz/ac) and Resicore (40 oz/ac) on June 19.
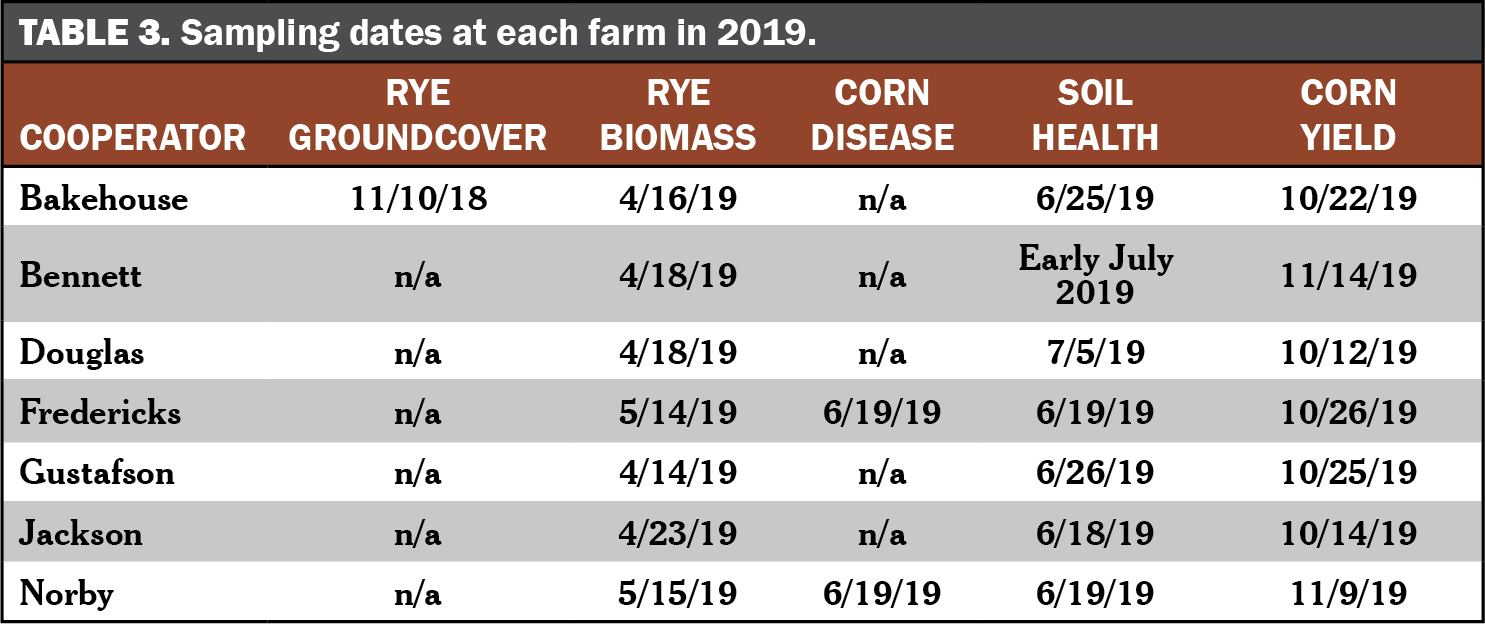
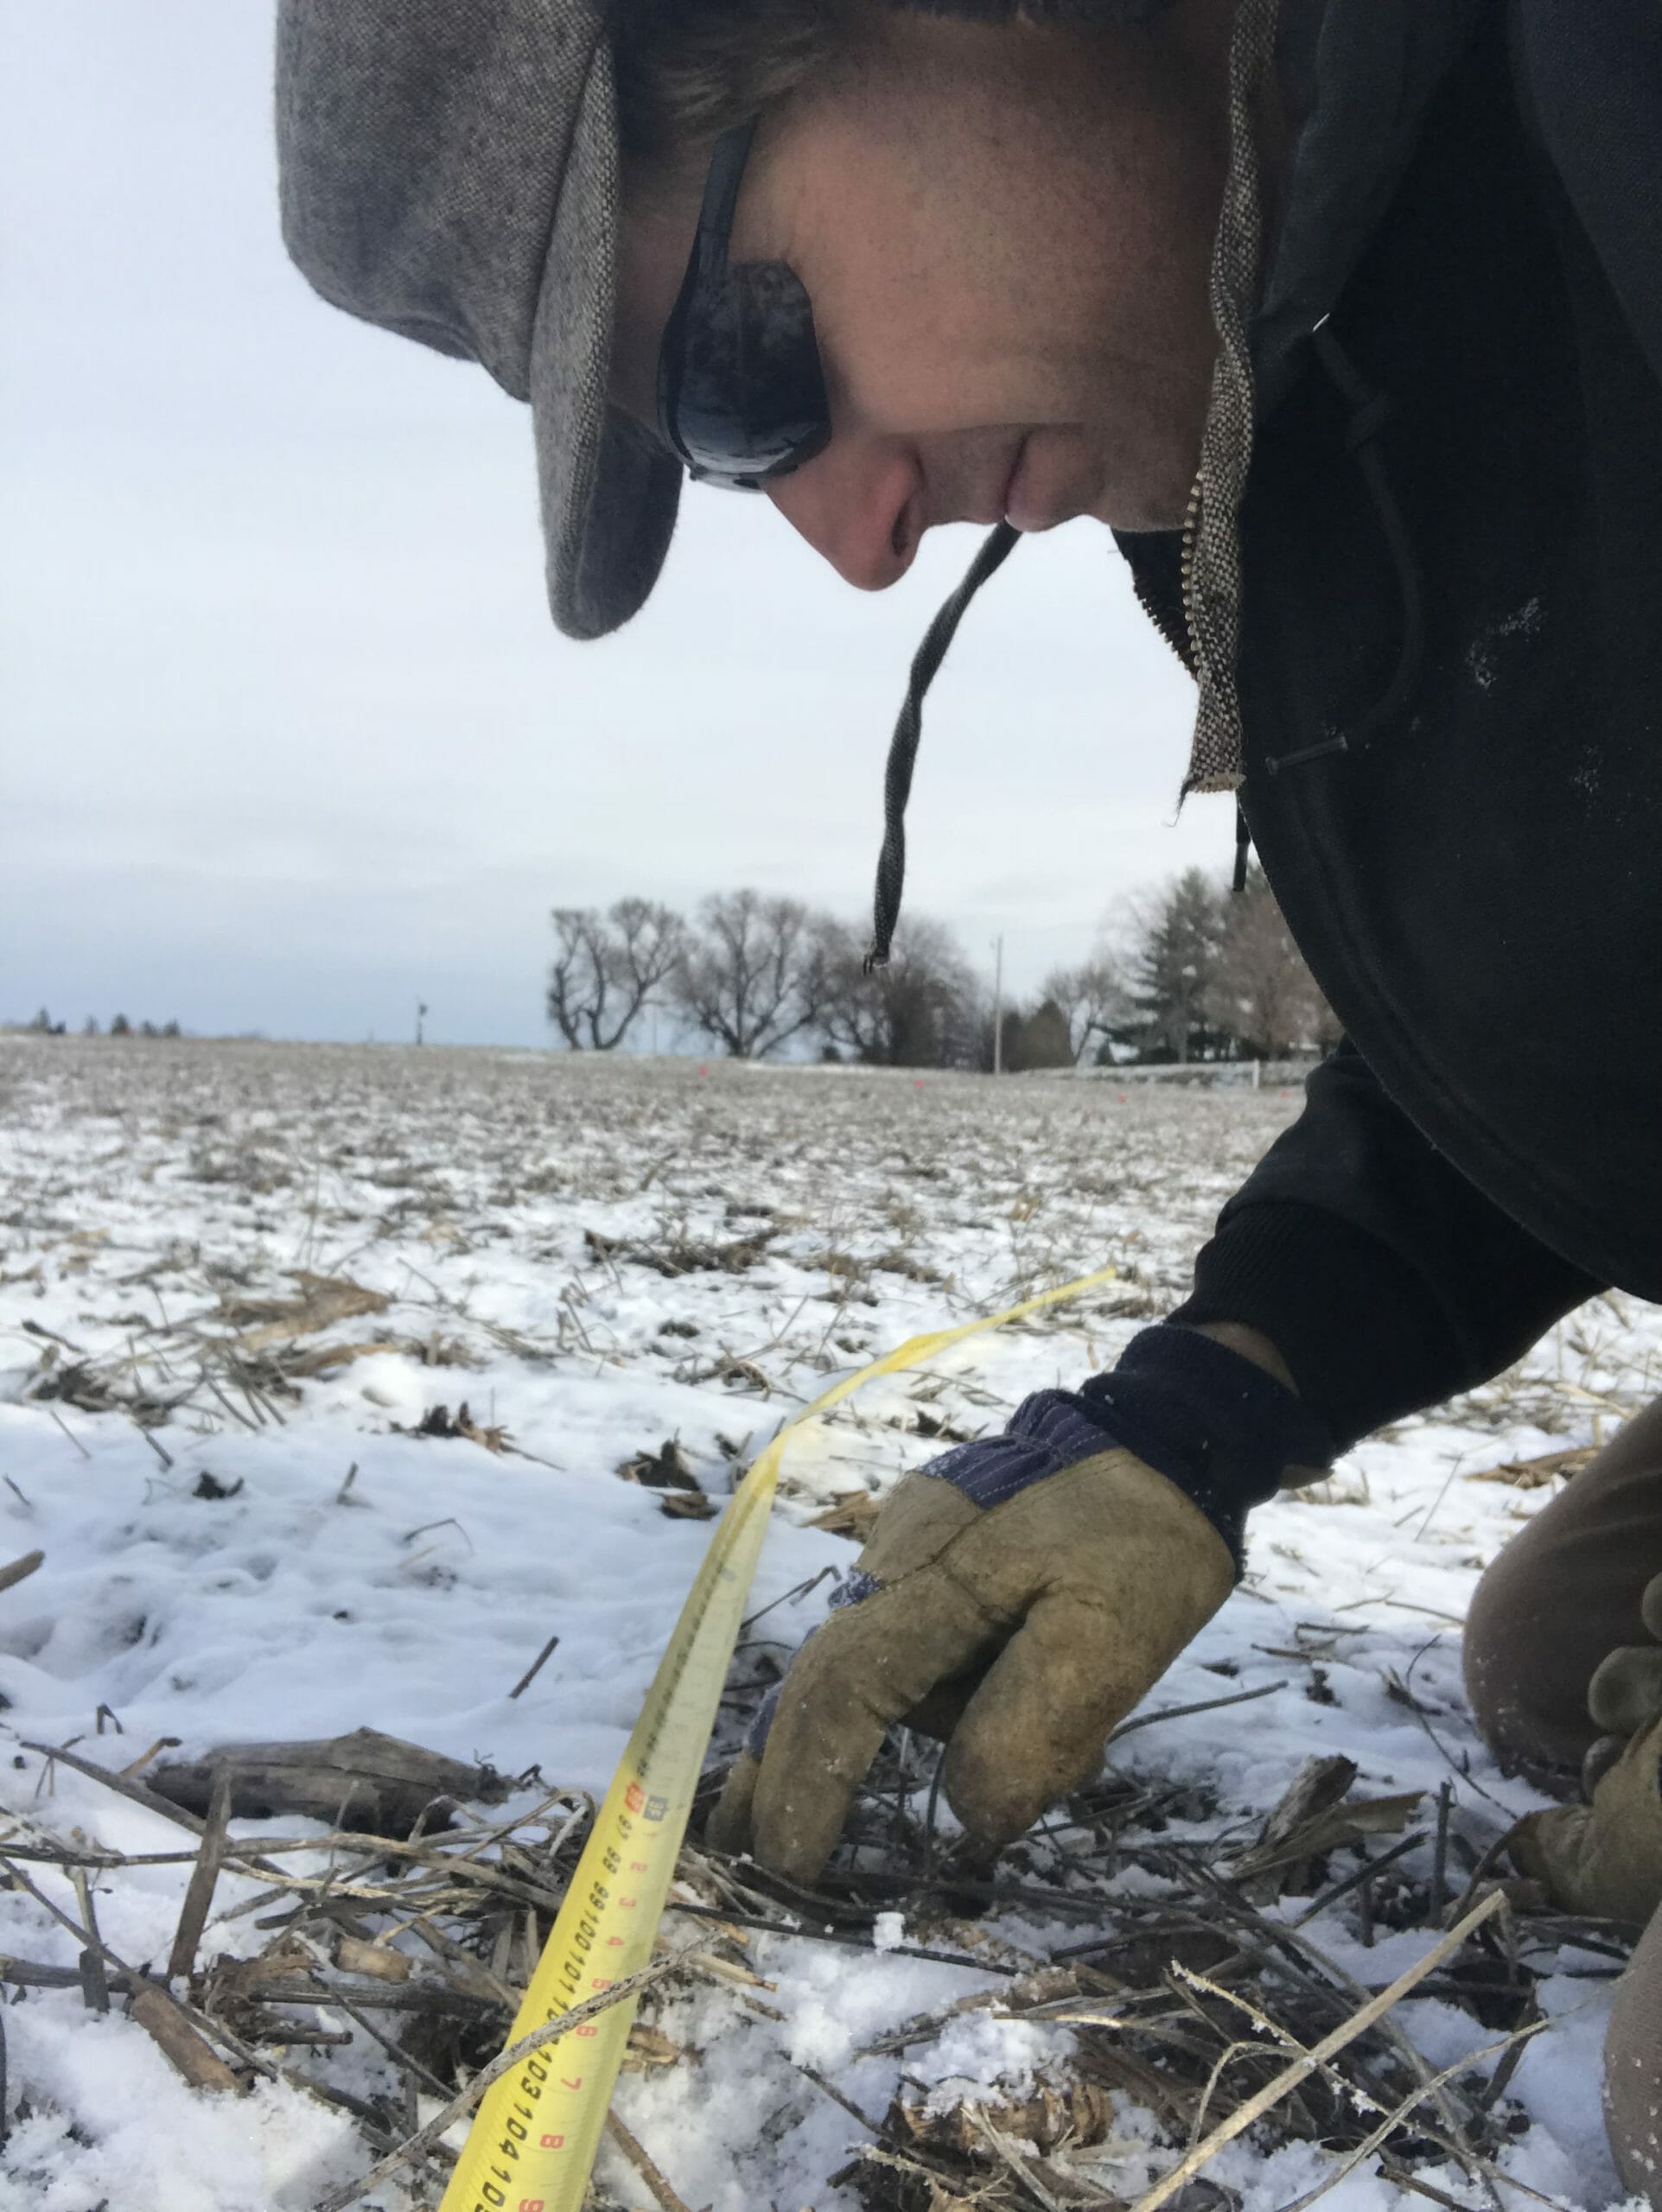
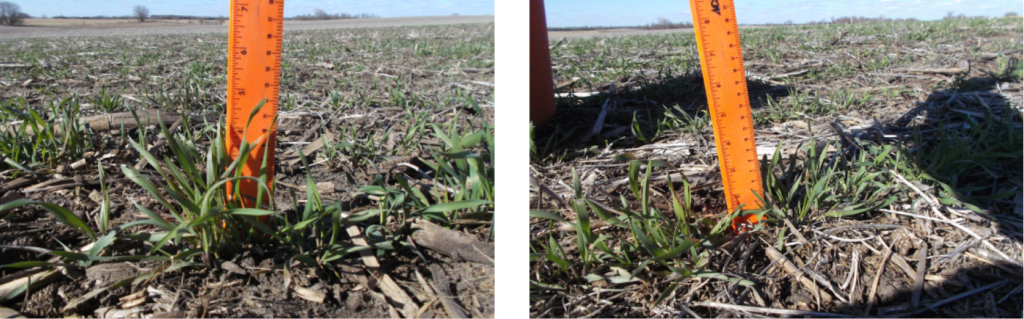
MeasurementsBakehouse measured percent groundcover of rye just prior to hard freeze and onset of winter dormancy (Table 3). In each strip, Bakehouse laid a 16-ft length of measuring tape diagonally across cereal rye rows. He then visually observed the area beneath every 6-in. mark and recorded the presence or absence of living cereal rye tissue. Percentage of rye groundcover was calculated for each strip by dividing the number of observations in which rye was present by the total number of observations (32) and multiplying by 100.
All cooperators sampled aboveground cereal rye biomass before or near the date of terminating rye (Table 3). Samples were collected into paper bags from within quadrats no smaller than 1 ft2 and from a minimum of two arbitrarily placed quadrats in each strip. Rye biomass samples were air-dried then weighed.
Dr. Alison Robertson and Jyotsna Acharya (ISU Department of Plant Pathology and Microbiology) assessed corn seedling disease incidence at Norby’s and Fredericks’ farms by randomly sampling eight corn seedlings in each strip (Table 3). For each sample, the researchers inspected seedling root tissue and reported the presence or absence of disease lesions. Disease incidence (the percentage of seedlings with disease lesions) was calculated in each strip by dividing the number of samples with disease lesions by the total number of samples collected (8 samples/ strip) and multiplying by 100.
All cooperators sampled soil in June and July (Table 3). In each strip, they collected ten soil cores to a 6-in. depth from randomly selected locations and mixed them thoroughly. Samples were sent to AgSource Laboratories (Ellsworth, IA) to determine the burst of CO2-C released from rewetted soil (Solvita assay).
Cooperators harvested corn individually from each strip and recorded grain yield and moisture (Table 3). Yields were adjusted to 15.5% moisture.
 Data analysis
Data were analyzed using RStudio statistical software (Version 1.2.1335; RStudio, Inc., Boston, MA). Means separations are reported using Least Significant Difference (LSD), and statistical significance was determined at the 95% confidence level.
Results and Discussion
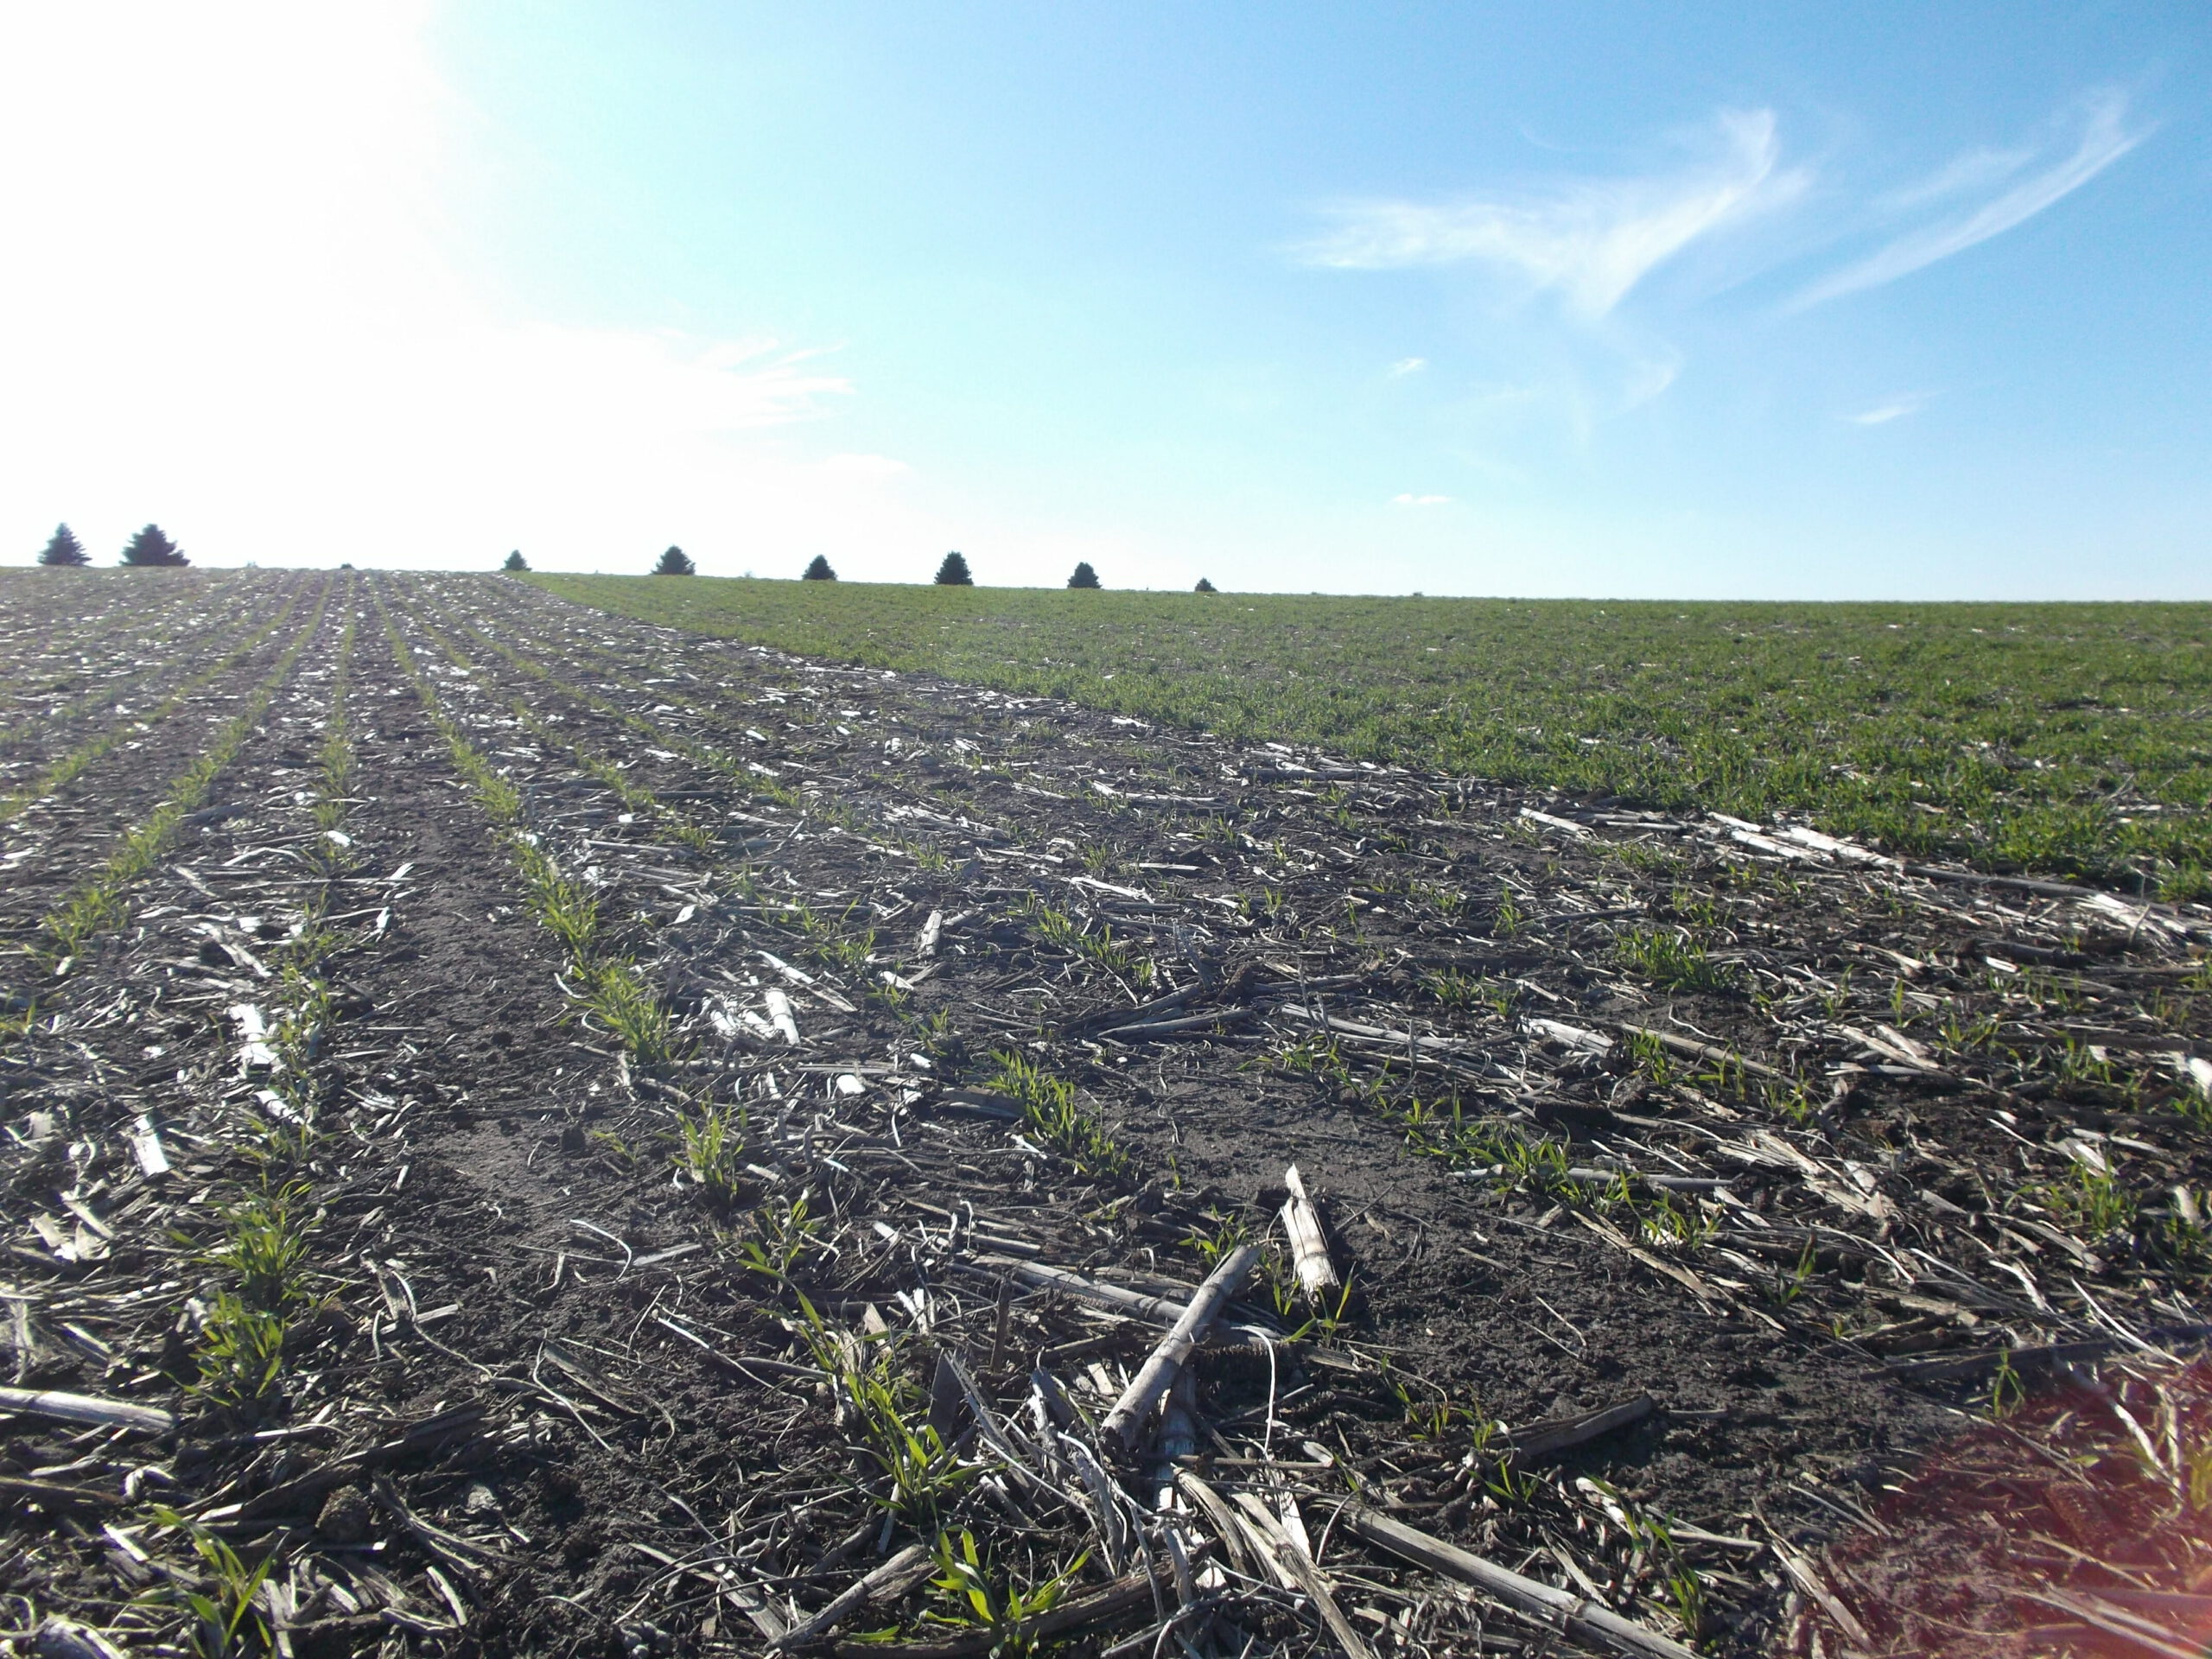
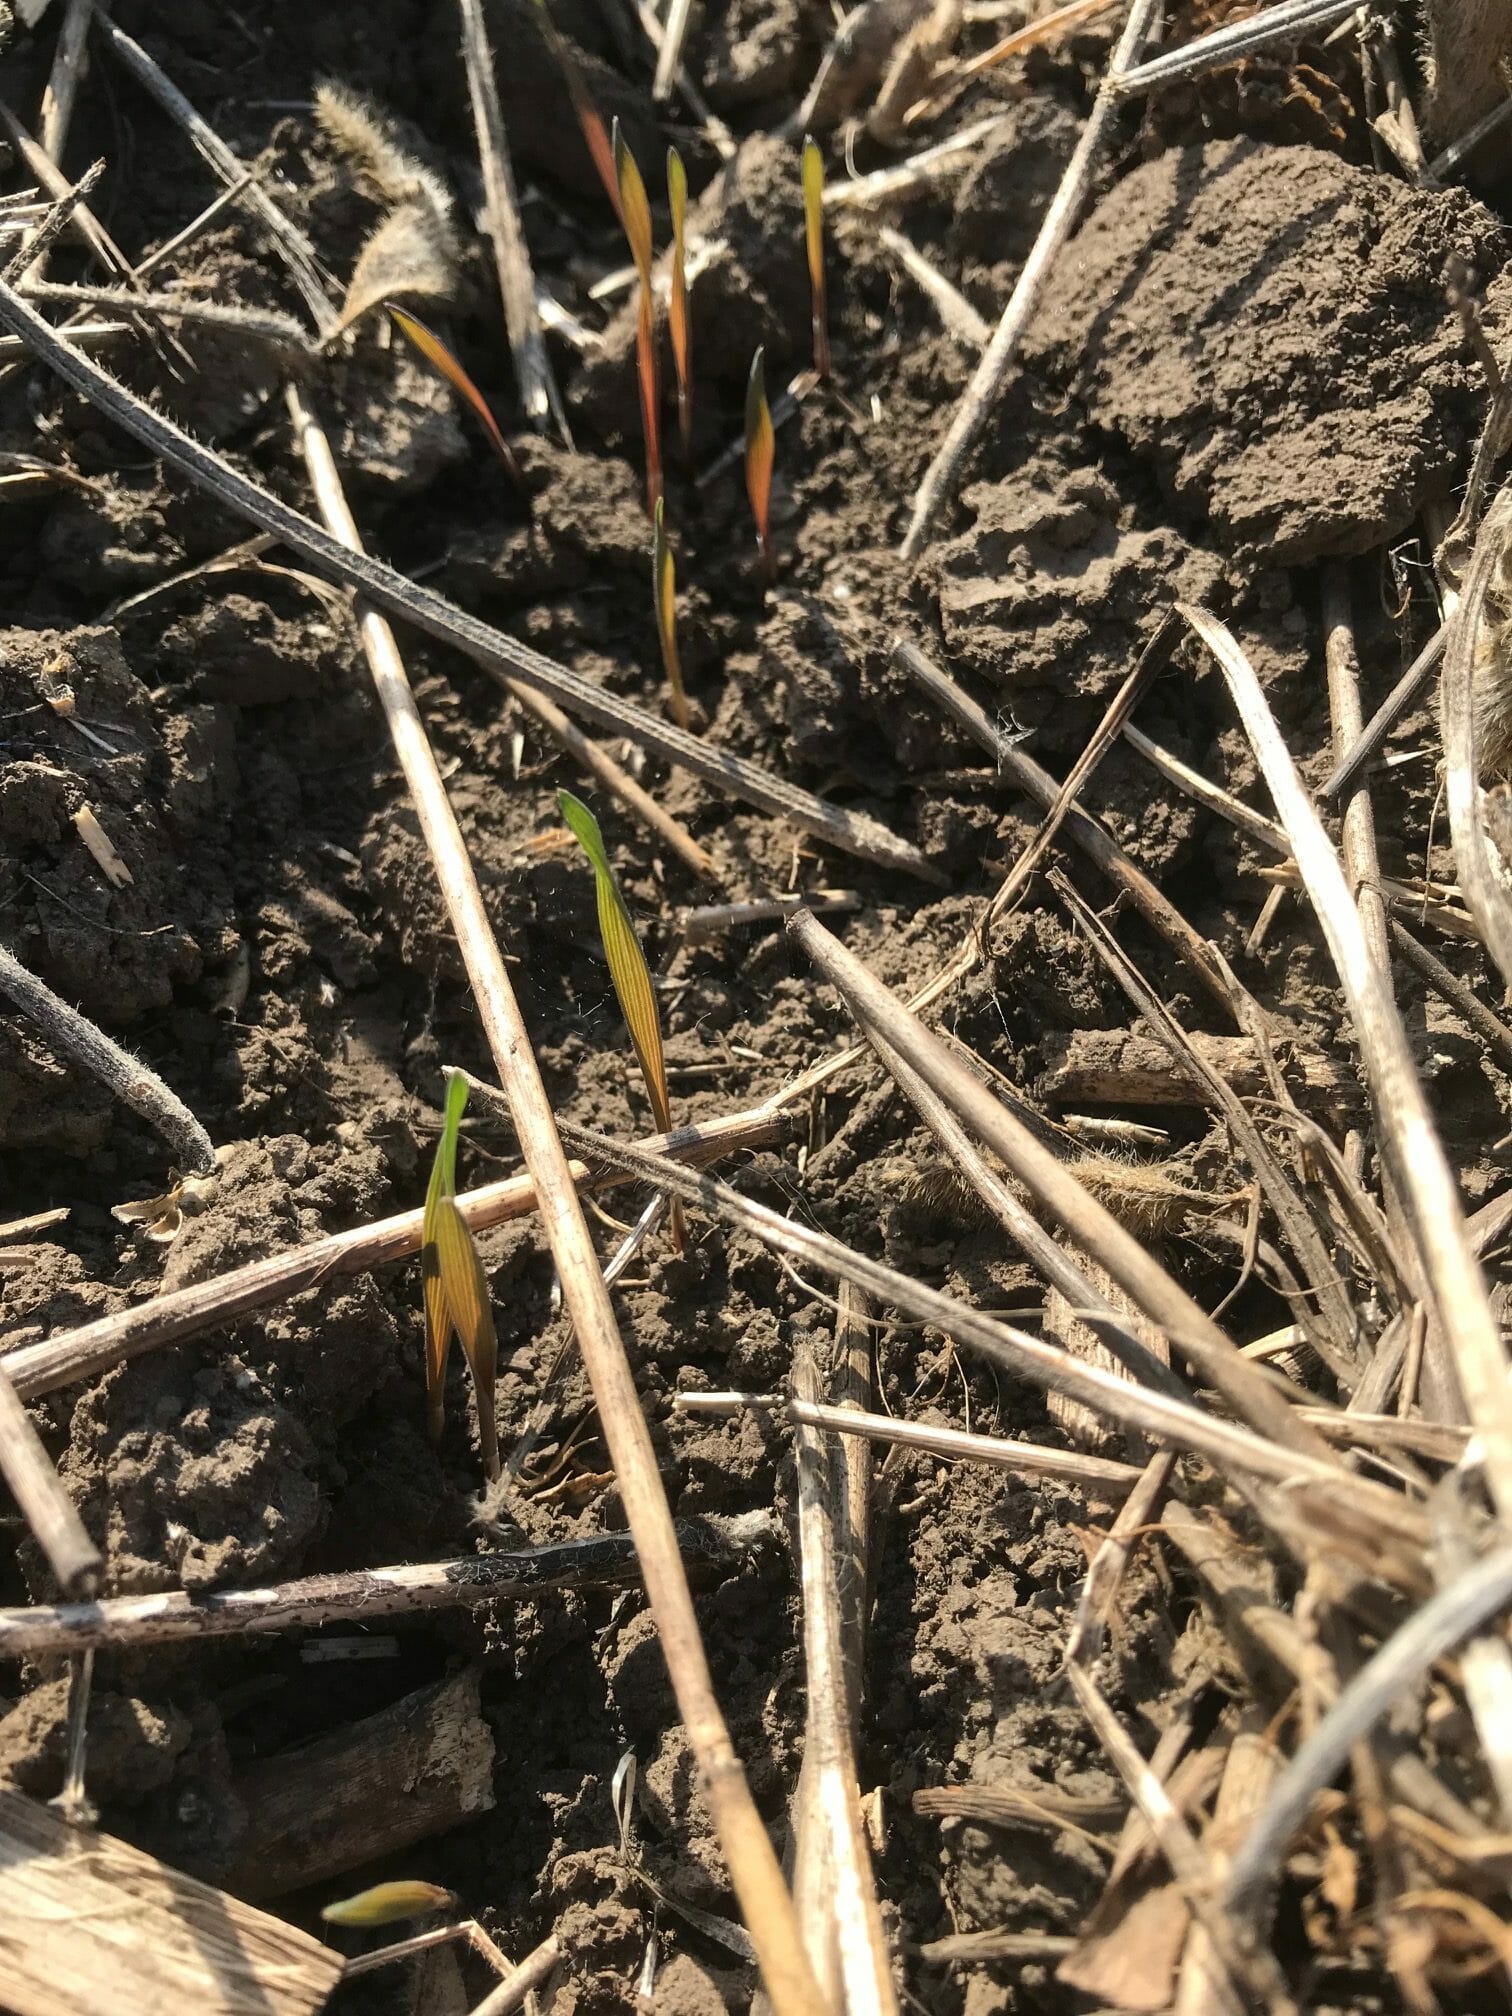
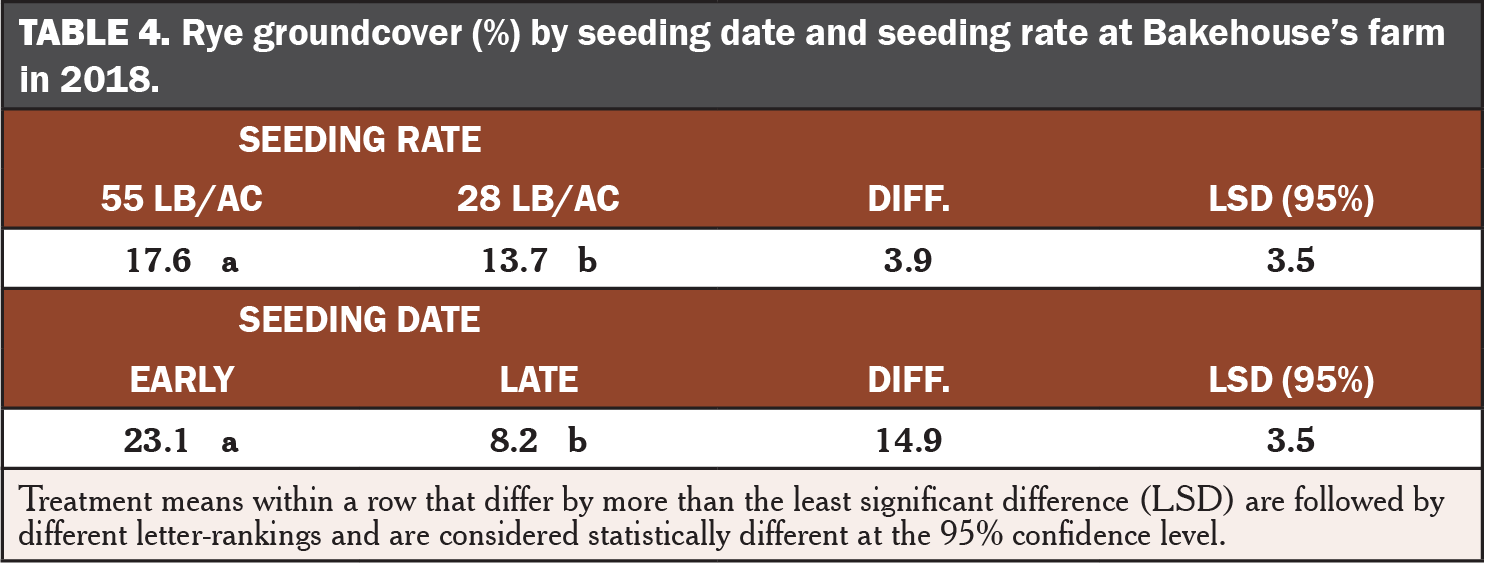
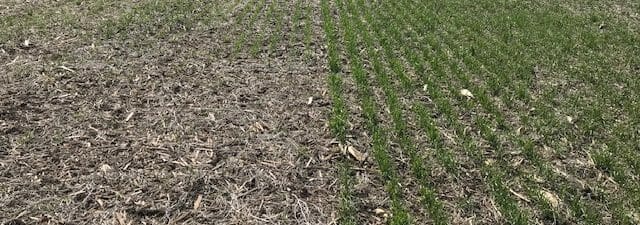
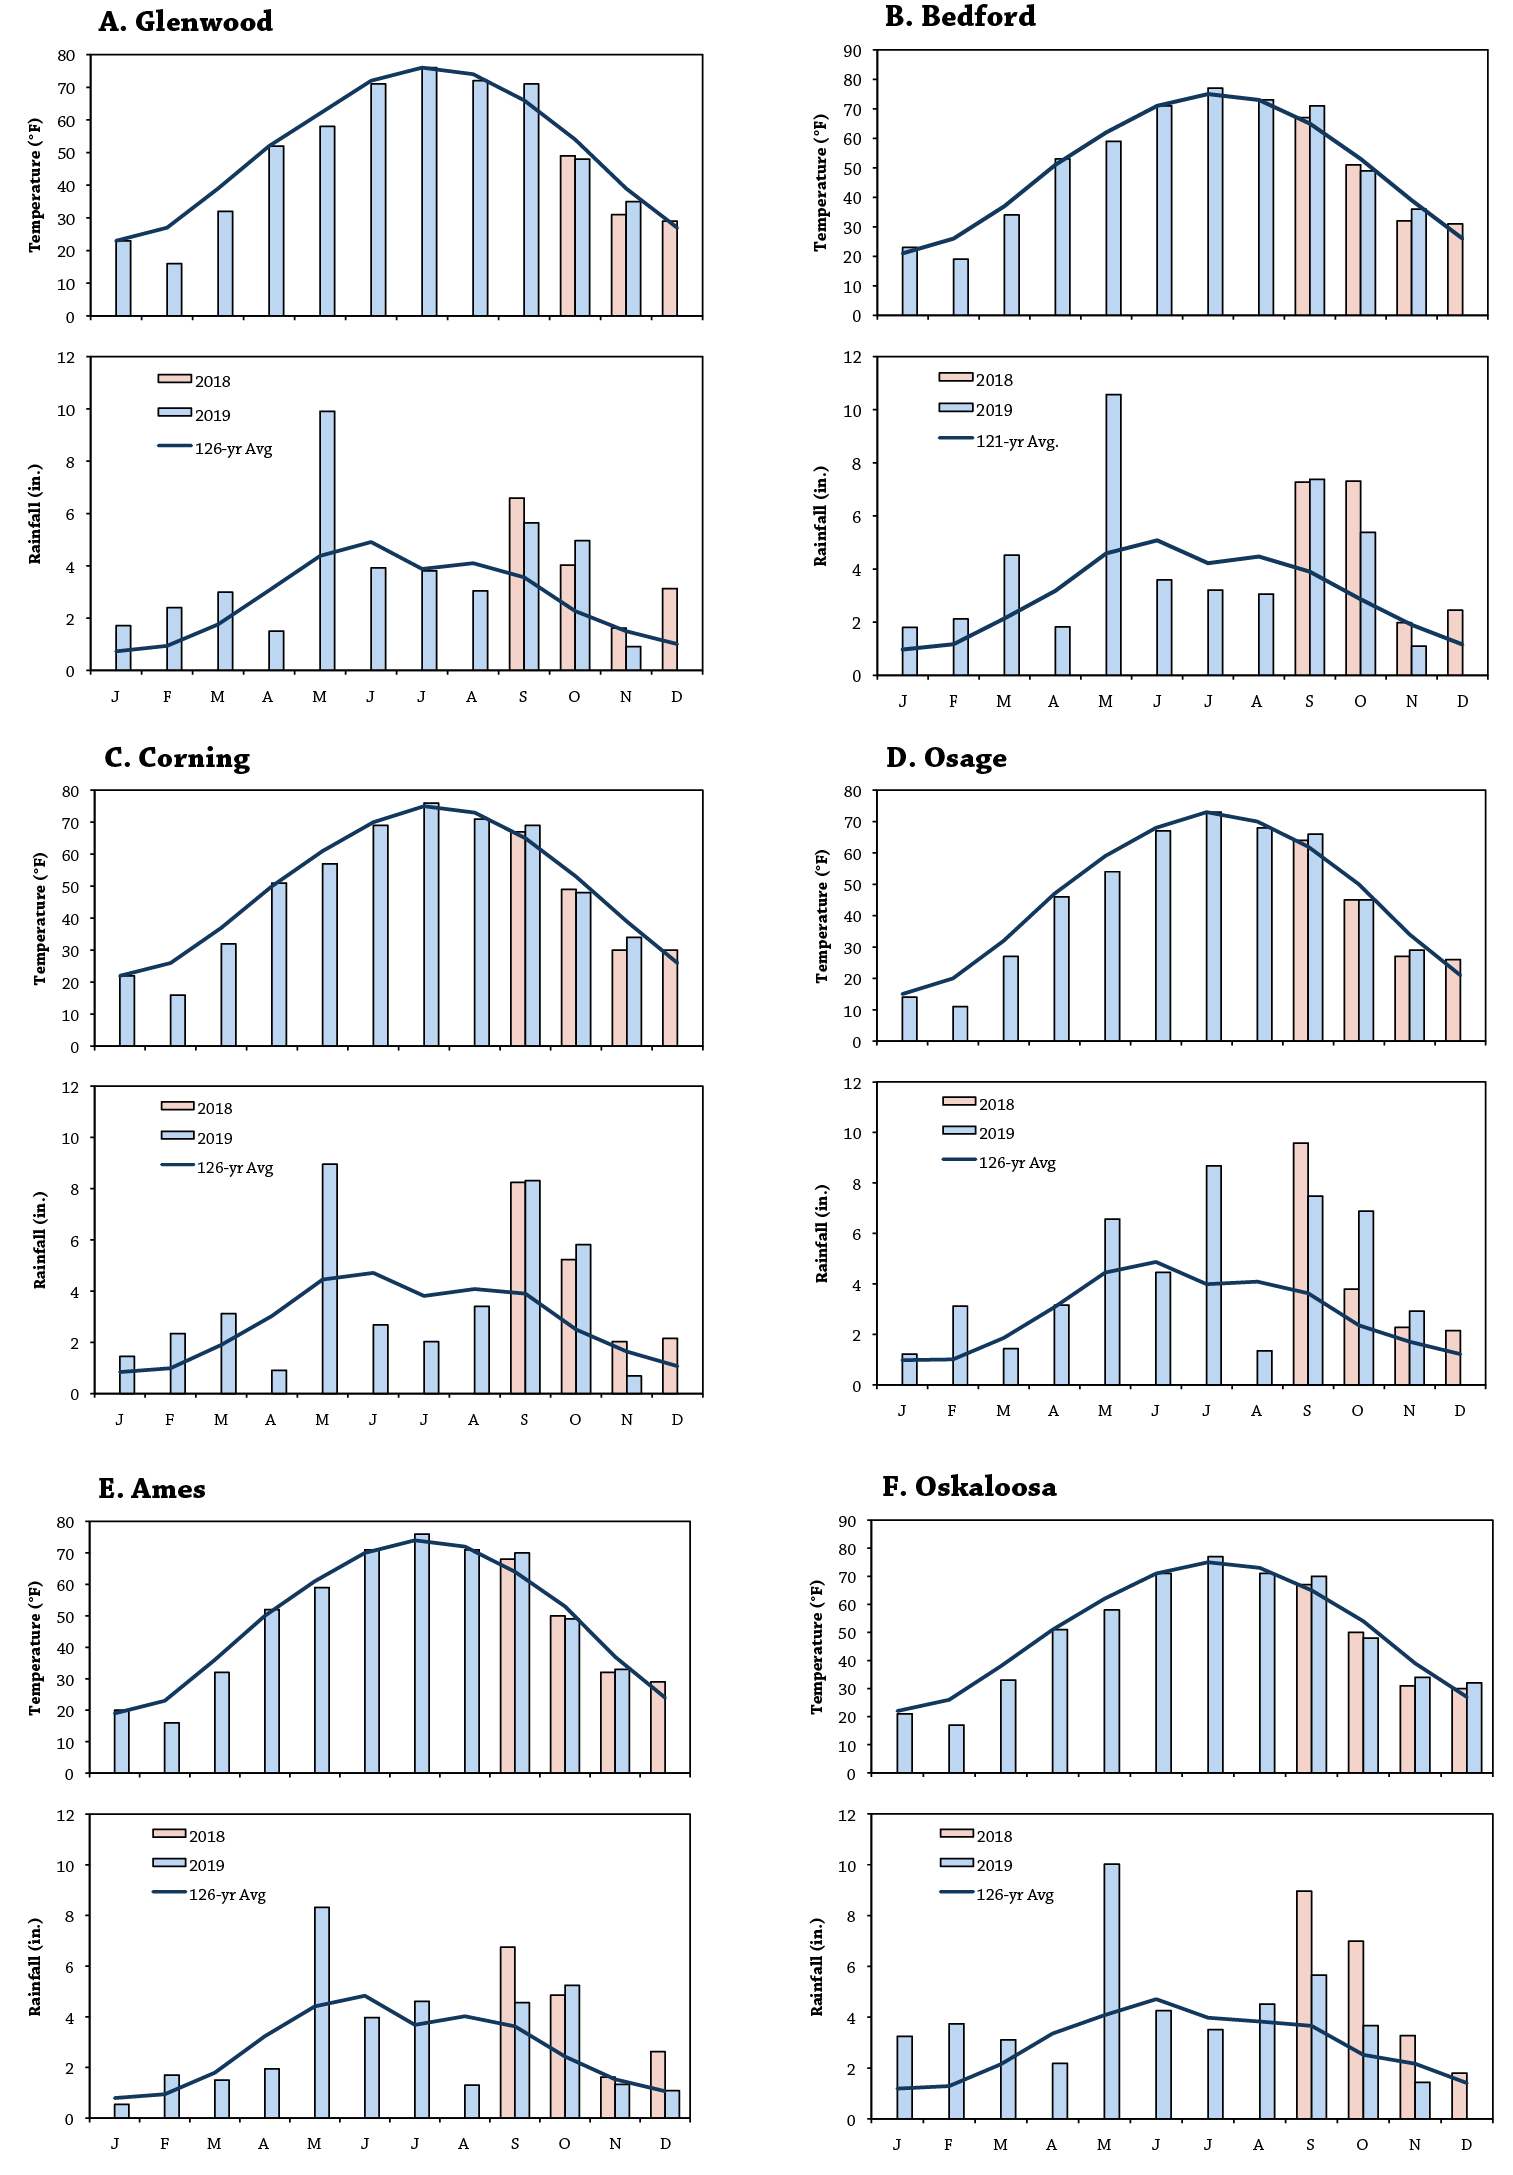
Rye groundcoverAt Bakehouse’s farm in 2018, reducing the seeding rate from 55 lb/ac to 28 lb/ ac resulted in less groundcover, and seeding earlier (Oct. 21) compared to later (Nov. 2) allowed Bakehouse to increase groundcover (Table 4). Cover crops in both seeding date treatments were seeded later than Bakehouse preferred due to a wet fall that delayed soybean harvest. The delayed planting coupled with cool, wet weather (Figure A2) likely contributed to the low amount of groundcover in all treatments.
Reducing the seeding rate from 55 lb/ac to 28 lb/ac resulted in less rye biomass at five of seven farms (Table 5). While reducing the rye seeding rate did not statistically reduce rye biomass at two sites, it did numerically reduce biomass by 263% at Jackson’s farm. The absence of statistical significance in this case is the result of increased variability among biomass measurements in each strip at Jackson’s. Conducting the trial an additional year could lead to more conclusive findings for the effect of reducing rye seeding rates at Jackson’s farm.
Seeding rye later compared to earlier resulted in less biomass at five of six farms, while seeding rye later at Norby’s did not reduce biomass. Biomass levels at all farms were very small. This can be attributed to delayed seeding of both seeding date treatments as well as to cool, wet fall and spring weather (Figure A2) that likely slowed rye growth.

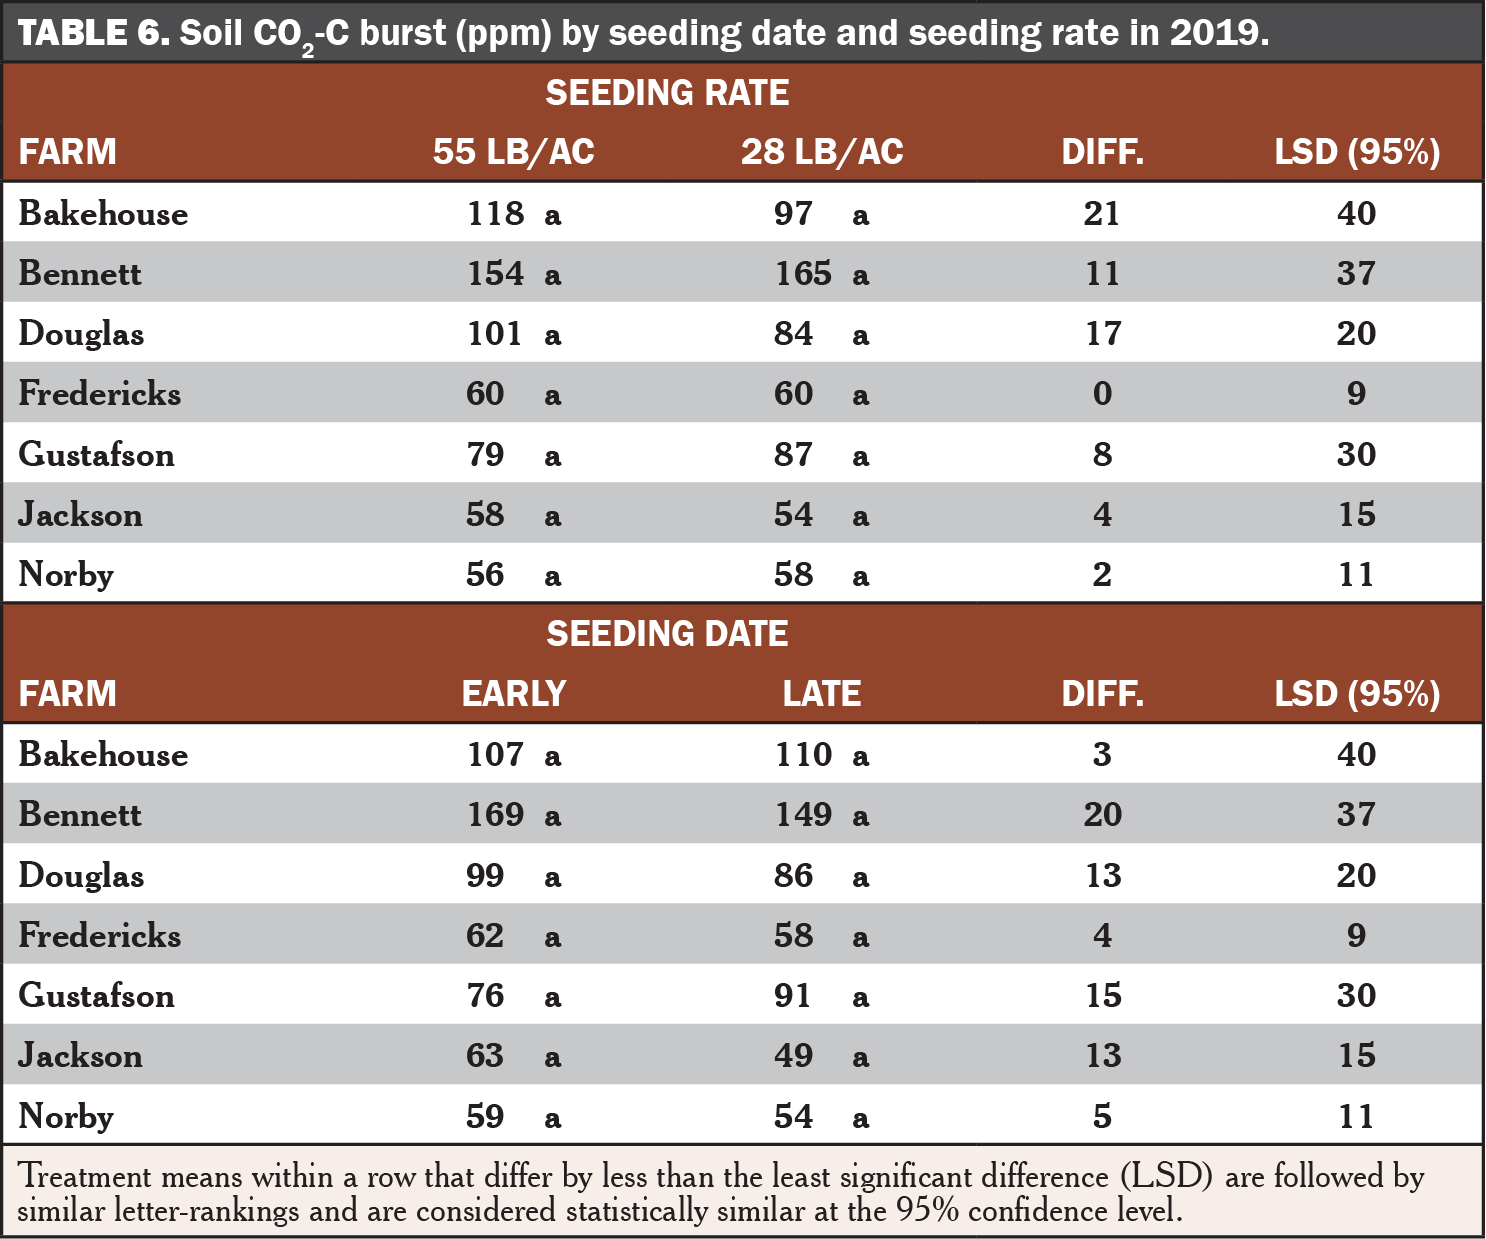 Soil health
All cooperators were able to get away with reducing the seeding rate and planting later without reducing soil health (Table 6). Although reducing the seeding rate resulted in less rye biomass at five farms, it did not negatively affect soil health at those sites nor at Jackson’s or Gustafsons’s sites where rye biomass was statistically similar between both seeding rates. Similarly, seeding later reduced rye biomass at five sites but did not reduce soil health at those same sites nor at Norby’s where rye biomass remained the same between both seeding dates.
Seeding rye at the full rate compared to the reduced rate as well as seeding rye earlier compared to later did not influence disease in corn seedling roots at Norby’s or Fredericks’ farms in 2018 (Table 7). The idea was that rye seeded at the full rate or rye seeded earlier might produce more biomass than rye seeded at the reduced rate or rye seeded later, and more rye biomass might translate to greater disease pressure in rye. With the ability for diseases to transfer from cereal rye to corn seedlings, greater rye biomass and disease pressure could mean greater disease pressure in corn seedlings.

However, the findings at Norby’s and Fredericks’ farms indicate this may not always be the case. Although both Norby and Fredericks experienced greater rye biomass as a result of seeding rye at the full rate compared to seeding it at the reduced rate (Table 5), neither experienced the anticipated increase in corn seedling disease. The effects of rye seeding date on corn seedling disease align with the anticipated outcomes at Norby’s farm but conflict with the anticipated outcomes at Fredericks’. While seeding rye earlier compared to later produced more rye biomass at Fredericks’, doing so did not translate to an increase in seedling disease. At Norby’s, seeding earlier also did not translate to an increase in seedling disease, but this aligns with his biomass findings in which seeding earlier did not produce more rye biomass. It is possible the effects of seeding date and rate on corn seedling disease would be more pronounced and statistically significant under weather conditions that do not delay rye seeding and which promote greater production of rye biomass. Both Norby and Fredericks experienced high levels of disease in all treatments despite the small amounts of rye biomass produced, which is likely the result of both farmers planting corn into living rye.
Corn yieldNeither reducing the rye seeding rate nor seeding at a later date affected corn yields at any farm (Table 8). Although reducing the rye seeding rate reduced rye biomass at five of seven farms and planting rye later reduced rye biomass at five of six farms, the reduction in rye biomass did not translate to any effect on corn yields.
One possible explanation for this is that the amounts of rye biomass produced in all treatments at each farm may have been too small to cause corn yield drag. This explanation is supported by the fact that corn yields reported in this trial are all greater than or equal to the 2019 county averages for each site despite following a cereal rye crop.[8] Furthermore, neither Bennett, Jackson, Norby, nor Fredericks waited the recommended 10- to 14-day interval to plant corn after terminating cereal rye but managed to maintain better yields than the county averages.

Conclusions and Next Steps
These trials provide evidence that reducing the seeding rate of cereal rye from 55 lb/ ac to 28 lb/ac can reduce rye biomass without reducing soil health. This outcome occurred at five of seven farms. However, reducing the seeding rate compromised some of the cover crop’s benefit by reducing groundcover at the one site that measured it. Despite the reduction to rye biomass that resulted from reducing rye seeding rates at five farms, there was no evidence to suggest that reducing rye biomass would result in less corn seedling disease or an improvement in corn yield; however, rye biomass amounts at all farms may have been too small in all treatments to negatively impact corn yield.
These trials also provide evidence that seeding rye later compared to earlier can reduce rye biomass. This outcome occurred at five of six sites while the remaining site was able to seed later without sacrificing rye biomass. However, the same site that was able to seed later without sacrificing rye biomass did experience a reduction in rye groundcover as a result of seeding later. Seeding rye later did not compromise soil health at any site despite the decrease in rye biomass that occurred at five of those sites. Seeding rye earlier versus later did not influence corn disease pressure, even though Fredericks’ early-seeded treatment produced more rye biomass. Corn yields were also unaffected by seeding rye earlier compared to later.
The findings of this report support the idea that seeding rye as early as possible and at the full rate are a farmer’s best bet for maximizing rye cover crop biomass in Iowa. An additional year of data will help to tell a clearer story. Dana Norby expressed a sentiment echoed by many others who conducted this trial – “I think good results were compromised because of late harvest and therefore late [cover crop] seeding.” Certainly, it will be interesting to see if findings change under different weather conditions. Several growers are repeating this trial in 2020.
Appendix - Trial Design and Weather Conditions
Funding Acknowledgement
This material is based upon work supported by the Natural Resources Conservation Services, U.S. Department of Agriculture, under number NR186114XXXXG003. Any opinions, findings, conclusions, or recommendations expressed in this publication are those of the authors and do not necessarily reflect the views of the U.S. Department of Agriculture.
References
- Blanco-Canqui, H., T.M. Shaver, J.L. Lindquist, C.A. Shapiro, R.W. Elmore, C.A. Francis and G.W. Hergert. 2015. Cover crops and ecosystem services: Insights from studies in temperate soils. Agronomy Journal. 107:2449–2474. https://doi-org.proxy.lib.iastate.edu/10.2134/agronj15.0086 (accessed April 2020).
- Acharya, J., M.G. Bakker, T.B. Moorman, T.C. Kaspar, A.W. Lenssen and A.E. Robertson. 2017. Time Interval Between Cover Crop Termination and Planting Influences Corn Seedling Disease, Plant Growth, and Yield. Plant Disease. 101:591–600. https://apsjournals.apsnet.org/doi/pdf/10.1094/PDIS-07-16-0975-RE (accessed April 2019).
- Basche, A.D. and M.S. DeLonge. 2019. Comparing infiltration rates in soils managed with conventional and alternative farming methods: A meta-analysis. PLOS ONE. 14: http://dx.plos.org/10.1371/journal.pone.0215702 (accessed February 2020).
- Iowa Learning Farms. 2019. Building A Culture of Conservation. Iowa Learning Farms. https://www.iowalearningfarms.org/files/page/files/ilf-15yr-report-final-web_reduced.pdf (accessed April 2020).
- Nelson, H. and S. Bennett. 2018. Cereal Rye Cover Crop for Reducing Herbicides in Soybeans. Practical Farmers of Iowa Cooperators’ Program. https:// practicalfarmers.org/research/cereal-rye-cover-crop-for-reducing-herbicides-in-soybeans/ (accessed March 2020).
- Gailans, S. and S. Bennett. 2019. Cereal Rye Cover Crop for Reducing Herbicides in Soybeans. Practical Farmers of Iowa Cooperators’ Program. https:// practicalfarmers.org/research/cereal-rye-cover-crop-for-reducing-herbicides-in-soybeans-2019/ (accessed March 2020).
- Gailans, S. and J. Boyer. 2015. Effect of Seeding Date on Cover Crop Performance. Practical Farmers of Iowa Cooperators’ Program. https://practicalfarmers.org/research/effect-of-seeding-date-on-cover-crop-performance/ (accessed April 2020).
- Johanns, A. 2020. Historical Corn Yields by County in Iowa. A1-12. Ag Decision Maker. Iowa State University Extension and Outreach. https://www.extension.iastate.edu/AgDM/crops/pdf/a1-12.pdf (accessed April 2020).
- Iowa Environmental Mesonet. 2020. IEM “Climodat” Reports. Iowa State University Department of Agronomy. http://mesonet.agron.iastate.edu/climodat/ (accessed April 2020).