

Effects of Johnson-Su Compost Extract on Pasture Production and Quality
This research was funded by Cargill and Walton Family Foundation.
In a Nutshell:
- Johnson-Su is a composting method that allows for rapid and complete breakdown of materials such as woodchips, leaves, and manure for soil amendment.
- Rory Van Wyk of Winterset, IA wondered if applying Johnson-Su compost extract on his pasture would affect pasture production and quality as measured by Brix values.
Key Findings
- Van Wyk tested four Johnson-Su compost extract treatments (control, seed applied, foliar applied, seed + foliar applied).
- Treatments did not affect forage biomass production or soil compaction. Control treatment forage has a significantly higher Brix value than foliar treatment forage, perhaps an indication of higher sugars or nutrient content in this forage.
Background
Johnson-Su is a method of creating compost from wood chips and/or leaves in large, passively aerated and watered piles. This method is attractive because the process does not smell or require turning. People frequently make compost “extracts” out of the finished compost by mixing it with water and applying the resulting dilute product as a soil amendment. Rory Van Wyk wanted to determine the effects of compost extract created by the Johnson-Su method applied at the time of pasture establishment on pasture production and quality. Van Wyk applied the compost extract as a seed treatment or as a foliar spray and measured pasture dry matter production, Brix levels of the forage and soil compaction. He hopes this trial will help him “to determine if this practice will move us toward our financial goal.”
Methods
Design
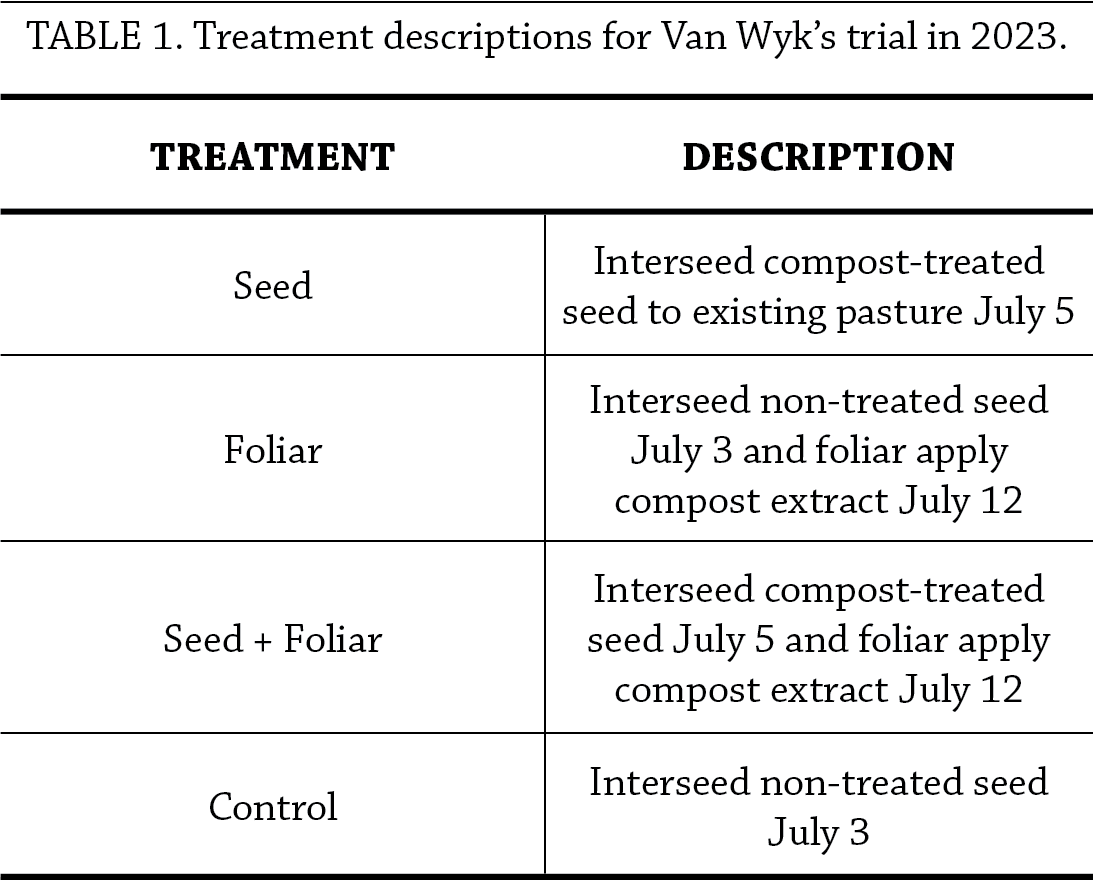
Treatment descriptions are shown in Table 1. The experiment was established in a pasture that is more than 10 years old and predominately contains timothy, smooth brome, orchard grass and red clover with some other legumes also present. Van Wyk planted five 60-by-60 foot replicates of each treatment for a total of 20 strips in a randomized plot strip-plot design, as shown in Figure A1. Interseeding mix was seeded at 14 lb/ac and was composed of sunn hemp (3 lb), mung beans (3 lb), black oil sunflower, (3 lb), MS forage sorghum (2 lb), Coes forage sorghum (1 lb) and hybrid pearl millet (1 lb). Johnson-Su compost was obtained from Midwest Soil Restore. Compost extract was created by mixing compost with water to a pancake batter consistency. Seed treatment with compost extract was accomplished by mixing extract created with two pounds of compost with 75 pounds of seed, stirring, and drying seed briefly on a tarp.
Measurements
Van Wyk measured dry matter production by collecting aboveground biomass from three locations in each strip in mid-September (roughly two months after treatments were applied). He recorded the date and area sampled, placed the biomass in paper bags and allowed it to dry for 3–4 weeks before weighing. Before drying, he measured Brix levels of a subsample of the forage by squeezing liquid from the green material and reading the percent sucrose on a refractometer. Finally, when collecting biomass Van Wyk also determined soil compaction with a penetrometer by measuring the depth to 300 psi from the soil surface at four locations in each strip.
Data analysis
We used Fischer’s LSD at a 90% confidence level to determine if there were significant differences in compost extract application treatments. For each metric, the difference between any two treatments is compared with the LSD. A difference greater than or equal to the LSD indicates the presence of a statistically significant treatment effect, meaning one treatment outperformed the other and the farmer can expect the same results to occur 90 out of 100 times under the same conditions. A difference smaller than the LSD indicates the difference is not statistically significant and the treatment had no effect. We can perform this analysis because Van Wyk used a completely randomized and replicated experimental design (Figure A1).
Results and Discussion
Van Wyk found no differences in soil compaction or forage biomass production between treatments when he measured them in mid-September (Table 2). However, he did find that the forage Brix level was significantly higher in the control vs. foliar treatment at this time (Figure 1). Brix level is an estimate of the water soluble content of the forage crop as a percent of the total weight, and higher values can be associated with higher palatability and potentially higher sugar content and nutrient availability. However, a full nutrient analysis of forage is necessary to really assess forage quality.

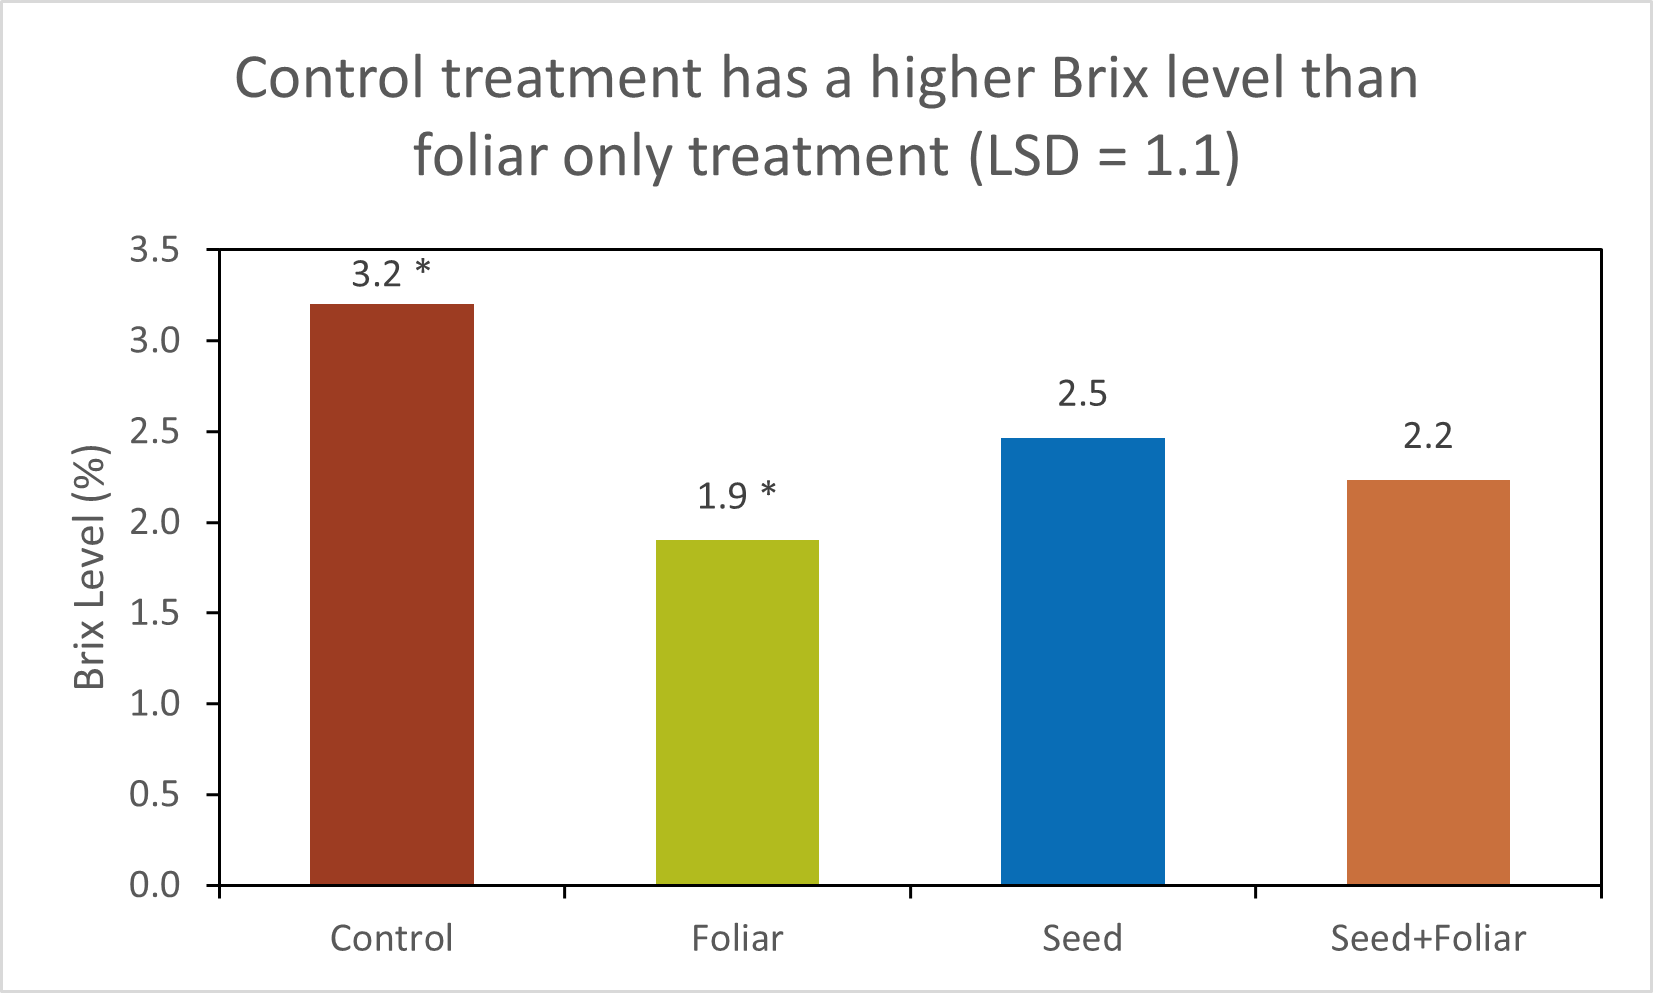
Figure 1: Average degrees Brix of forage biomass from Van Wyk’s four treatments. *Indicates that these two treatments are significantly different from each other; the difference between the values is greater than the least significant difference (LSD = 1.1).
Van Wyk reflects that he “will probably use Johnson-Su compost on my pastures again, though maybe on blocks larger than 60×60 ft, and see if the animals show any preference for treated or untreated areas when given access to both simultaneously.” He also wondered if the very dry conditions experienced in summer of 2023 could have negatively affected the results (Figure A2), and if the microorganisms in the compost extract would have affected forage biomass or other measured outcomes in a wetter year.
Conclusions and Next Steps
There were no significant differences in forage biomass or soil compaction between the four Johnson-Su compost extract treatments. Van Wyk plans to continue trying Johnson-Su compost extract on his pastures, and notes that he learned a lot about conducting research over the course of this trial. “I learned about calibrating a planter, how timing of planting in relation to rainfall can drastically affect soil conditions and germination and growth rates, how time-consuming research can be, and the importance of evaluating the possible explanations for the results.” These lessons will surely be applied to future trials.
Appendix – Trial Design and Weather Conditions
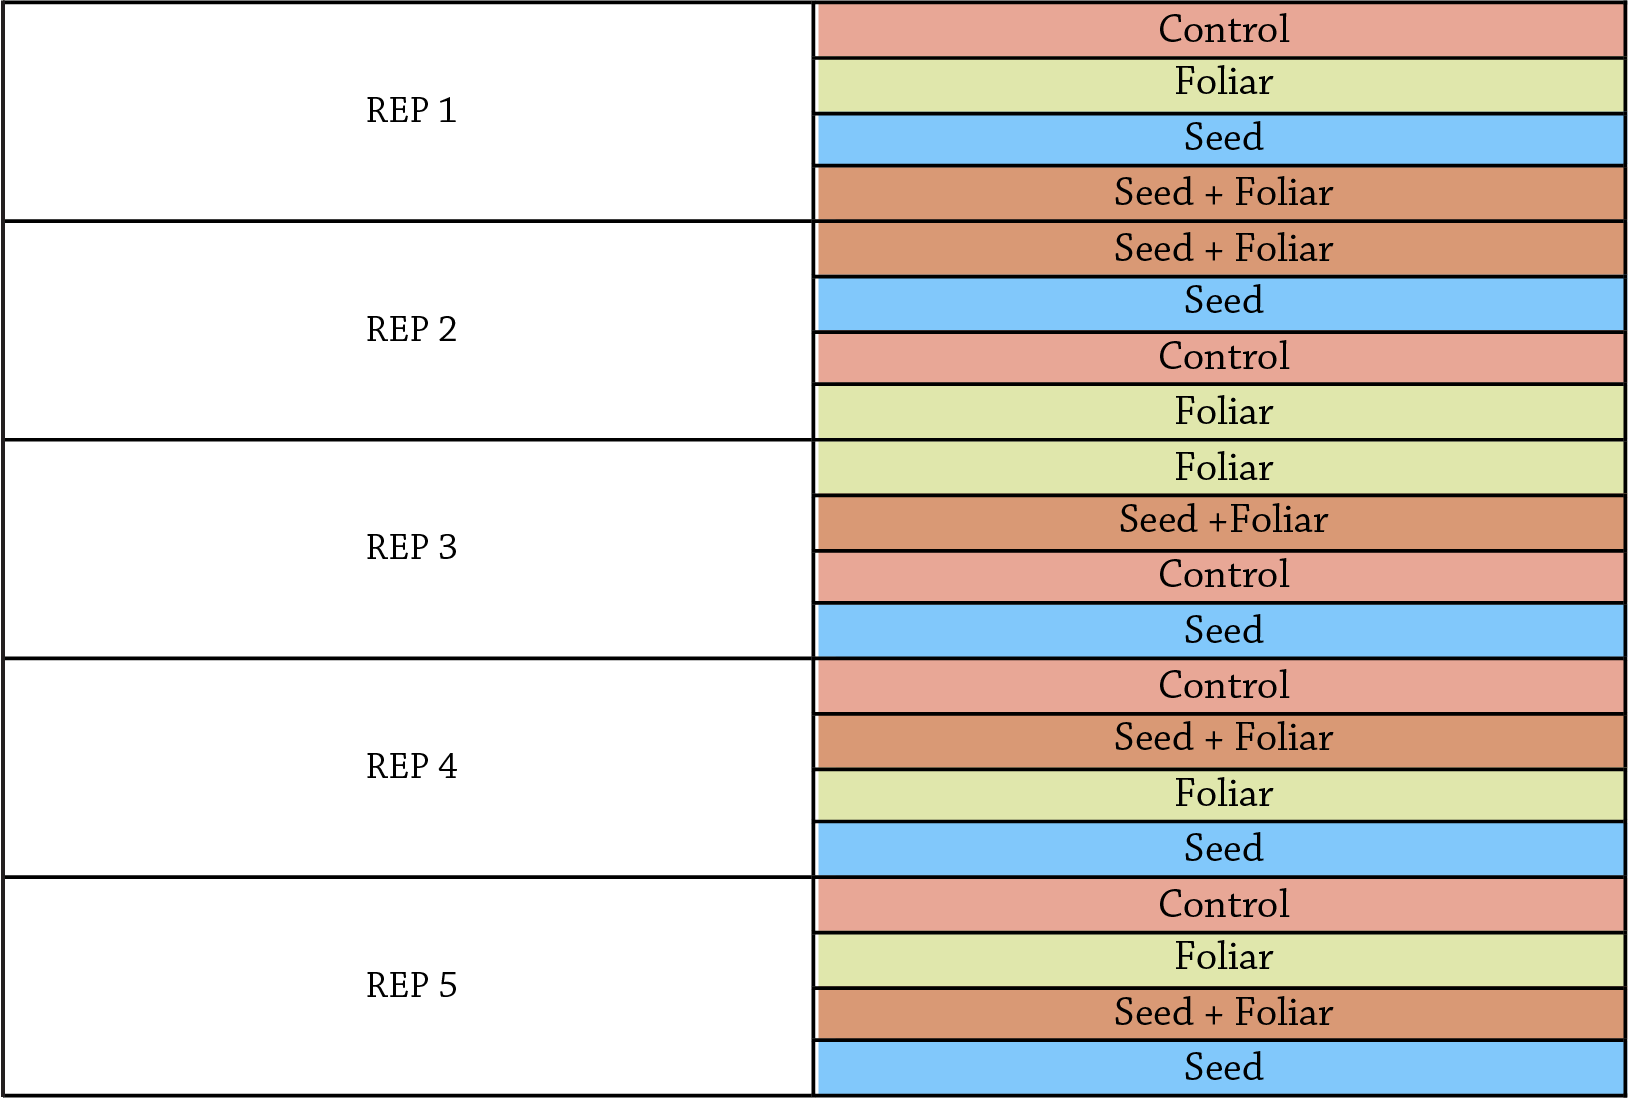
Figure A1. Example of experimental design used by Van Wyk.
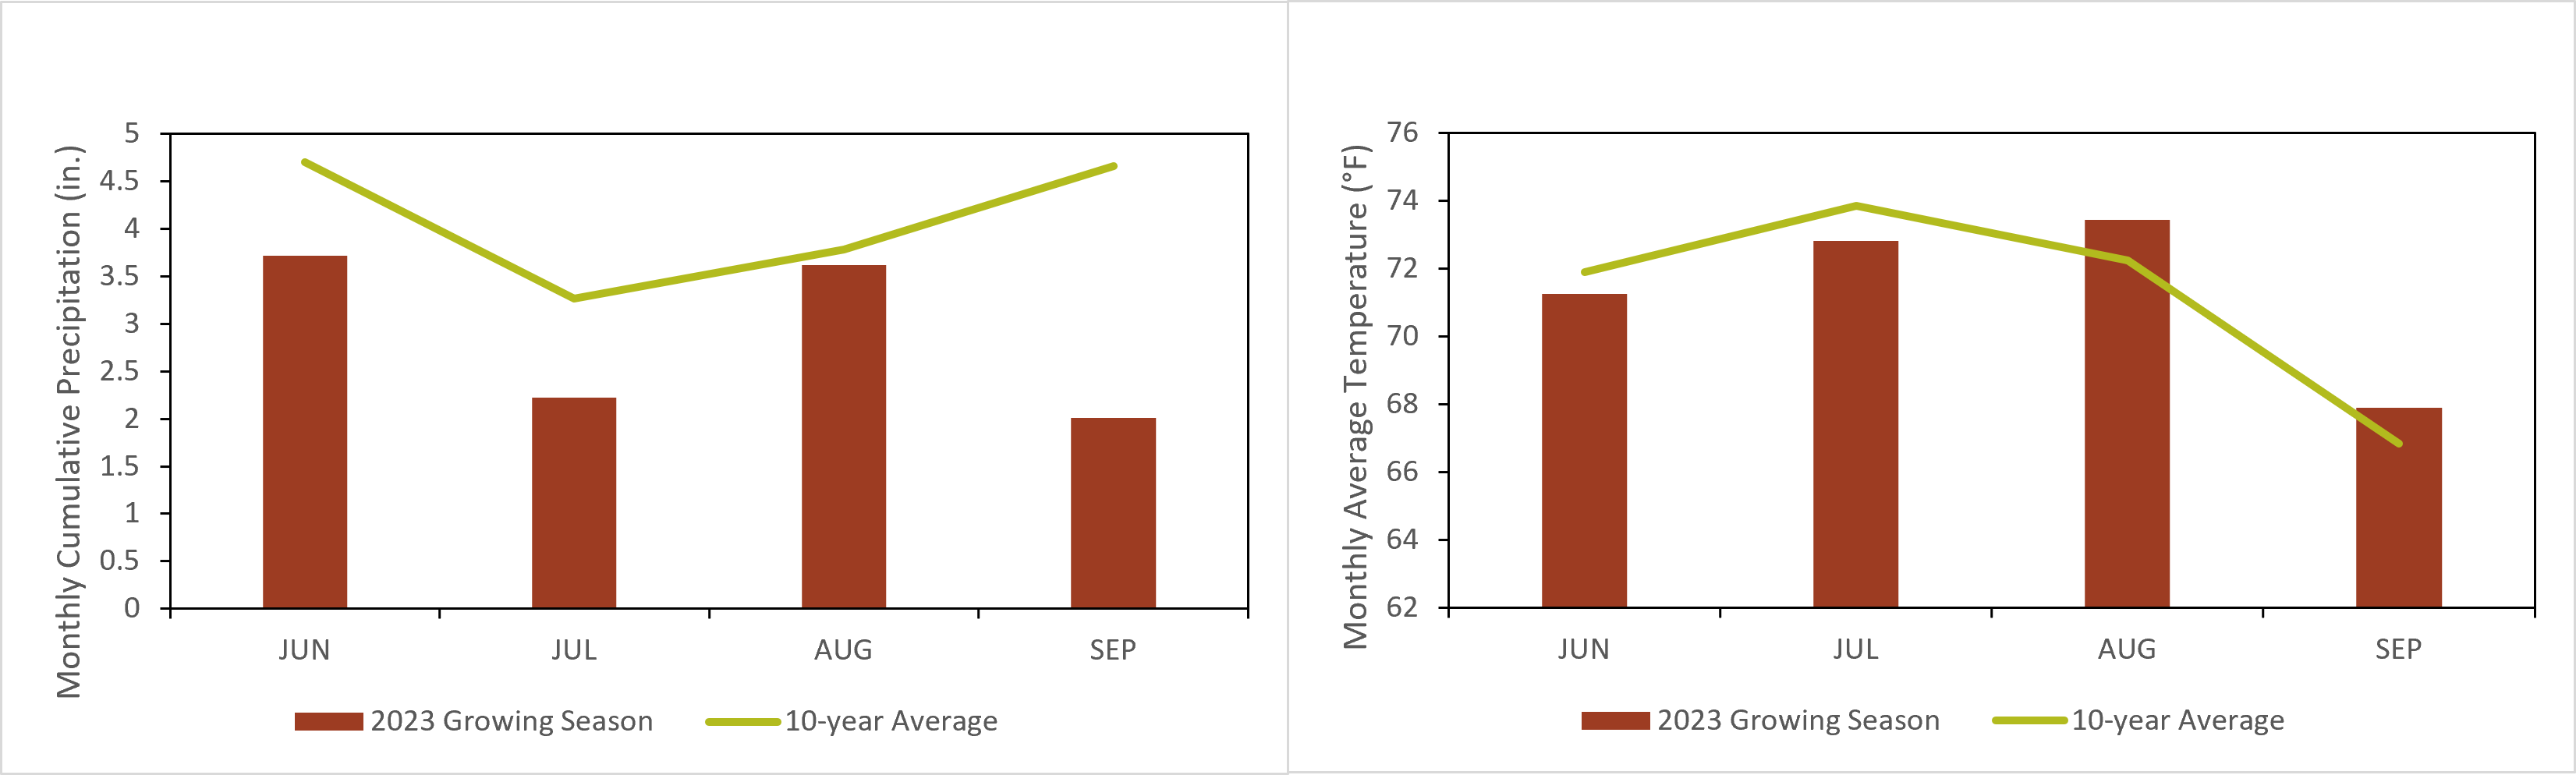
Figure A2. Weather in the 2023 growing season at Winterset, IA [1]. Monthly cumulative precipitation is shown in the left panel and monthly mean temperature is shown in the right panel. Click to enlarge.
References
[1] Climodat Reports, “Iowa Environmental Mesonet.” Iowa State University. [Online]. Available: http://mesonet.agron.iastate.edu/climodat/