In a Nutshell:
- A successful management strategy for corn and soybeans following a cereal rye cover crop may differ across farms in terms of tillage, N fertilizer application or both.
- Farmer-cooperators Jack Boyer, Tim Sieren and Jeremy Gustafson compared no-till and strip-till when planting their corn or soybeans following a cereal rye cover crop.
Key Findings
- No-till and strip-till resulted in similar corn yields at Boyer’s and similar soybean yields at Gustafson’s. Compared to strip-till, Boyer scored greater returns by $28/ac and Gustafson scored greater returns by $1/ac with no-till.
- Boyer saw similar corn yields between two N fertilizer rates (150 and 190 lb N/ac) regardless of tillage.
- Strip-till resulted in greater corn yields (by 15 bu/ac) and returns (by $31/ac) at Sieren’s compared to no-till.
Background
With proper management, a cereal rye cover crop can maintain, or improve, corn and soybean yields compared to when no cover crop is used.[1] Because cereal rye cover crops can result in early season soil and fertilizer N immobilization that can negatively affect crop yields, [2,3] proper management includes considerations for cover crop termination date and a sufficient N fertilizer program. On-farm research conducted by PFI cooperators Jack Boyer and Jeremy Gustafson has shown no yield penalty to soybeans that were planted directly into a living cereal rye cover crop that was terminated within the next few days.[4,5] Attempting the same approach with corn, PFI cooperators Dick Sloan and Tim Sieren saw corn yields reduced by 5–21 bu/ac compared to when the cover crops were terminated at least two weeks prior to planting the corn.[6,7] When a cereal rye cover crop is terminated two weeks prior to planting corn, research by PFI cooperators[7,8] and scientists at Iowa State University[9] suggests that higher N fertilizer rates are not required for optimal yields. Those studies found that applying the same amount of N fertilizer as one would with no cover crop resulted in similar corn yields. Finally, research in southeast Ontario found that equivalent corn yields can be achieved among full-width tillage, strip-till and no-till systems when a cereal rye cover crop is terminated two weeks prior to corn planting.[10] Costs among tillage regimes, however, can vary and farmers often wonder about the ultimate impact of tillage passes on returns on investment.
Methods
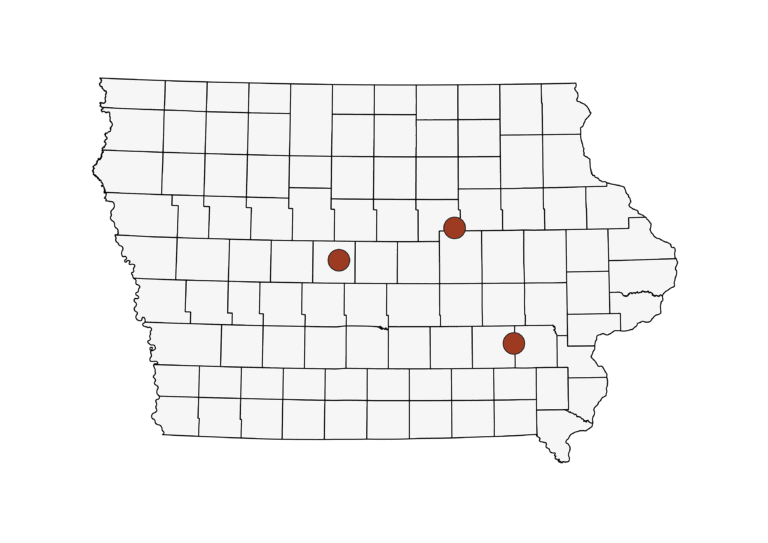
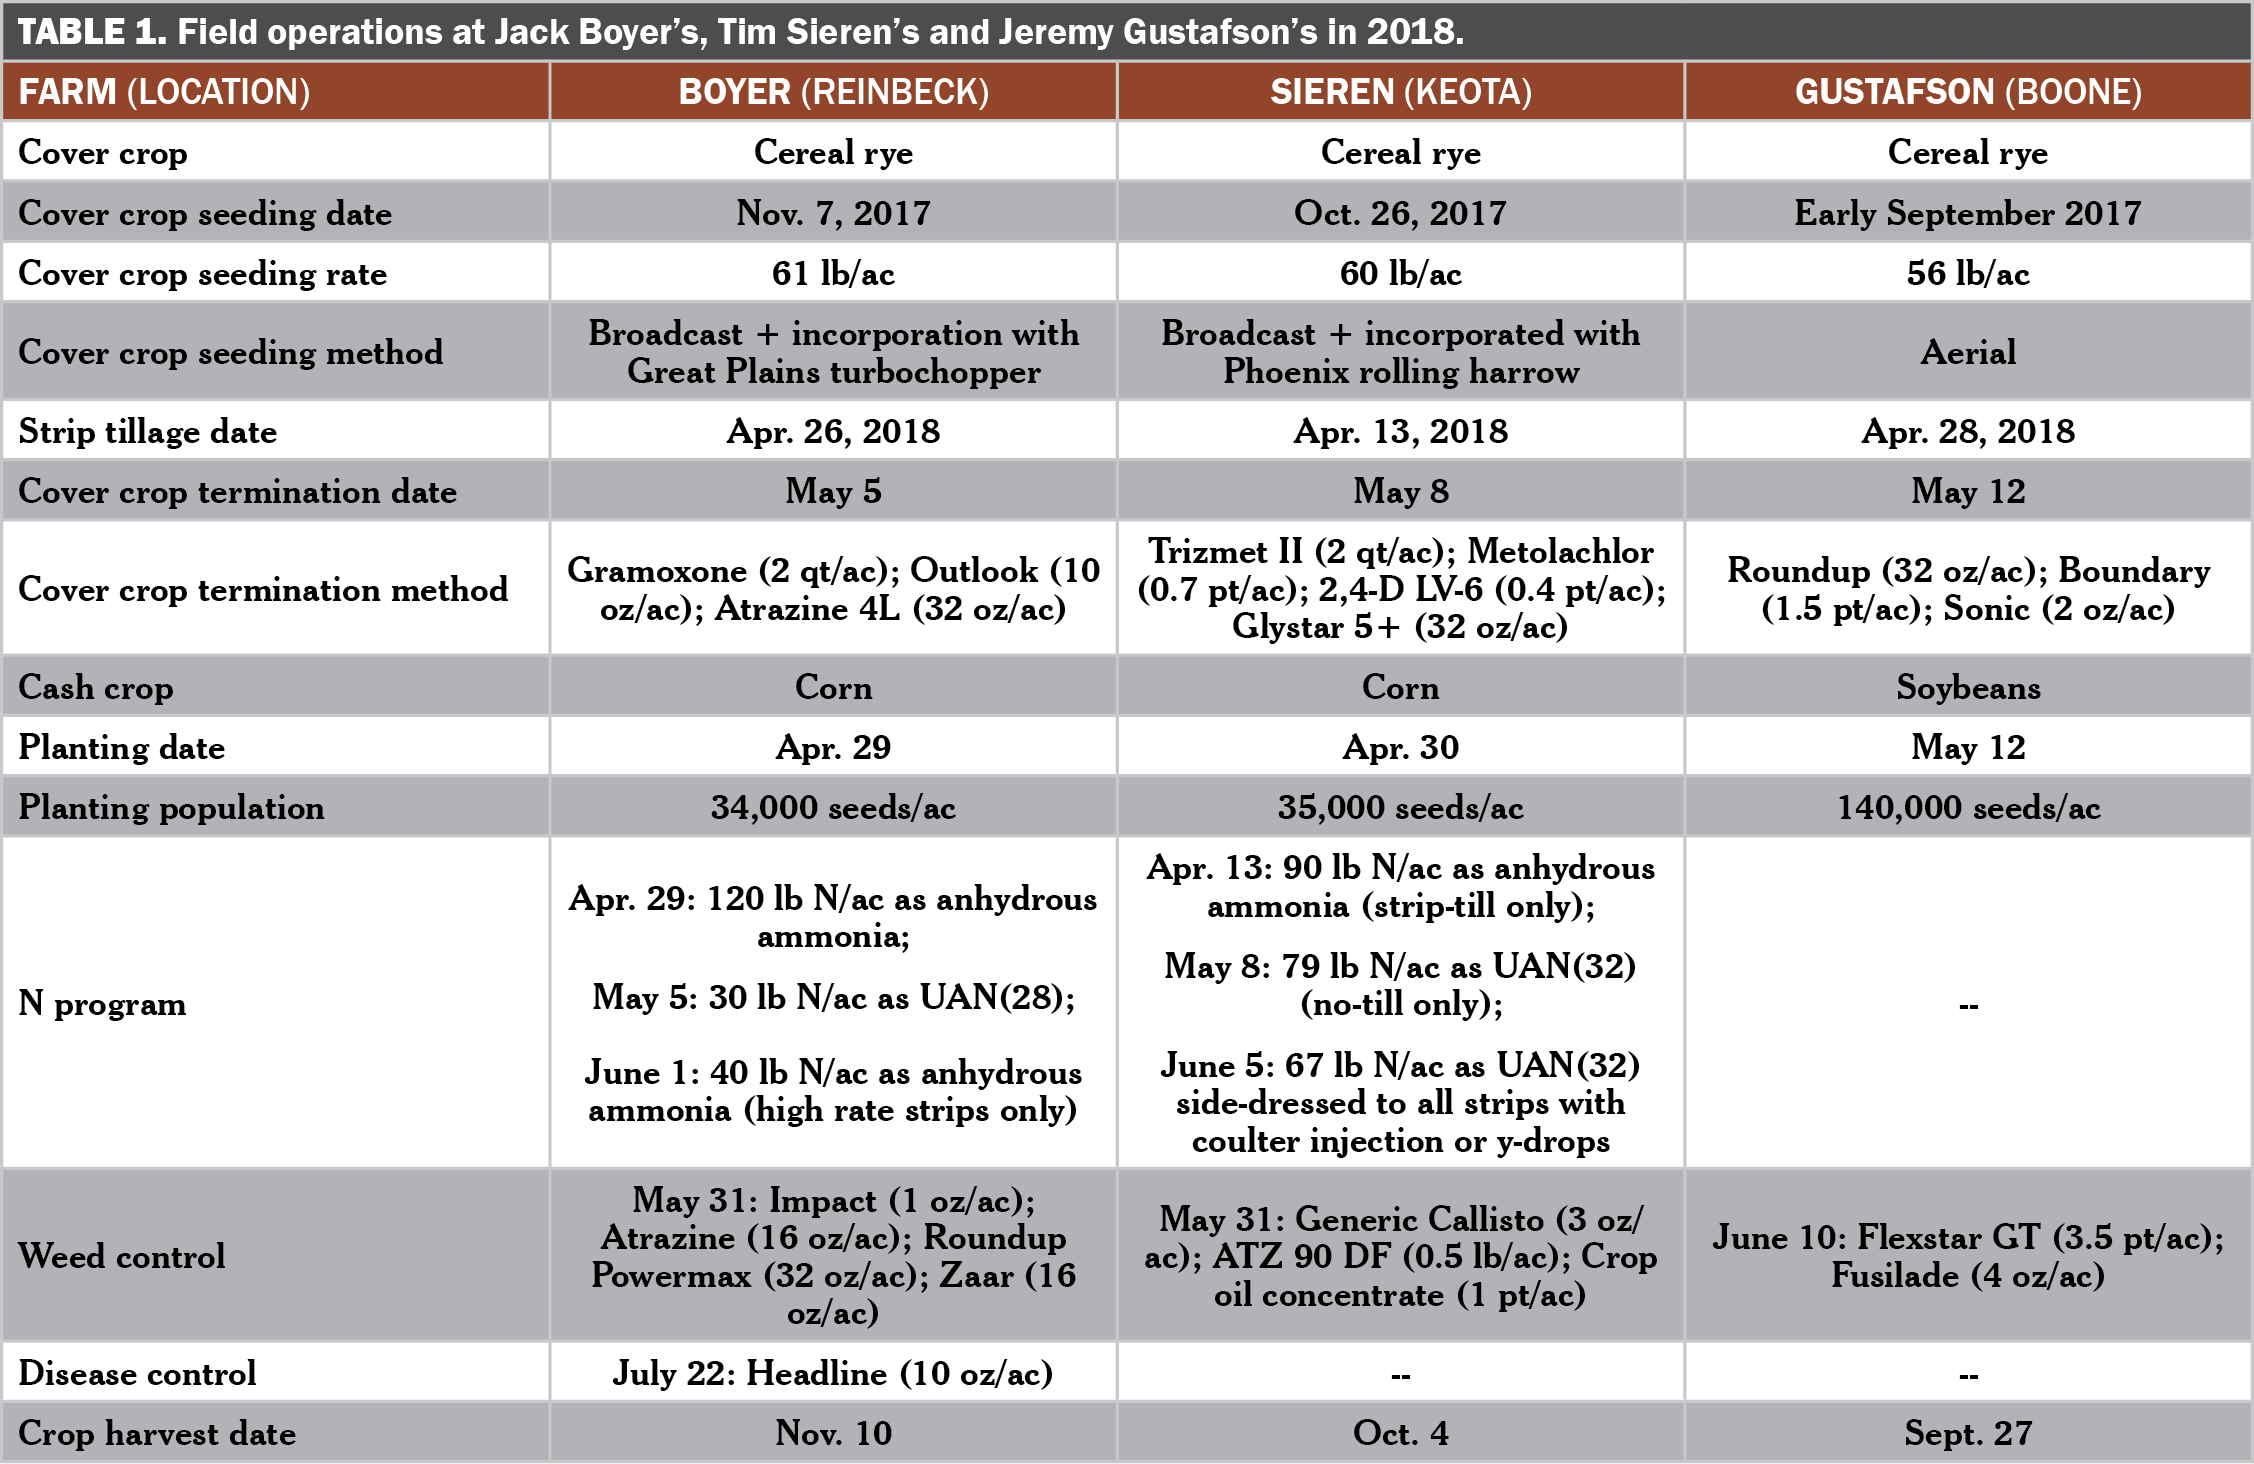
This study was conducted by Jack Boyer near Reinbeck in Tama County; Tim Sieren near Keota in Washington County; and Jeremy Gustafson near Boone in Boone County. All three cooperators seeded a cereal rye cover crop in Fall 2017 and evaluated the effect of no-till planting or strip-till planting on the succeeding cash crop in 2018. Boyer and Sieren planted corn; Gustafson planted soybeans.
The experimental design at Boyer’s was a randomized complete block and the treatment arrangement was a split-plot. Main plot treatments were no-till and strip-till. Main plots were divided into two, side-by-side split-plots. The split-plot treatments were two N fertilizer rates: 150 and 190 lb N/ac (difference achieved at side-dress). Each main × split-plot treatment was replicated four times. The main plot treatment strips measured 30 ft wide and ran the length of the field. The experimental design at Sieren’s was a randomized complete block with a split-plot treatment arrangement. Main plot treatments were no-till and strip-till. The split-plot treatments were two side-dress N application methods: coulter-injection and Y-drop. Each main × split-plot treatment was replicated four times. Regardless of side-dress method, no-till strips received a total of 147 lb N/ac as fertilizer and strip-till strips received a total of 157 lb N/ac as fertilizer. Main plot treatment strips measured 20 ft wide and 894 ft long (0.4 ac each). The experimental design at Gustafson’s was a randomized complete block with four replications. Treatments were no-till and strip-till. Each treatment strip measured 25 ft wide and ran the length of the field. Cover crop and crop management details for each farm are provided in Table 1.
 Field sampling
Cover crop aboveground biomass samples were collected shortly before termination at the Sieren and Gustafson farms. Low amounts of cover crop growth precluded sampling at Boyer’s.
Incidence of corn seedling disease was assessed in late May at Boyer’s and Sieren’s by Dr. Alison Robertson’s lab team from the ISU Department of Plant Pathology and Microbiology. This assessment occurred before the split-plot treatments were established at either farm.
Soil samples were collected to a depth of 6-in. in mid-June at the Boyer and Sieren farms. Samples were sent to AgSource Laboratories (Ellsworth, IA) to determine the burst of CO2-C following rewetting of dried soil using the Solvita assay. Corn stalk samples were collected for NO3-N concentration analysis after the corn reached physiological maturity at Sieren’s on Sept. 13.
Corn was harvested individually from each strip at Boyer’s and Sieren’s and corrected to 15.5% moisture. Soybeans were harvested individually from each strip at Gustafson’s and corrected to 13% moisture.
Data were analyzed using JMP Pro 13 (SAS Institute Inc., Cary, NC) statistical software. Means separations are reported using Tukey’s Least Significant Difference (LSD). Statistical significance was determined at the 95% confidence level.
Field sampling
Cover crop aboveground biomass samples were collected shortly before termination at the Sieren and Gustafson farms. Low amounts of cover crop growth precluded sampling at Boyer’s.
Incidence of corn seedling disease was assessed in late May at Boyer’s and Sieren’s by Dr. Alison Robertson’s lab team from the ISU Department of Plant Pathology and Microbiology. This assessment occurred before the split-plot treatments were established at either farm.
Soil samples were collected to a depth of 6-in. in mid-June at the Boyer and Sieren farms. Samples were sent to AgSource Laboratories (Ellsworth, IA) to determine the burst of CO2-C following rewetting of dried soil using the Solvita assay. Corn stalk samples were collected for NO3-N concentration analysis after the corn reached physiological maturity at Sieren’s on Sept. 13.
Corn was harvested individually from each strip at Boyer’s and Sieren’s and corrected to 15.5% moisture. Soybeans were harvested individually from each strip at Gustafson’s and corrected to 13% moisture.
Data were analyzed using JMP Pro 13 (SAS Institute Inc., Cary, NC) statistical software. Means separations are reported using Tukey’s Least Significant Difference (LSD). Statistical significance was determined at the 95% confidence level.
Results and Discussion
Cover crop biomass
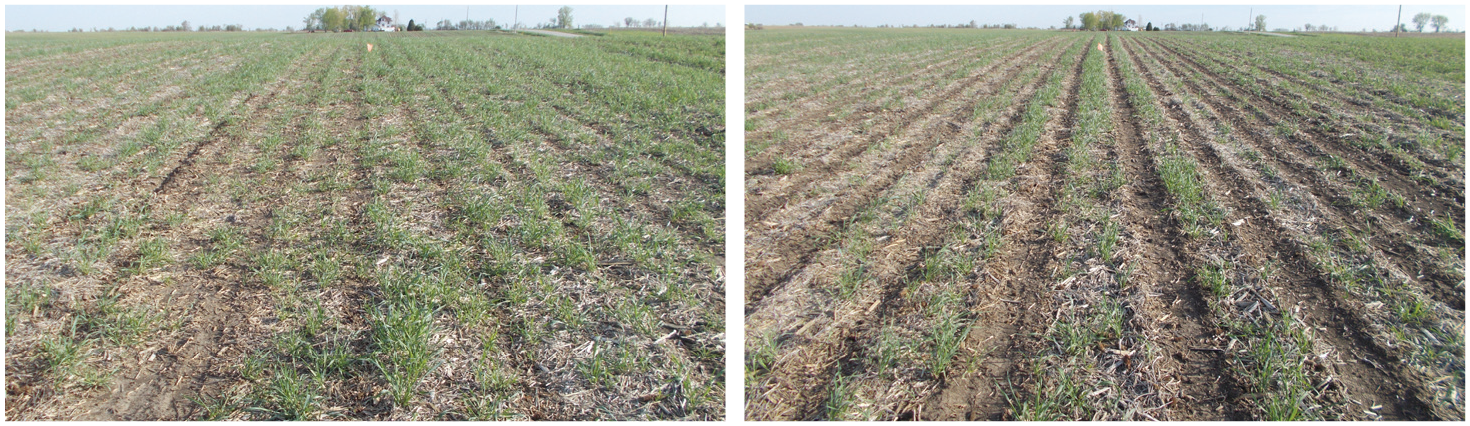
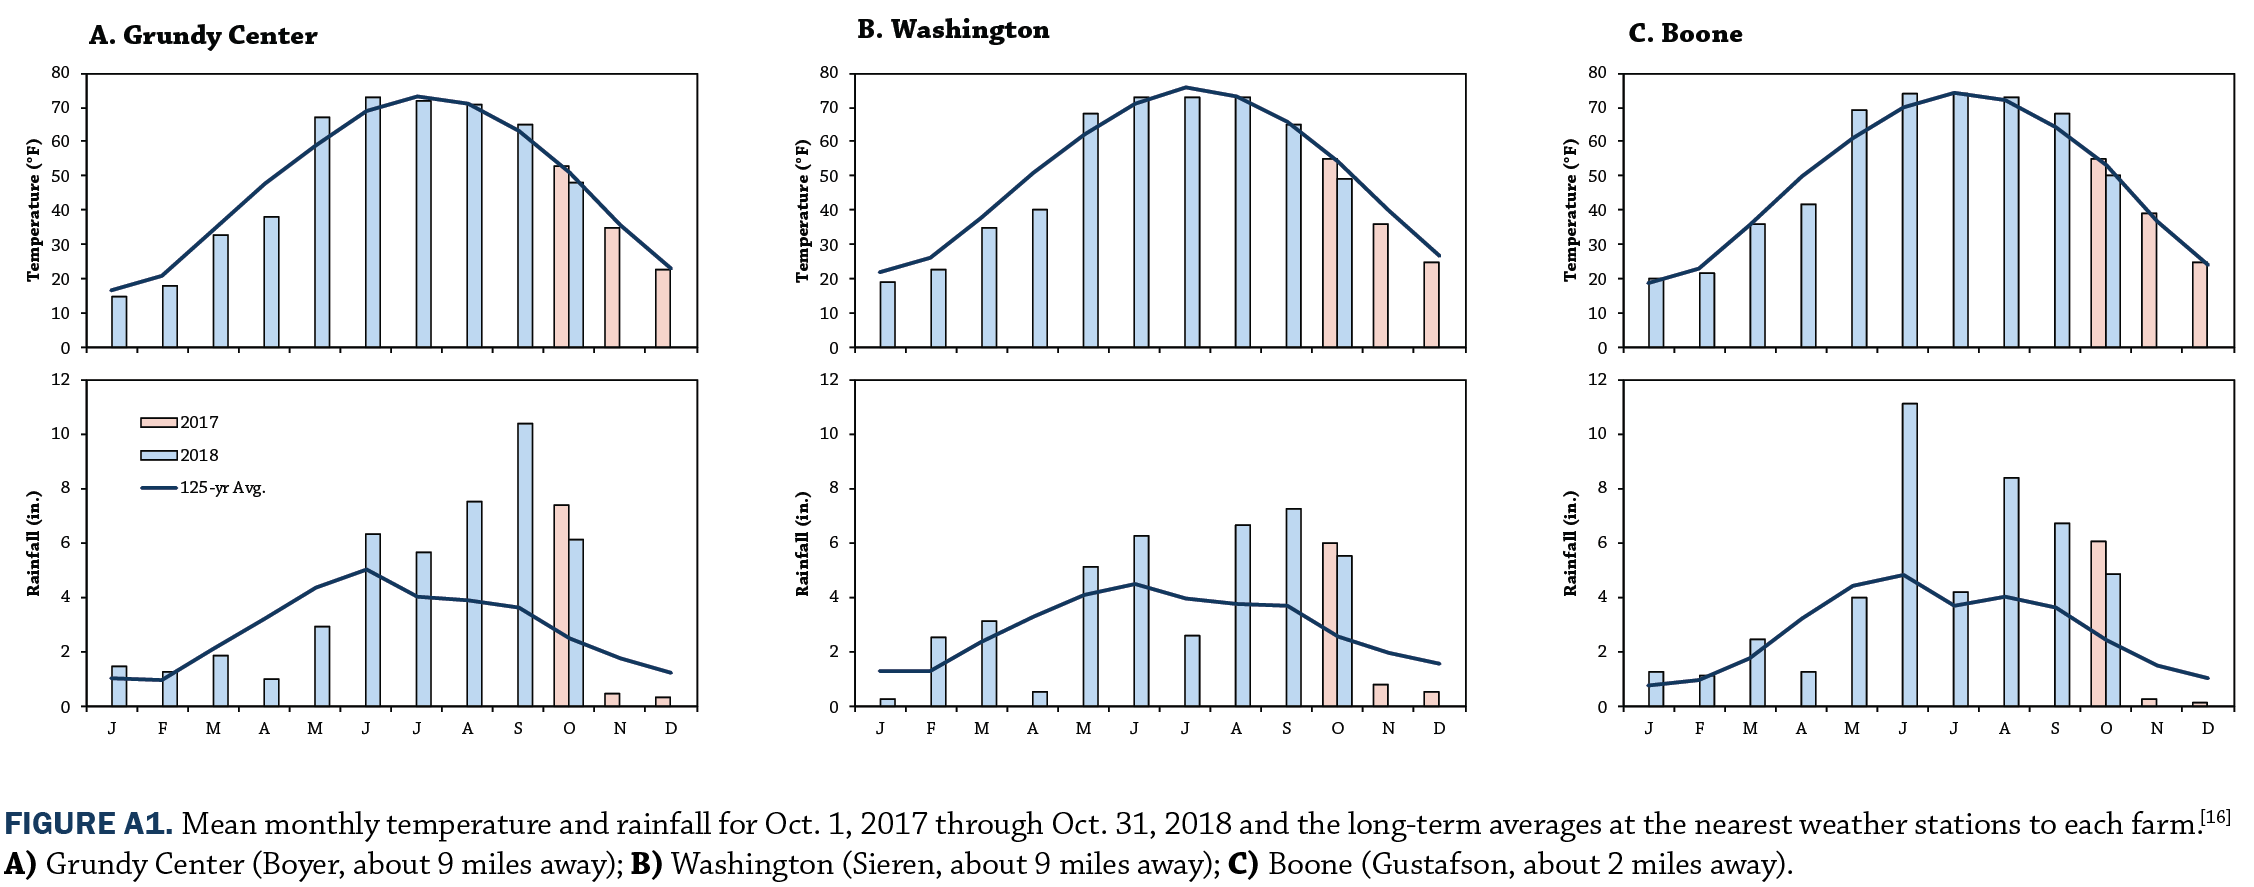
Air temperatures during the February–April period at all farms were below the long-term normal (Figure A1). This, along with a very dry April at each farm, likely contributed to low amounts of cover crop growth observed during the spring. As such, Boyer and Sieren terminated their cover crops approximately one week after planting corn (Table 1). Gustafson terminated his cover crop the same day he planted soybeans. Though Boyer did not collect samples, he estimated the cereal rye cover crop was approximately 4 in. tall at the time of termination. The average amount of cover crop biomass prior to termination at Sieren’s was 348 lb/ac (eight days after planting corn). At Gustafson’s, the average amount of cover crop biomass at termination was 832 lb/ac.
Corn seedling disease incidence
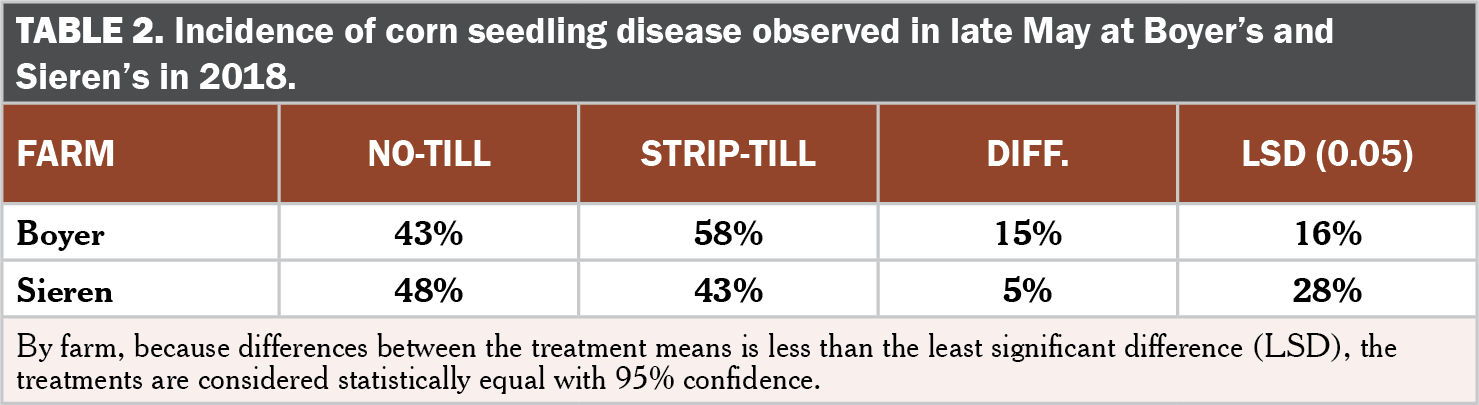
There was no difference in corn seedling disease incidence between tillage treatments at either farm (Table 2). Approximately half of all seedlings sampled at either farm showed signs of seedling disease (root rot) regardless of tillage. Planting corn into the strip-till zone was hypothesized to reduce the likelihood of seedling disease following a cereal rye cover crop that has been documented in lab and field studies in Iowa.[11] Strip-till did not reduce the amount of seedling disease observed in the present study.
 Solvita soil CO2-C burst
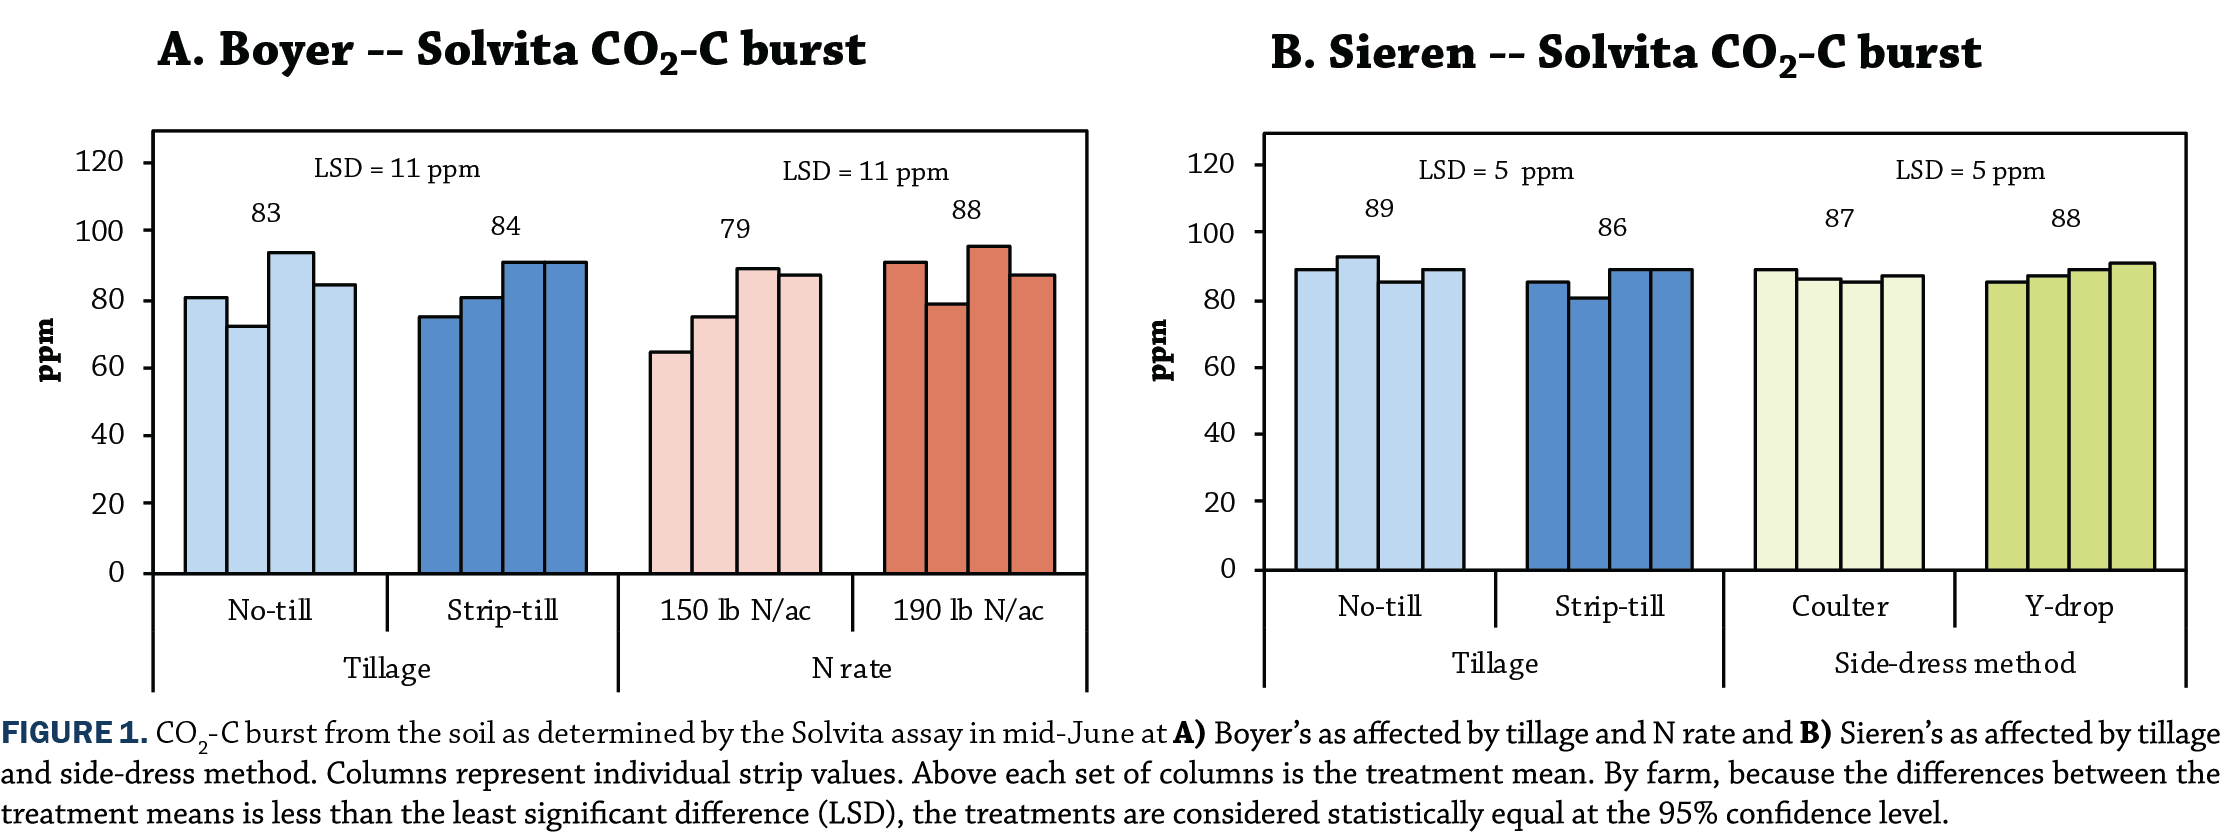
The Solvita assay determines soil microbial activity by measuring the amount of CO2-C respired over a 24-hour period from a dried soil sample that has been rewetted and held at an ideal temperature. Neither the tillage treatments at both farms nor the N rate at Boyer’s or side-dress method at Sieren’s had any effect on the CO2-C soil burst (Figure 1).
Solvita soil CO2-C burst
The Solvita assay determines soil microbial activity by measuring the amount of CO2-C respired over a 24-hour period from a dried soil sample that has been rewetted and held at an ideal temperature. Neither the tillage treatments at both farms nor the N rate at Boyer’s or side-dress method at Sieren’s had any effect on the CO2-C soil burst (Figure 1).
 Crop yields
Strip-till improved corn yields by 15 bu/ac at Sieren’s, but tillage did not affect corn yields at Boyer’s or soybean yields at Gustafson’s (Figure 2). Nitrogen fertilizer rate had no effect on corn yields at Boyer’s and side-dress method had no effect on corn yields at Sieren’s. The total amount of N fertilizer applied at Sieren’s differed between the strip-till and no-till main plot strips (157 and 146 lb N/ac, respectively). Corn stalk nitrate levels at Sieren’s did not differ among treatments and fell into the “low” (<250 ppm) according to ISU Extension and Outreach.[12] This suggests that the corn in both tillage treatments could have benefited from more N fertilizer than Sieren applied.
Crop yields
Strip-till improved corn yields by 15 bu/ac at Sieren’s, but tillage did not affect corn yields at Boyer’s or soybean yields at Gustafson’s (Figure 2). Nitrogen fertilizer rate had no effect on corn yields at Boyer’s and side-dress method had no effect on corn yields at Sieren’s. The total amount of N fertilizer applied at Sieren’s differed between the strip-till and no-till main plot strips (157 and 146 lb N/ac, respectively). Corn stalk nitrate levels at Sieren’s did not differ among treatments and fell into the “low” (<250 ppm) according to ISU Extension and Outreach.[12] This suggests that the corn in both tillage treatments could have benefited from more N fertilizer than Sieren applied.
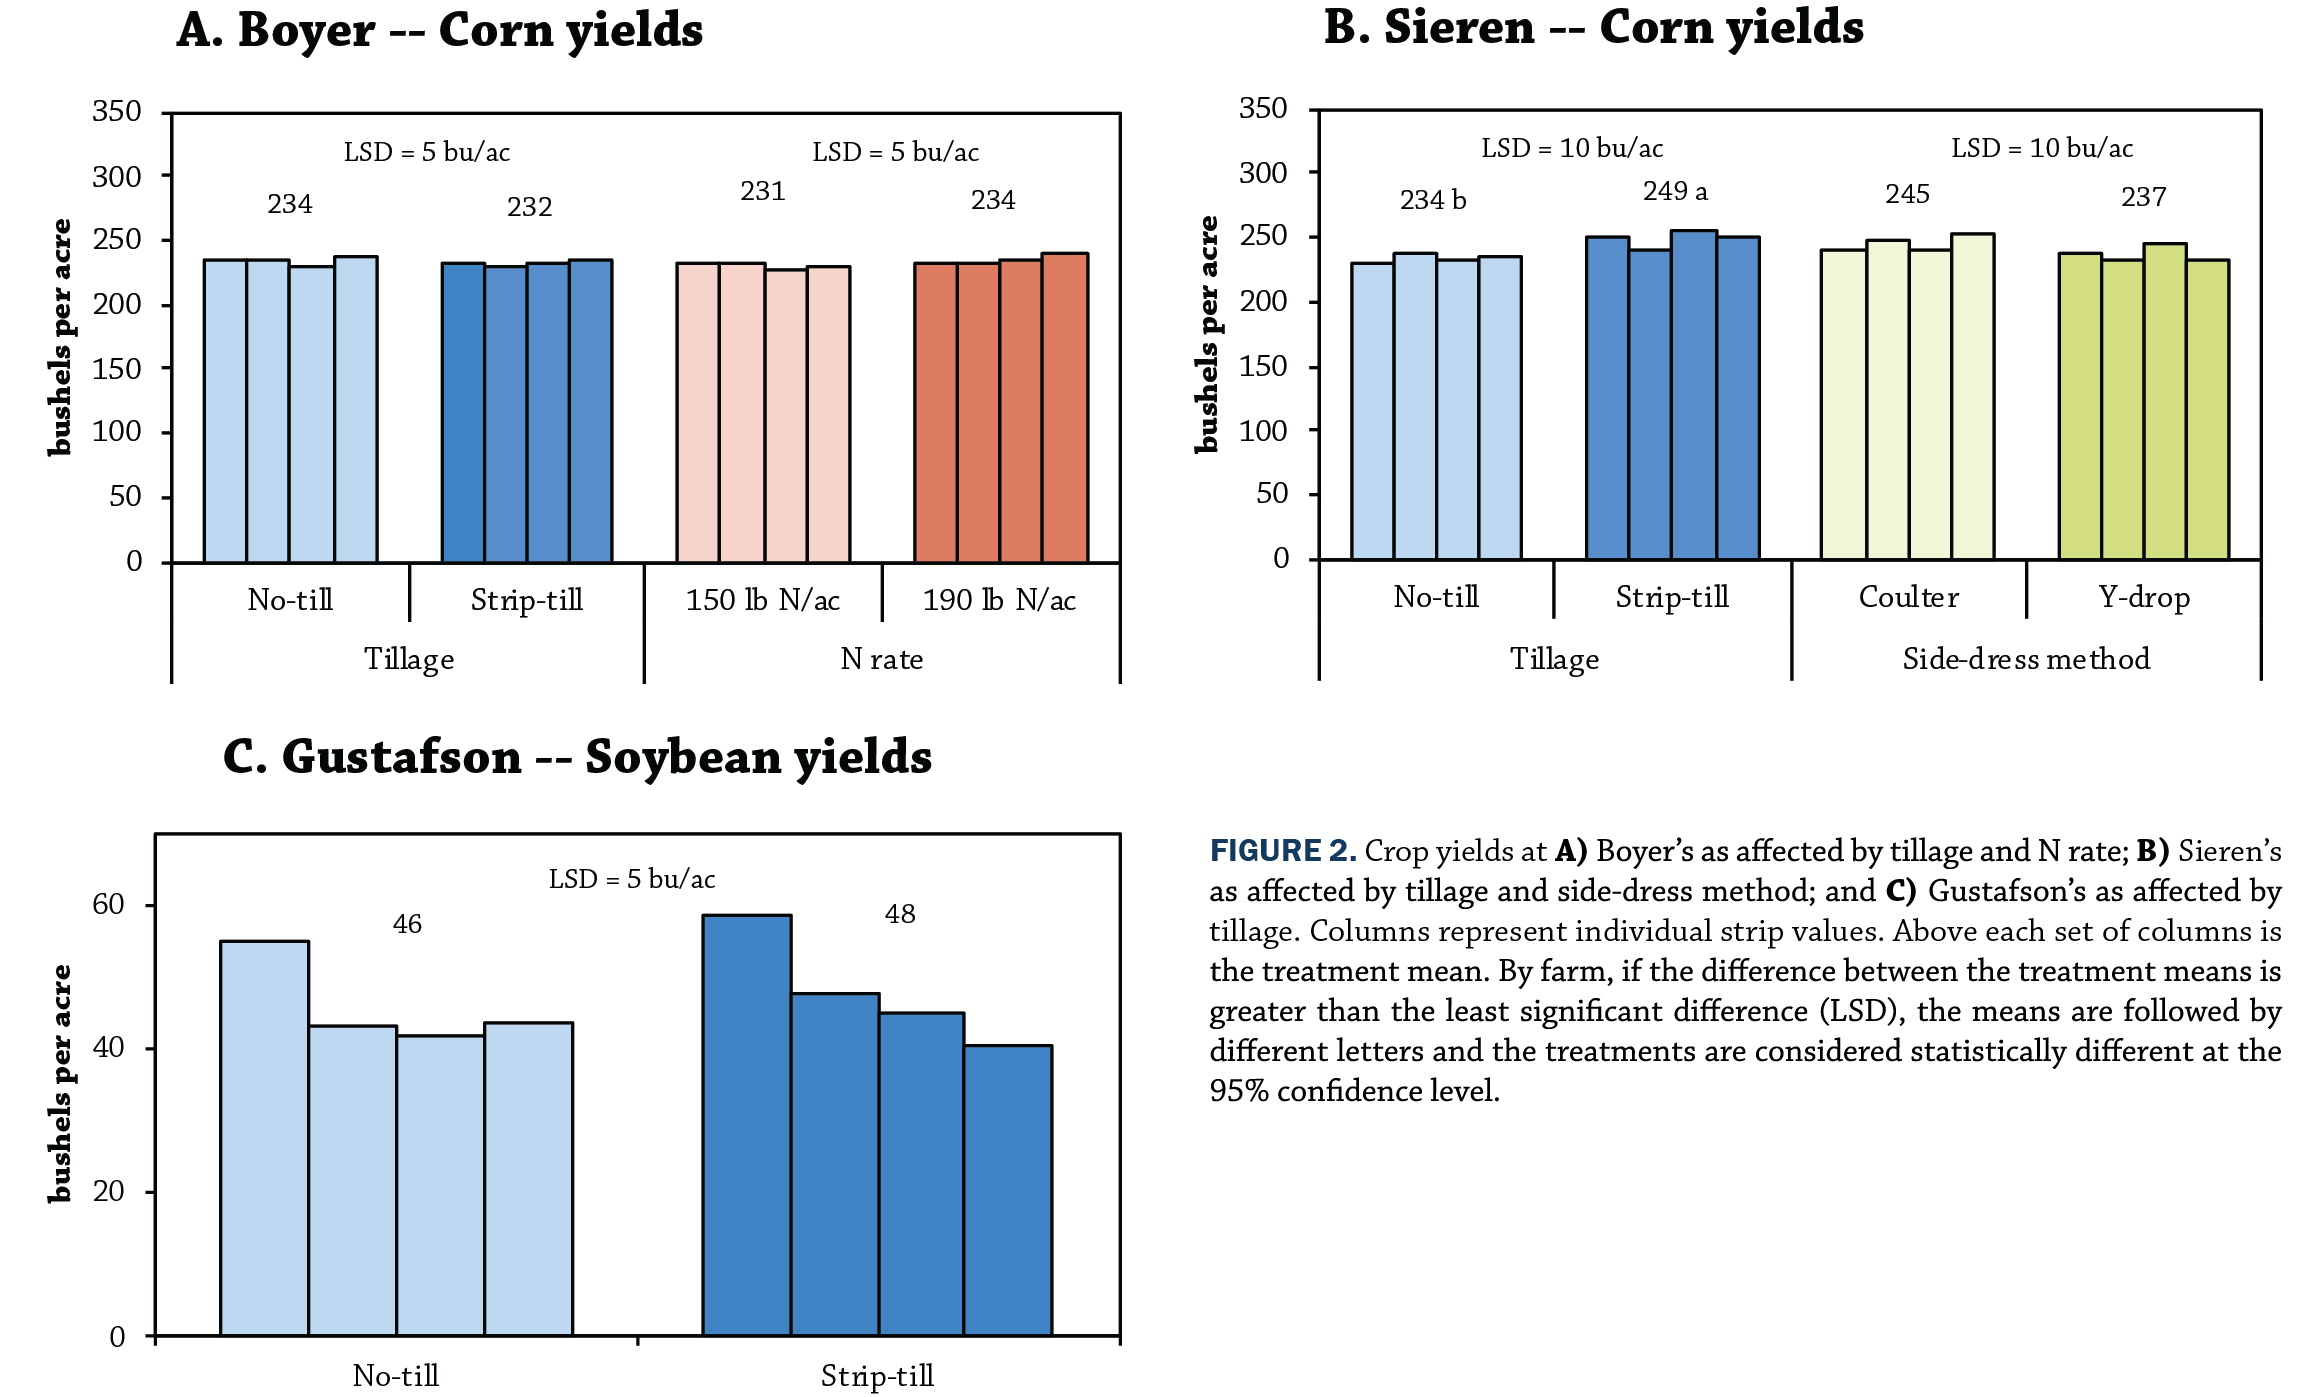 Corn yields at Boyer’s and Sieren’s far exceeded their respective five-year county averages of 192 bu/ac and 195 bu/ac.[13] Soybean yields at Gustafson’s fell below the five-year Boone County average of 52 bu/ac.[13] June through September was exceptionally wet at Gustafson’s (Figure A1) and he noted substantial ponding in the field which may have reduced yield potential.
Economic analysis
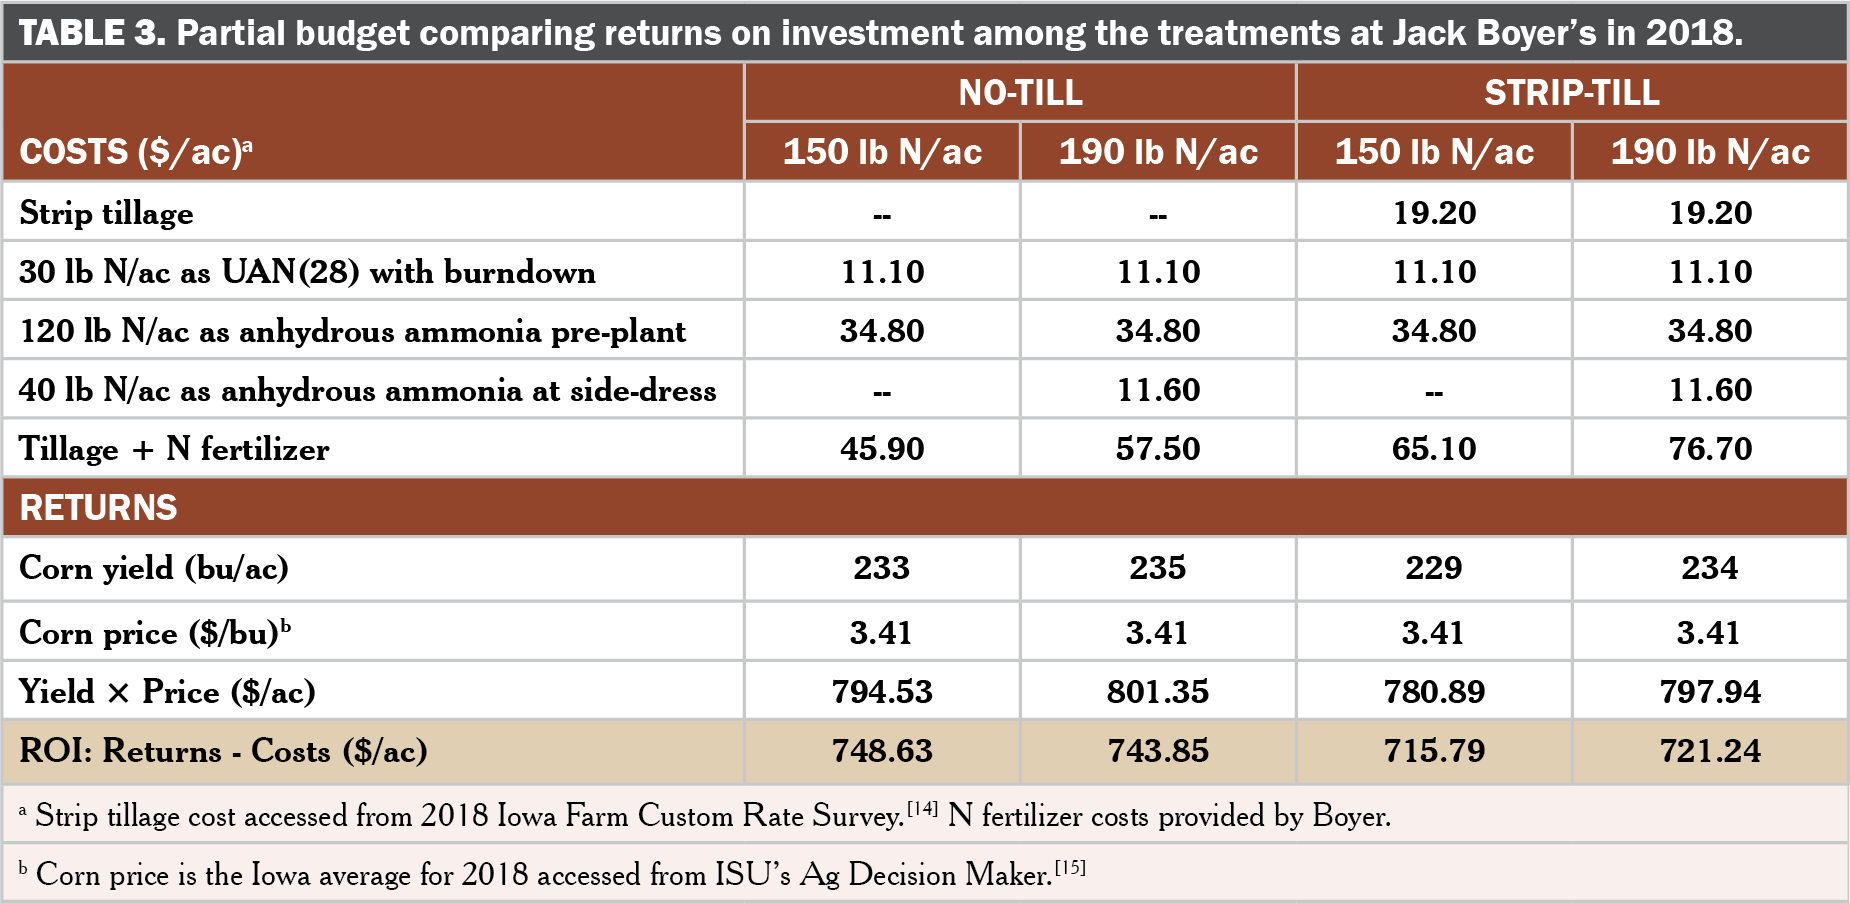
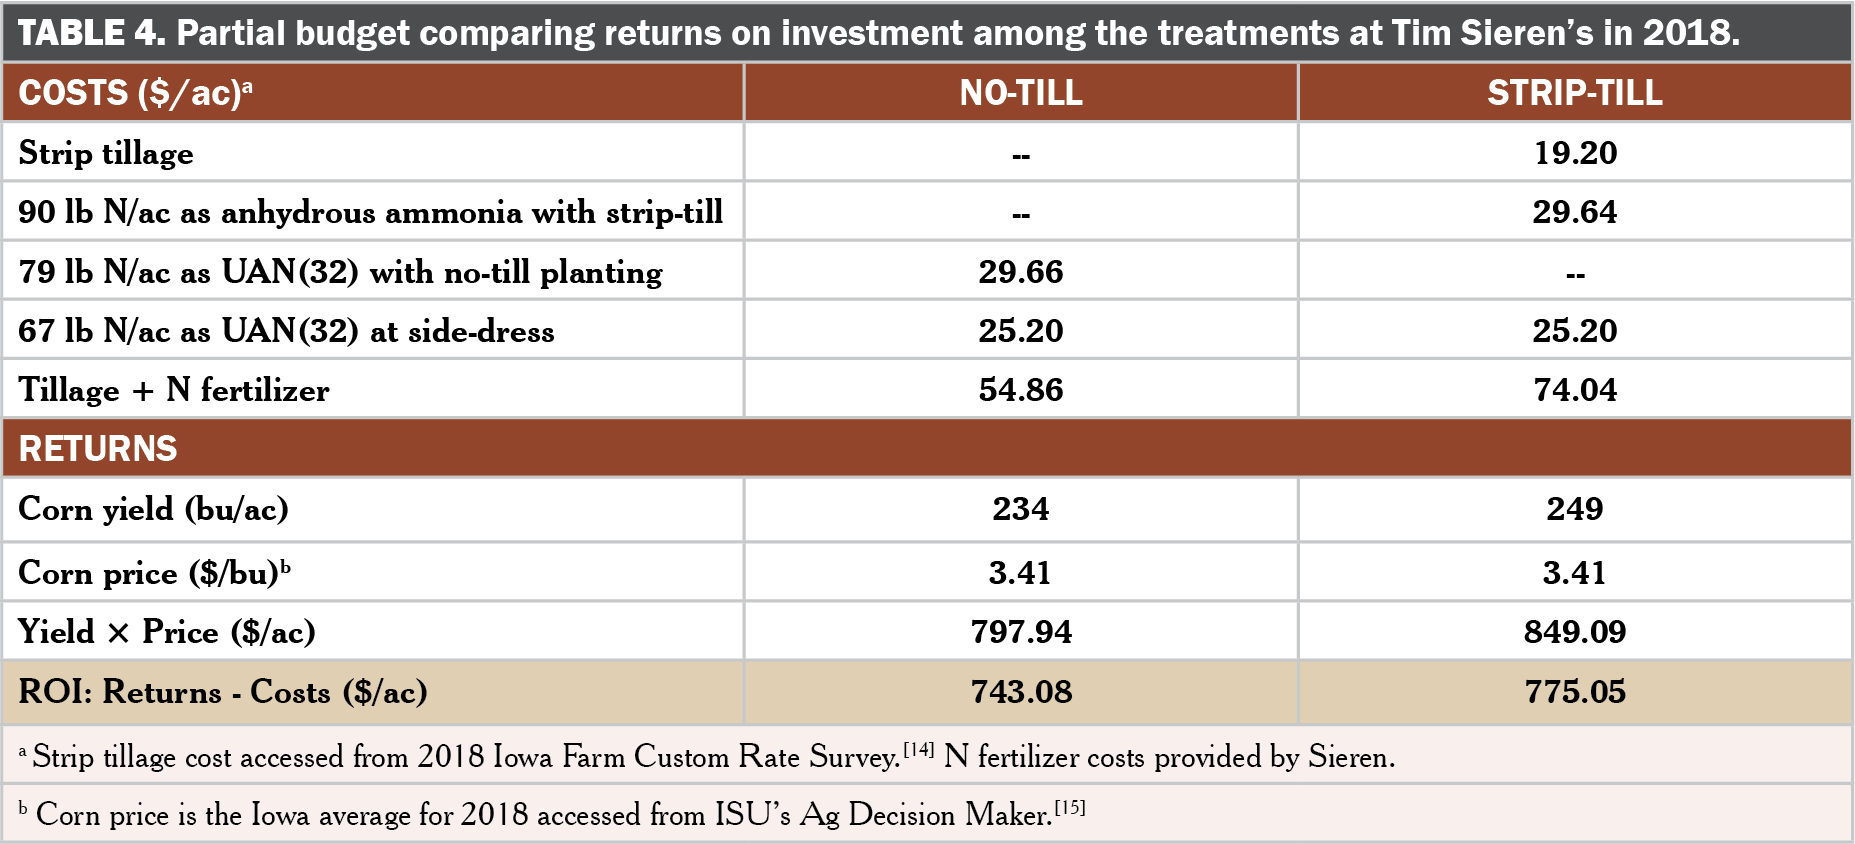
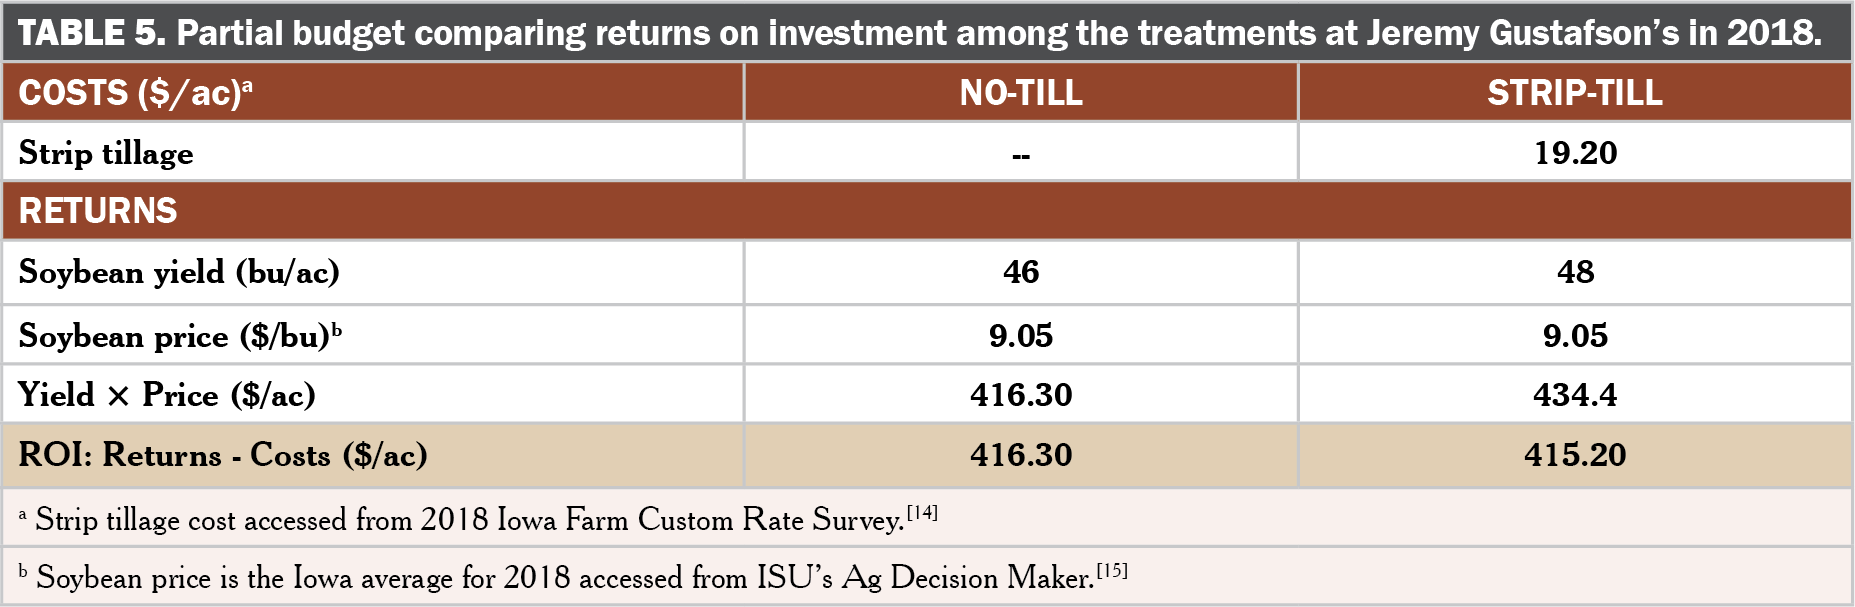
Tables 3–5 provide partial budget summaries of the costs, receipts and returns on investment for the treatments at the three farms. Costs associated with cover crop seeding, cover crop termination, crop planting, in-season weed control, fertilizer application and crop harvest were incurred among all treatments and are thus not considered when calculating the returns on investment. Rather, only the costs that differed among the treatments at each of the three farms are considered in the partial budget summary tables. Because tillage did not affect yields at Boyer’s or Gustafson’s (Figure 2), strip-till reduced returns compared to no-till at both farms (Tables 3 and 5). At Boyer’s, the high fertilizer rate (190 lb N/ac) also reduced returns as he saw no difference in corn yield between the two N fertilizer rates compared (Figure 2A). Greatest returns on investment at Boyer’s were achieved with no-till and 150 lb N/ac (Table 3). Unlike at Boyer’s and Gustafson’s, however, strip-till improved yields at Sieren’s (Figure 2B). The cost of strip tillage (and the additional 11 lb N/ac as anhydrous ammonia Sieren applied to that treatment) appears warranted at Sieren’s as he saw returns increased by more than $31/ac in the strip-till treatment (Table 4). Though he applied an additional 11 lb N/ac to the strip-till treatment, N fertilizer costs were nearly identical between the tillage treatments at Sieren’s. The corn yield improvement achieved with strip-till more than paid for the higher costs incurred in that treatment in Sieren’s case.
Corn yields at Boyer’s and Sieren’s far exceeded their respective five-year county averages of 192 bu/ac and 195 bu/ac.[13] Soybean yields at Gustafson’s fell below the five-year Boone County average of 52 bu/ac.[13] June through September was exceptionally wet at Gustafson’s (Figure A1) and he noted substantial ponding in the field which may have reduced yield potential.
Economic analysis
Tables 3–5 provide partial budget summaries of the costs, receipts and returns on investment for the treatments at the three farms. Costs associated with cover crop seeding, cover crop termination, crop planting, in-season weed control, fertilizer application and crop harvest were incurred among all treatments and are thus not considered when calculating the returns on investment. Rather, only the costs that differed among the treatments at each of the three farms are considered in the partial budget summary tables. Because tillage did not affect yields at Boyer’s or Gustafson’s (Figure 2), strip-till reduced returns compared to no-till at both farms (Tables 3 and 5). At Boyer’s, the high fertilizer rate (190 lb N/ac) also reduced returns as he saw no difference in corn yield between the two N fertilizer rates compared (Figure 2A). Greatest returns on investment at Boyer’s were achieved with no-till and 150 lb N/ac (Table 3). Unlike at Boyer’s and Gustafson’s, however, strip-till improved yields at Sieren’s (Figure 2B). The cost of strip tillage (and the additional 11 lb N/ac as anhydrous ammonia Sieren applied to that treatment) appears warranted at Sieren’s as he saw returns increased by more than $31/ac in the strip-till treatment (Table 4). Though he applied an additional 11 lb N/ac to the strip-till treatment, N fertilizer costs were nearly identical between the tillage treatments at Sieren’s. The corn yield improvement achieved with strip-till more than paid for the higher costs incurred in that treatment in Sieren’s case.
Conclusions and Next Steps
This study evaluated the effect of no-till and strip-till on corn and soybeans when following a cereal rye cover crop. The three farmers involved wanted to know if corn or soybean yields, and returns on investment, could be improved with strip tillage in a cover crop system. Strip-till both improved corn yields and returns at the Sieren farm only. Sieren suspected he was achieving better yields on his farm with strip tillage: “This trial confirmed the yield increases [I’ve been seeing on my farm] with my strip-till practices.” Corn yields at Boyer’s and soybean yields at Gustafson’s, however, were no different between the no-till and strip-till treatments. At those two farms strip-till reduced returns; no-till proved the better system. Moreover, Boyer saw similar corn yields between two N fertilizer rates (150 and 190 lb N/ac). He credits this trial with helping him realize the opportunity to reduce crop input costs: “I believe that I can reduce N application and no-till plant corn without reducing yield.” As a result of this project, Boyer and Gustafson plan to further expand their use of no-till when planting corn and soybeans, respectively, following a cover crop. Sieren, having achieved better yields and returns with strip-till, plans to try strip-till in more of his fields with cover crops to see if he can reap similar results as those he observed in 2018.
Appendix - Weather Conditions
References
- Gailans, S. and L. Juchems. 2018. Winter Cereal Rye Cover Crop Effect on Cash Crop Yield: Year 10. Practical Farmers of Iowa Cooperators’ Program and Iowa Learning Farms. https://practicalfarmers.org/wp-content/uploads/2019/01/18.FC_.CC.Winter_Rye_Effect_on_Yield_Year_10.pdf (accessed March 2019).
- Vaughan, J.D. and G.K. Evanylo. 1998. Corn response to cover crop species, spring desiccation time, and residue management. Agronomy Journal. 90:536–544. https://www.researchgate.net/profile/Gregory_Evanylo/publication/237976342_Corn_Response_to_Cover_Crop_Species_Spring_Desiccation_Time_and_Residue_Management/links/548b57550cf225bf669f884d/Corn-Response-to-Cover-Crop-Species-Spring-Desiccation-Time-and-Re (accessed March 2019).
- Hill, E.C., K.A. Renner and C.L. Sprague. 2016. Cover crop impact on nitrogen availability and dry bean in an organic system. Agronomy Journal. 108:329–341. https://dl.sciencesocieties.org/publications/aj/pdfs/108/1/329 (accessed March 2019).
- Gailans, S., B. Lynch, J. Gustafson and J. Boyer. 2015. Cereal Rye Cover Crop Termination Date Ahead of Soybeans. Practical Farmers of Iowa Cooperators’ Program. https://practicalfarmers.org/wp-content/uploads/2018/10/15.FC_.CC.Cereal_Rye_Cover_Crop_Termination_Date_Ahead_of_Soybeans-1.pdf (accessed March 2019).
- Gailans, S., J. Gustafson and J. Boyer. 2016. Cereal Rye Cover Crop Termination Date Ahead of Soybeans, 2016 Update. Practical Farmers of Iowa Cooperators’ Program. https://practicalfarmers.org/wp-content/uploads/2018/10/16.FC_.CC.Cereal_Rye_Cover_Crop_Termination_Ahead_of_Soybeans_Update_2016.pdf (accessed March 2019).
- Gailans, S. and D. Sloan. 2016. Cover Crop Termination Date Ahead of Corn. Practical Farmers of Iowa Cooperators’ Program. https://practicalfarmers.org/wp-content/uploads/2018/10/16.FC_.CC.Cover_Crop_Termination_Date_Corn.pdf (accessed March 2019).
- Gailans, S., D. Sloan and T. Sieren. 2017. N Fertilizer Strategies for Corn Following Cover Crop. Practical Farmers of Iowa Cooperators’ Program. https://practicalfarmers.org/wp-content/uploads/2018/10/17.FC_.CC.N-fert-strategies-for-corn-after-cover.compressed.pdf (accessed March 2019).
- Gailans, S., T. Smith, R. Stout and J. Gustafson. 2014. Side-dressing Corn following a Winter Rye Cover Crop -- Updated 2014. Practical Farmers of Iowa Cooperators’ Program. https://practicalfarmers.org/wp-content/uploads/2018/12/14.FC_.CC.side-dress-N_UPDATE.pdf (accessed March 2019).
- Pantoja, J.L., K.P. Woli, J.E. Sawyer and D.W. Barker. 2015. Corn Nitrogen Fertilization Requirement and Corn–Soybean Productivity with a Rye Cover Crop. Soil Science Society of America Journal. 79:1482. https://dl.sciencesocieties.org/publications/sssaj/pdfs/79/5/1482 (accessed March 2019).
- Raimbult, B.A., T.J. Vyn and M. Tollenaar. 1991. Corn Response to Rye Cover Crop, Tillage Methods, and Planter Options. Agronomy Journal. 83:287. https://dl.sciencesocieties.org/publications/aj/abstracts/83/2/AJ0830020287 (accessed March 2019).
- Acharya, J., M.G. Bakker, T.B. Moorman, T.C. Kaspar, A.W. Lenssen and A.E. Robertson. 2016. Time Interval Between Cover Crop Termination and Planting Influences Corn Seedling Disease, Plant Growth, and Yield. Plant Disease. 101:591–600. https://apsjournals.apsnet.org/doi/pdfplus/10.1094/PDIS-07-16-0975-RE (accessed March 2019).
- Sawyer, J. and A.P. Mallarino. 2018. Cornstalk Testing to Evaluate Nitrogen Management. PM 1584. Iowa State University Extension and Outreach. https://store.extension.iastate.edu/product/Use-of-the-End-of-Season-Corn-Stalk-Nitrate-Test-in-Iowa-Corn-Production (accessed March 2019).
- US Department of Agriculture-National Agricultural Statistics Service. Quick stats. USDA-National Agricultural Statistics Service. https://quickstats.nass.usda.gov/ (accessed March 2019).
- Plastina, A. and A. Johanns. 2019 Iowa Farm Custom Rate Survey. Ag Decision Maker File A3-10. Iowa State University Extension and Outreach. https://www.extension.iastate.edu/agdm/crops/pdf/a3-10.pdf (accessed March 2019).
- Johanns, A. 2019. Iowa Cash Corn and Soybean Prices. Ag Decision Maker File A2-11. Iowa State University Extension and Outreach. https://www.extension.iastate.edu/agdm/crops/pdf/a2-11.pdf (accessed March 2019).
- Iowa Environmental Mesonet. 2019. Climodat Reports. Iowa State University. http://mesonet.agron.iastate.edu/climodat/ (accessed March 2019).