Soil Health in Grazed Conservation Reserve Program (CRP) Land

Published Apr 29, 2021

This research was funded by The Cedar Tree Foundation.

In a Nutshell:

  • There are close to 1.7 million acres of CRP land in Iowa, much of which could be utilized as grazing land, but strict grazing restrictions apply. Research shows that properly managed grazing improves grasslands and contributes to soil health.
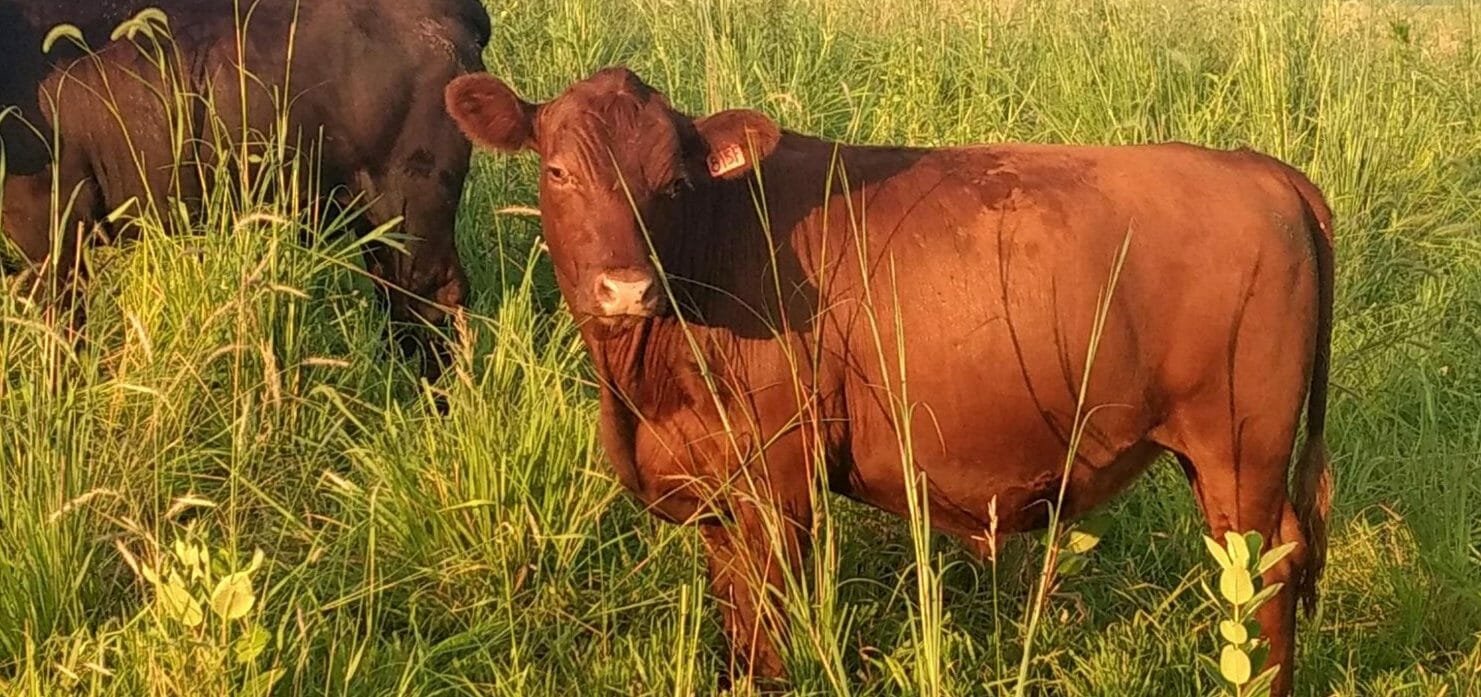
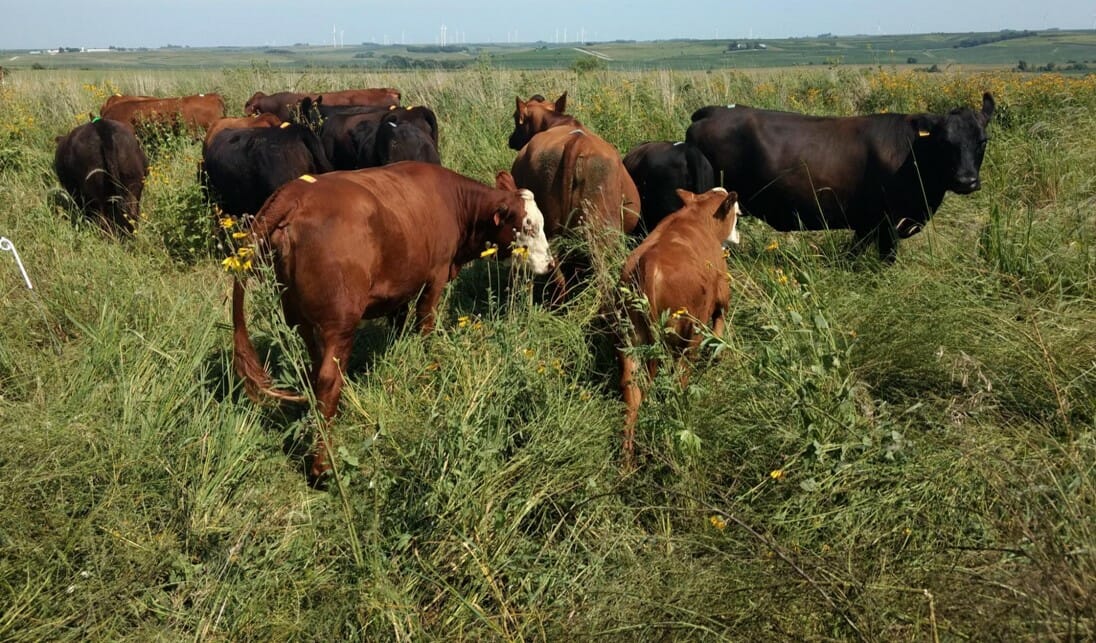
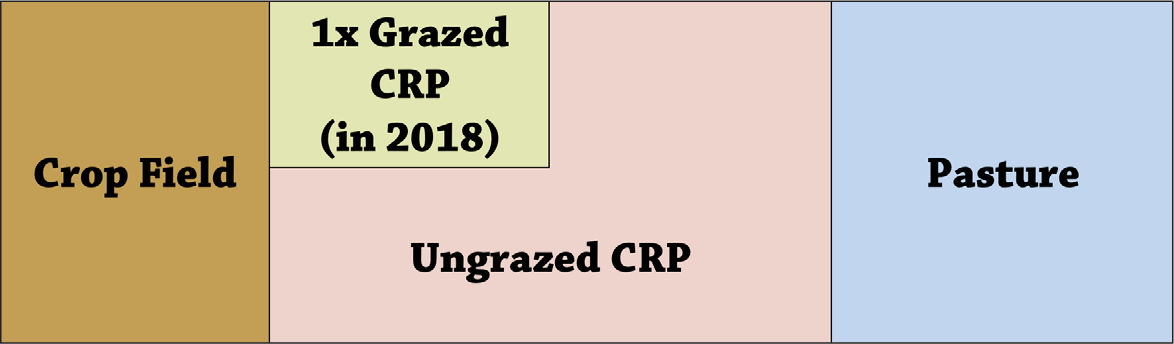
  • Dave and Meg Schmidt wondered if grazing their CRP land would increase soil health. They grazed a portion of their CRP with cattle for two weeks in Aug. 2018 and then monitored soil health metrics for three years. For comparison, they included three additional fields: grazed perennial pasture, ungrazed CRP land and a row-crop field.

Key Findings:

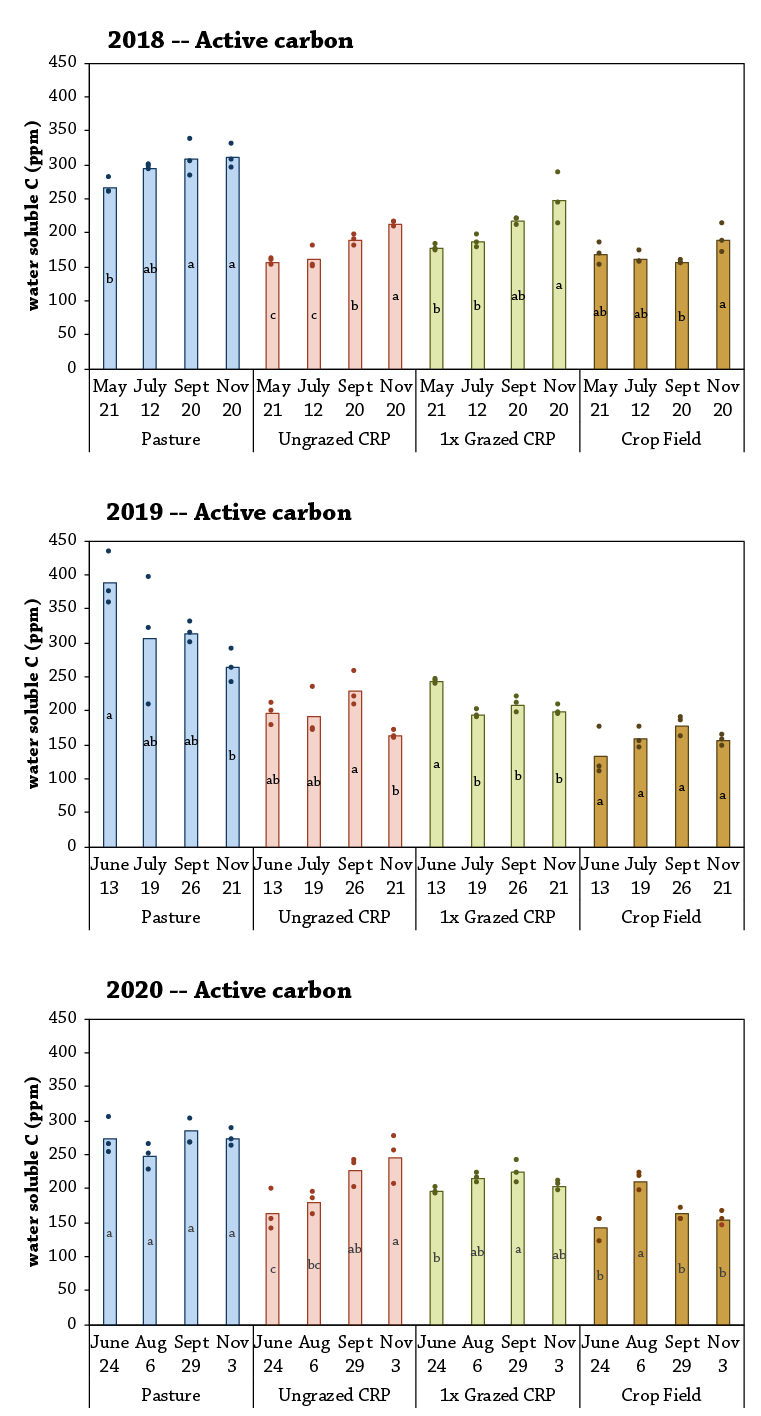
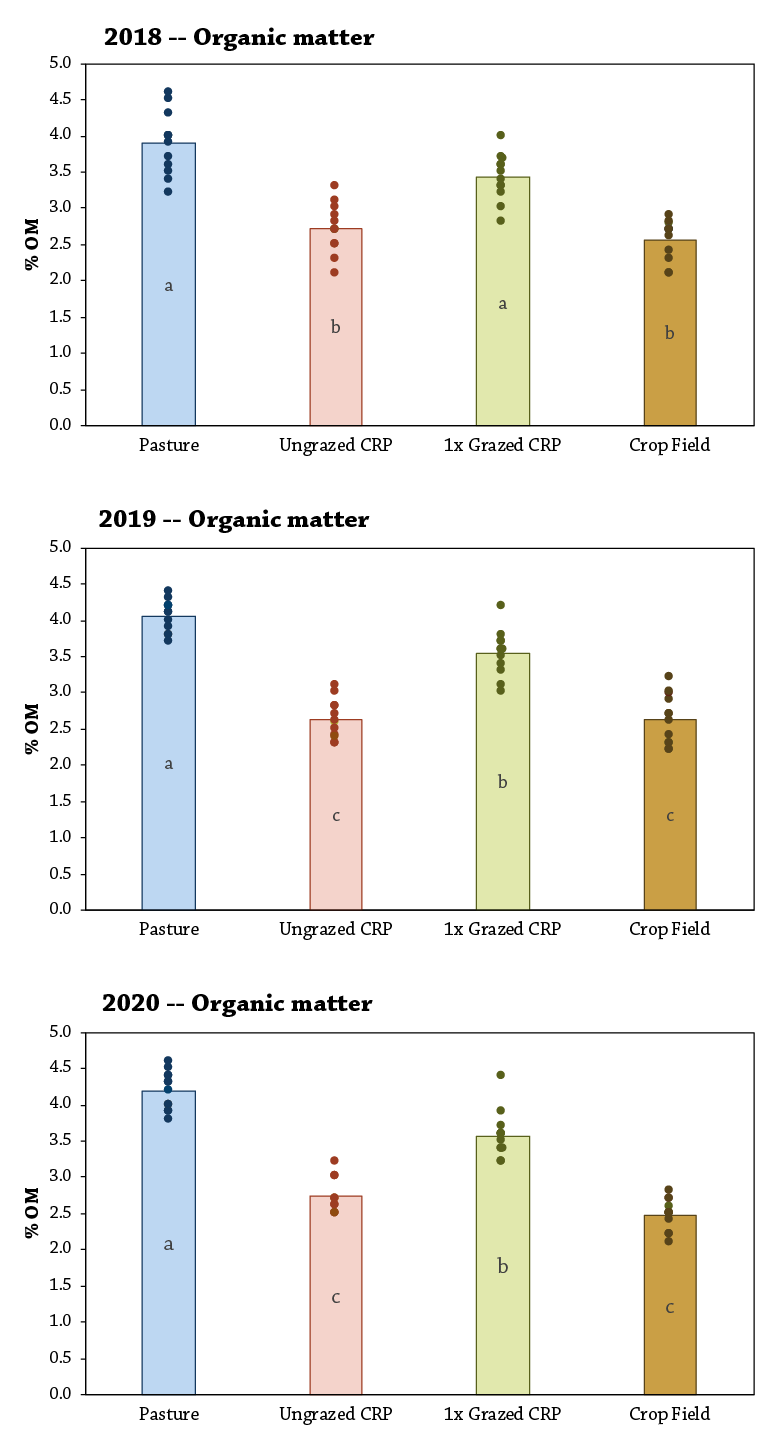
  • The grazed perennial pasture ranked highest for microbial respiration, active carbon and soil organic matter. The crop field ranked lowest. The grazed CRP ranked higher than the ungrazed CRP, but had more organic matter from the start of the trial.
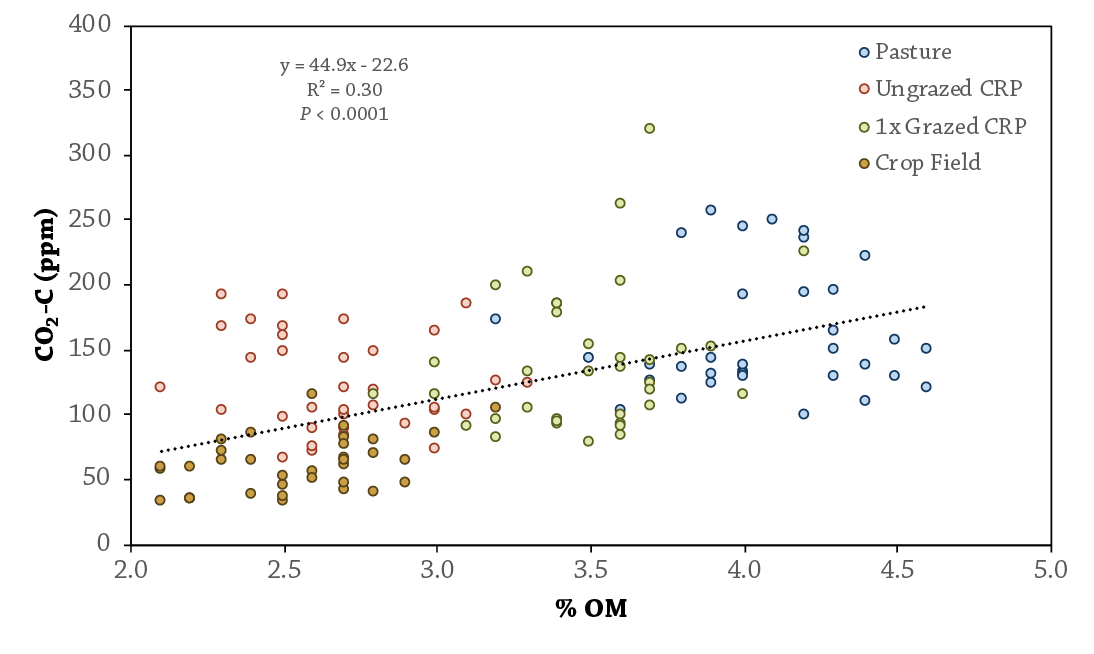
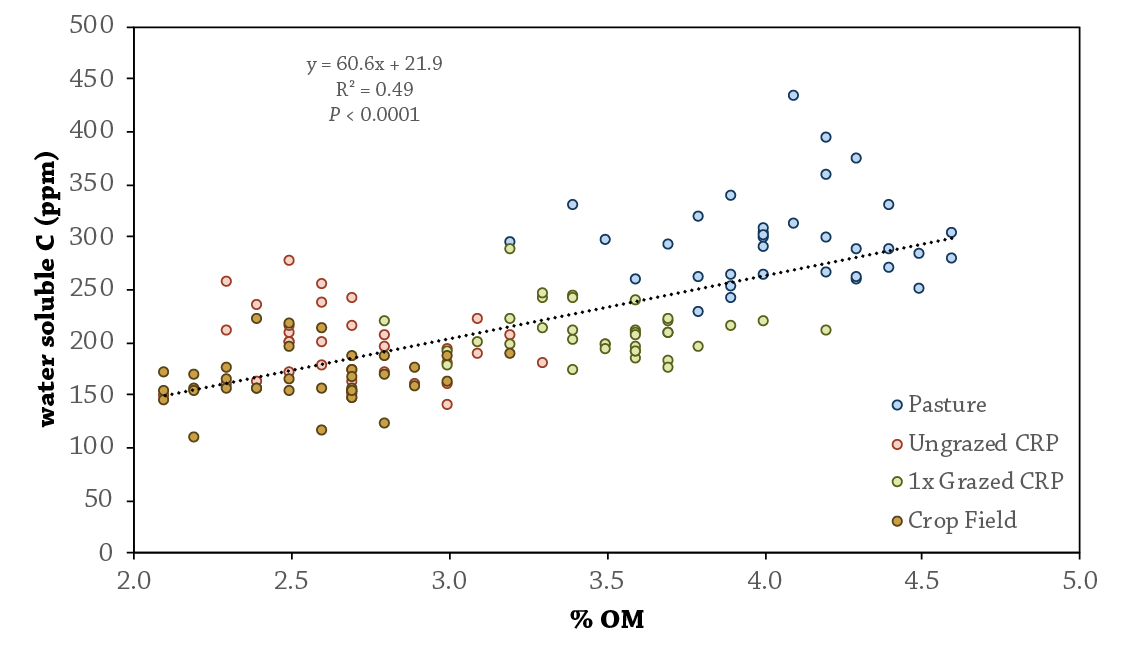
  • Our data shows that with more organic matter, both microbial respiration and active carbon increase.
  • The CRP grazing period, from August 2-16, 2018, may not have been long enough for animal impact to affect soil health indicators, but grazing did not have a detrimental effect on soil health in CRP land.

Background

The Conservation Reserve Program (CRP), administered by the Farm Service Agency (FSA), encourages farmers and landowners to convert highly erodible cropland or other environmentally sensitive acreage to vegetative cover, such as native grasses, in exchange for an annual payment.[1] The primary goals of the CRP program are to reduce soil erosion and provide habitat for grassland birds. 1,674,453 acres of Iowa land is enrolled in the CRP program.[2]

Picture4

Dave and Meg Schmidt, of Troublesome Creek Cattle Co., grazed a portion of their CRP with cattle for two weeks in Aug. 2018 and monitored soil health metrics for three years.

Much of the CRP land in Iowa could be utilized as grazing land, but restrictions apply to grazing these areas. To graze CRP, a farmer has to take a 25% reduction in their annual payment and only graze between April 1 to May 14 and August 2 to September 30, to ensure grazing does not interfere with the primary bird nesting season.[3]

Research shows that livestock integration and properly managed grazing contribute to soil health,[4] and Dave and Meg Schmidt wondered if grazing their CRP land once during one of the allowed periods would increase certain soil health factors, such as soil organic matter (SOM). After grazing a portion of their CRP in August 2018, Dave and Meg monitored soil health metrics for three years and included for comparison three adjacent fields under different management: grazed perennial pasture, ungrazed CRP land and a row-crop field.

Methods

Design

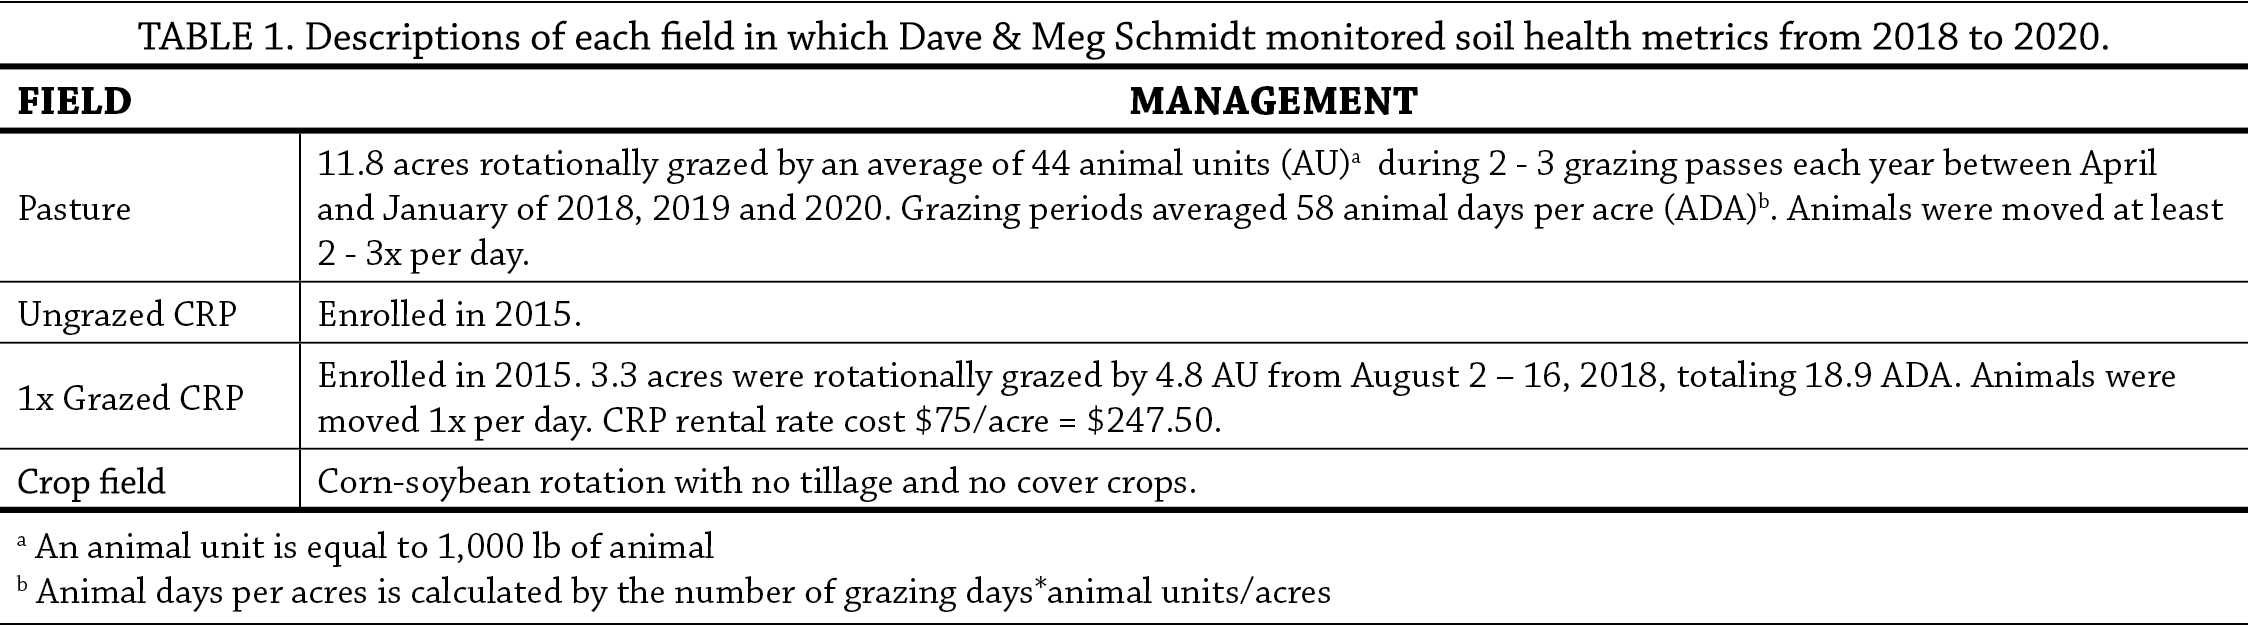
The Schmidts established four fields under different management from which they monitored soil health metrics (Table 1).

In the grazed CRP field, grazing took place once in August 2018. The field contained “plenty of low quality forage not suitable for finishing steers and lactating cows lost condition” according to Schmidt. “Ideally we’d be grazing this field in July for high quality feed, but that is restricted by NRCS.” Cattle grazing was controlled by temporary electric fencing and basic management-intensive grazing principles were followed including: allowing adequate rest for the vegetation after grazing, keep grazing periods shorter than the time required for grass to resume growth after being initially grazed, and taking less than 50% of the standing forage biomass. Grazing took place during the time frame allowed by the CRP contract.

Cattle turned into the CRP field on August 2, 2018

August 2, 2018 cattle were turned into the CRP field to graze.

Measurements

Soil samples were collected four times per year in 2018, 2019 and 2020 in four fields. Three samples were collected by AgSource Laboratories (Ellsworth, IA) from GPS established locations in each field on each sampling date. All fields and sampling sites were within 1.5 miles of each other. Soil class, soil description and landscape position of the sample locations is listed in Table 2.

Soil Health in Grazed Conservation Reserve Program table 2

Soil samples were analyzed for microbial respiration by determining the burst of CO2-C following rewetting of dried soil using an infrared gas analyzer. Other soil indicators measured included water soluble carbon (active C) and organic matter (OM).

Picture3

August 4, 2018 after two days of grazing the CRP field. “We like to see a lot of that standing forage get trampled, but we just couldn’t get the cattle packed in tight enough for long enough to knock the native grasses down while trying to balance the needs of our cows and calves,” explained Schmidt.

Data analysis

Data were analyzed using JMP Pro 15 (SAS Institute Inc., Cary, NC) statistical software. Means separations are reported using Tukey’s least significant difference (LSD). Statistical significance was determined at the 90% confidence level.

Results and Discussion
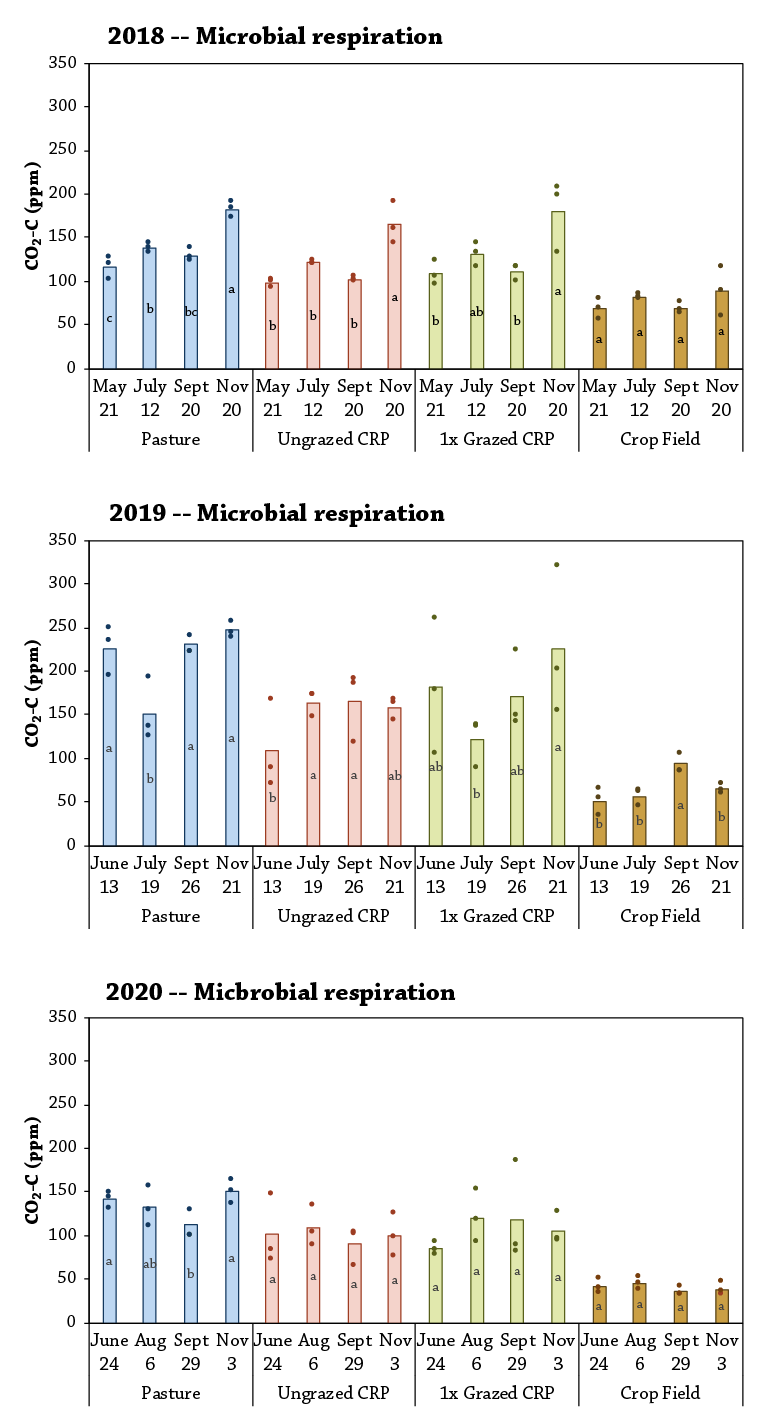
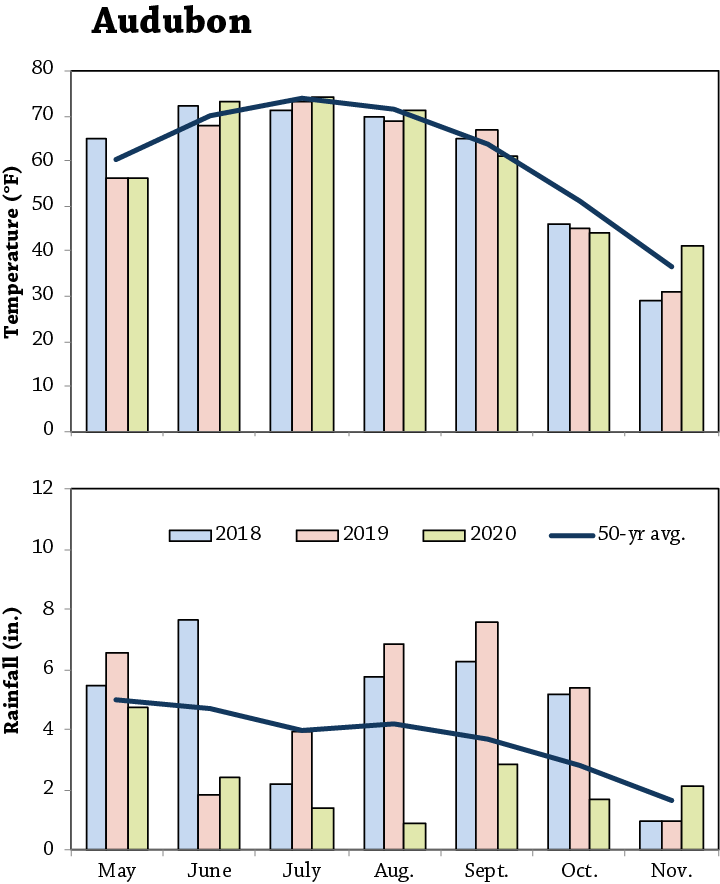
Microbial respiration

Figure 1 shows that microbial respiration in each field tended to fluctuate through the year; except in 2020, presumably due to severe drought (Figure A2) that likely limited microbial activity in all fields. In 2018, microbial respiration increased through the year for the three fields in perennial vegetation (pasture, ungrazed CRP, grazed CRP); in the row-crop field, respiration did not change through the year. In 2019, ungrazed pasture behaved similarly to 2018. The pasture and the CRP that was grazed in 2018, however, displayed a different pattern; namely, between the first (June) and second (July) sample dates. That the pasture and grazed CRP displayed similar patterns to one another could be a function of the similar soil types (Table 2). The row-crop field remained consistently low in microbial respiration all three years relative to the other fields in perennial vegetation. Overall, the fields in perennial vegetation had more fluctuation and higher rates of microbial activity than the row-crop field, presumably due to increased abundance and species diversity of microbes in perennial systems.

Soil Health in Grazed Conservation Reserve Program fig 1

FIGURE 1. Soil microbial respiration (CO2-C burst from soils) for each field at each sampling date in 2018, 2019 and 2020. Each column represents the mean and the points represent individual samples. Analysis was conducted separately for each field in each year. By field, results that differed by less than the least significant difference (LSD) are followed by the same letter-rankings and are considered statistically equal. Results followed by a different letter ranking are considered statistically different at the 90% confidence level.

Active carbon

Figure 2 shows active C in each field fluctuated through the year in most fields, but the nature of the fluctuations differed in each of the three years. In 2018, active C increased through the year in all three fields in perennial vegetation (similar to the pattern observed for microbial respiration in those fields in 2018). In 2019, the pasture and grazed CRP saw the greatest amount at the first sample date (June) with subsequent samplings measuring less active C. In 2020, the amount of active C remained more or less consistent in each field through the year, except the ungrazed CRP which saw an increase through the year. As with microbial respiration, the row-crop field tended to show little or no change in active C through the year in each of the three years.

Soil Health in Grazed Conservation Reserve Program fig 2

FIGURE 2. Active carbon (water soluble carbon) for each field at each sampling date in 2018, 2019 and 2020. Each column represents the mean and the points represent individual samples. Analysis was conducted separately for each field in each year. By field, results that differed by less than the least significant difference (LSD) are followed by the same letter-rankings and are considered statistically equal. Results followed by a different letter ranking are considered statistically different at the 90% confidence level.

Organic matter

Figure 3 shows OM in each field remained constant over three years and the fields ranked similarly with one another throughout the three years. The pasture consistently measured the highest OM. The ungrazed CRP and crop field are statistically equal throughout the three years, and consistently have the least OM. The grazed CRP started and ended with more OM than the ungrazed CRP, therefore increased OM cannot be attributed to any potential effect from grazing in 2018. Differences in OM are likely due to inherent soil properties that reflect long-term management, soil texture, landscape position or a combination of all three.

Soil Health in Grazed Conservation Reserve Program fig 3

FIGURE 3. Soil organic matter (OM) for each field in 2018, 2019 and 2020. Each column represents the mean and the points represent individual samples. Analysis was conducted with sampling dates for each field combined within the same year. By year, results that differed by less than the least significant difference (LSD) are followed by the same letter-rankings and are considered statistically equal. Results followed by a different letter ranking are considered statistically different at the 90% confidence level.

Figures 4 and 5 show that with more OM, both microbial respiration and active C increase. This suggests that farmers who wish to improve soil health metrics in their fields should probably embrace practices that promote increasing OM. Admittedly, this can be a long-term process. Some fields are inherently high in OM while others stand a lot more to gain and this is often a function of soil texture, long-term management and climate conditions.

Soil Health in Grazed Conservation Reserve Program fig 4

FIGURE 4. Relationship between soil organic matter (OM) and microbial respiration (CO2-C burst) across all samples from each field in 2018, 2019 and 2020.

Soil Health in Grazed Conservation Reserve Program fig 5

FIGURE 5. Relationship between soil organic matter (OM) and active carbon (water soluble C) across all samples from each field in 2018, 2019 and 2020.

Conclusion and Next Steps

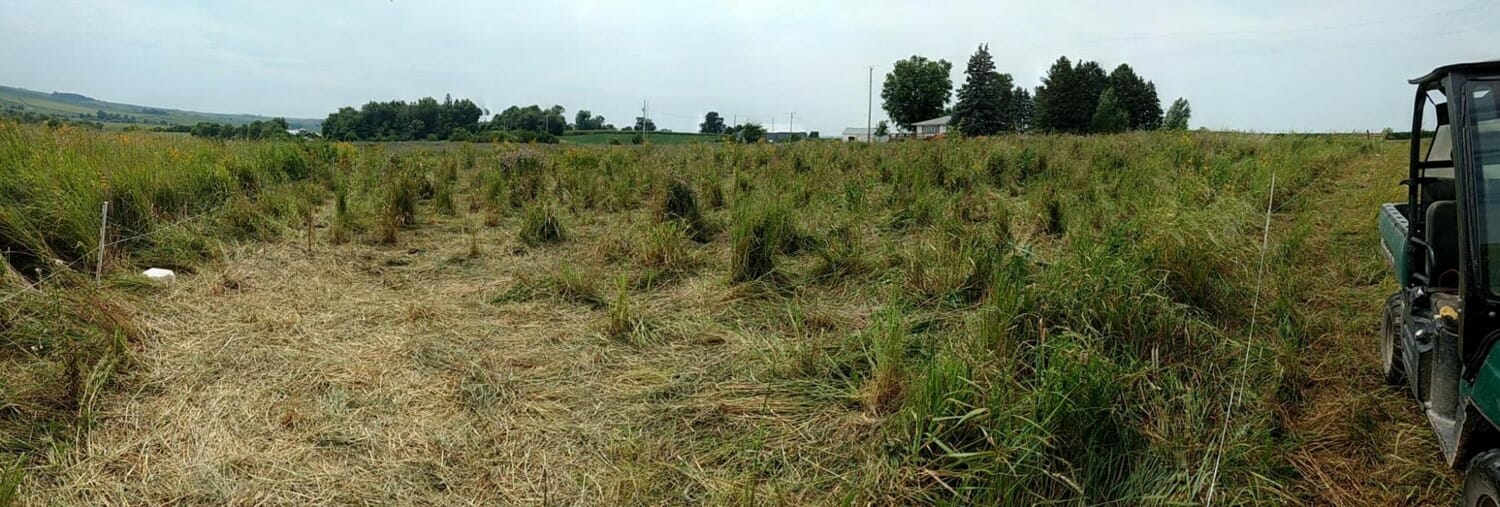
Although the results do not indicate that grazing a section of a CRP field made a significant difference in soil health over three years, Dave Schmidt believes soil health will improve over the long term. “The key is to really hammer it like the buffalo did and then leave it for a year, but that’s just about impossible in terms of [CRP] management. The cattle had to be kept at a lot lower density since the vegetation was tough and woody in August,” explained Schmidt. Importantly, this research showed that grazing did not have a detrimental effect on the CRP field.

In drought years, such as 2020, the FSA allows emergency grazing of CRP acres with no payment reduction.[6] Schmidt thinks, “CRP is very valuable during a drought, but marginal when it’s not rent-free. Even if we were allowed to graze out of season I think the animal days per acres would be a lot lower than in cool-season perennials, although average daily gains are probably similar around late June to mid-July.”

In conclusion, the CRP grazing period (2 weeks in August 2018) may not have been long enough for animal impact to make a difference in soil health indicators. When comparing all four fields, it is evident perennial vegetation supports increases to soil microbial activity and soil health compared to the row-crop field containing annual vegetation (corn, soybeans). In theory, managed grazing of CRP land on a consistent basis could potentially improve the health of CRP soils.

Appendix – Trial Design and Weather Conditions

Soil Health in Grazed Conservation Reserve Program fig a1

FIGURE A1. The Schmidts’ design consisted of four fields that each contained three GPS locations from where soils were sampled four times each year from 2018-2020.

Soil Health in Grazed Conservation Reserve Program fig a2

FIGURE A2. Mean monthly rainfall and temperature for May 1 through Nov. 30 in 2018, 2019, 2020 and the long-term average at the nearby Audubon weather station. [5]

References

  1. Conservation Reserve Program | NRCS. https://www.nrcs.usda.gov/wps/portal/nrcs/detail/national/programs/?cid=stelprdb1041269 (accessed February 2021).
  2. USDA. 2021. Conservation Reserve Program – Summary January 2021. https://www.fsa.usda.gov/Assets/USDA-FSA-Public/usdafiles/Conservation/PDF/SummaryJanuary2021Updated-1.pdf (accessed March 2021).
  3. Conservation Reserve Program (CRP) | NRCS Iowa. https://www.nrcs.usda.gov/wps/portal/nrcs/ia/programs/nrcs142p2_007948/ (accessed February 2021).
  4. Teague, R. and U. Kreuter. 2020. Managing Grazing to Restore Soil Health, Ecosystem Function, and Ecosystem Services. Frontiers in Sustainable Food Systems. 4:1–13 (accessed March 2021).
  5. Iowa Environmental Mesonet. 2021. Climodat Reports. Iowa State University. https://mesonet.agron.iastate.edu/climodat (accessed March 2021).
  6. USDA. 2020. Disaster Assistance Emergency Haying and Grazing. Farm Service Agency. https://www.fsa.usda.gov/Assets/USDA-FSA-Public/usdafiles/FactSheets/crp_haying_grazing_factsheet.pdf (accessed March 2021).