

This research was funded by USDA-NRCS and FFAR.
In a Nutshell:
- Nineteen farmers performed 22 replicated strip trials testing their typical nitrogen (N) rate against that rate reduced by an amount of their choosing.
- Four of the 19 farmers also compared their typical and reduced N rate application against a control with no N applied.
- Farmers chose to test N reductions ranging from 15-69 lb N/ac (reducing 8-45% of typical rate).
- Most farms have routinely used cover crops in the past five years (15), while some used a diversified crop rotation (2), applied manure (3), or incorporated grazing (3). Farms were predominantly in no-till with some occasionally including strip-till.
Key Findings
- All sites experienced a warm start and wetter-than-average growing season.
- Seven of the 22 trials potentially saved money when reducing their N rates.
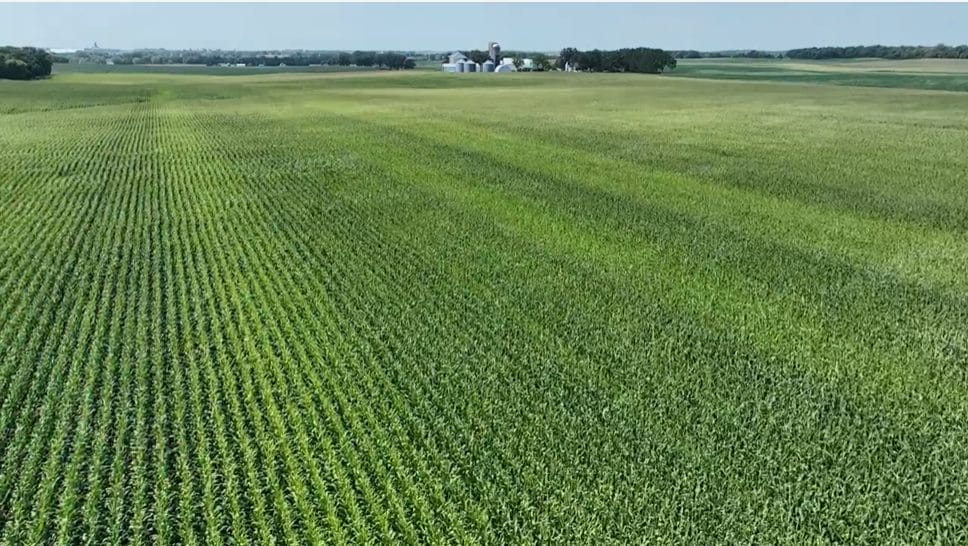
N-rate strips in Tom Polacek’s field highlighting visual differences between nitrogen treatments. Photo taken September 2024.
Background
The newest round of nitrogen fertilizer rate trials continues to investigate the same key questions explored in the 2022 and 2023 trials—whether farmers can reduce nitrogen rates while maintaining yields and profitability [1], [2]. The present trials began in 2023 in preparation for the 2024 growing season. This year included farmers located in Iowa, Minnesota, and Illinois, and once again included farmers who self-identified as using soil-health promoting practices for at least five years. Using a replicated strip-trial design, farmers compared yields, finances and greenhouse gas emissions at their typical N rate with those observed at a reduced rate. Farmers chose their own reduction rates. One goal of the trial was to push farmers to explore N rates outside of their comfort zone.
For the first time, the 2024 trials also included strips with no applied nitrogen (0N) to serve as a true control. Having a zero-nitrogen benchmark allows for a clearer understanding of how much yield is being driven by soil nitrogen alone versus applied fertilizer. This addition strengthens the experiment by helping farmers interpret the impact of different N rates [3].
If farmers can maintain corn yields and/or save money at the reduced N rate, results might spark confidence to reduce (or at least question) fertilizer rates going forward. If the reduced N rate lowers corn yields and loses money, farmers will still have gained valuable information: they can be more confident that their typical rate is the right rate for their farm, but maybe new long-term practices could help reduce it in the future. “Nitrogen is a moving target. It is always good to test and adjust,” said Alec Amundson at the onset of the trial.
Methods
Design
Cooperating farms in 2024 were located across Iowa (15), Minnesota (3), and Illinois (1). All treatments were applied at least four times, resulting in a total of at least eight strips in each farmer’s trial (Figures 1 and 2).
Fifteen farmers used two treatments:
- Typical – Their typical N fertilizer rate applied to a corn crop.
- Reduced – An N fertilizer rate less than the typical rate.
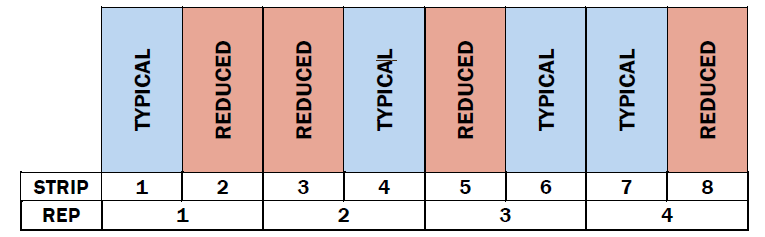
Figure 1. An example of a farmer’s treatment layout testing two nitrogen (N) fertilizer treatments for this trial. In 2024 strips were averaged 32 feet wide and 2,558 feet long, resulting in an average strip size of 1.9 acres.
Four farmers used three treatments:
- Typical – Their typical N fertilizer rate applied to a corn crop.
- Reduced – An N fertilizer rate less than the typical rate.
- 0N – No applied N fertilizer or manure.
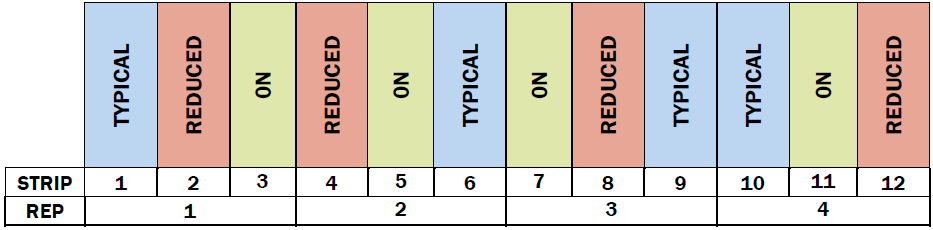
Figure 2 An example of a farmer’s field layout testing three treatments, including a control strip with zero N applied.
Measurements
Farmers recorded the timing, type (chemical, organic), amount of N applied, and price per unit of N for each treatment. Corn yields were measured and reported by each farmer, along with the percent moisture of the harvested grain. All yields were converted to 15.5% moisture for this report. Additionally, most farmers reported approximate prices received per bushel of corn.
Data analysis
Note that more details on data analysis can be found in the Appendix U. Detailed Methods section at the end of this report.
Weather
To provide context for the results, weather data was downloaded from the National Aeronautics and Space Administration (NASA) Prediction of Worldwide Energy Resources (POWER) project (https://power.larc.nasa.gov/) for each farmer’s trial.
Yields
For both the two-treatment and three-treatment (including 0N) designs, yield differences at each trial were assessed for statistical significance using a statistical model. The model tested for the effect of the N treatment, while accounting for possible natural yield gradients in the field and, in some cases, missing data. Significance was assigned using 95% confidence level threshold, meaning we are 95% sure the differences observed were ‘real’.
Finances
Nitrogen prices depend on several factors including the form of N, the timing of the purchase and the location of the purchase. Similarly, the price received for corn fluctuates throughout the year. Due to this variation, as well as the limited control farmers have over the price paid for N and the price received for corn, we used three price scenarios to compare financial outcomes of the typical and reduced N treatments: best-case savings, midpoint savings, and worst-case savings (Table 1). Using the data provided by the farmers, we took the lowest and highest farmer reported prices for the N source they adjusted to create their two rate treatments, and the lowest and highest reported prices received for corn – these values were used to construct the price scenarios.
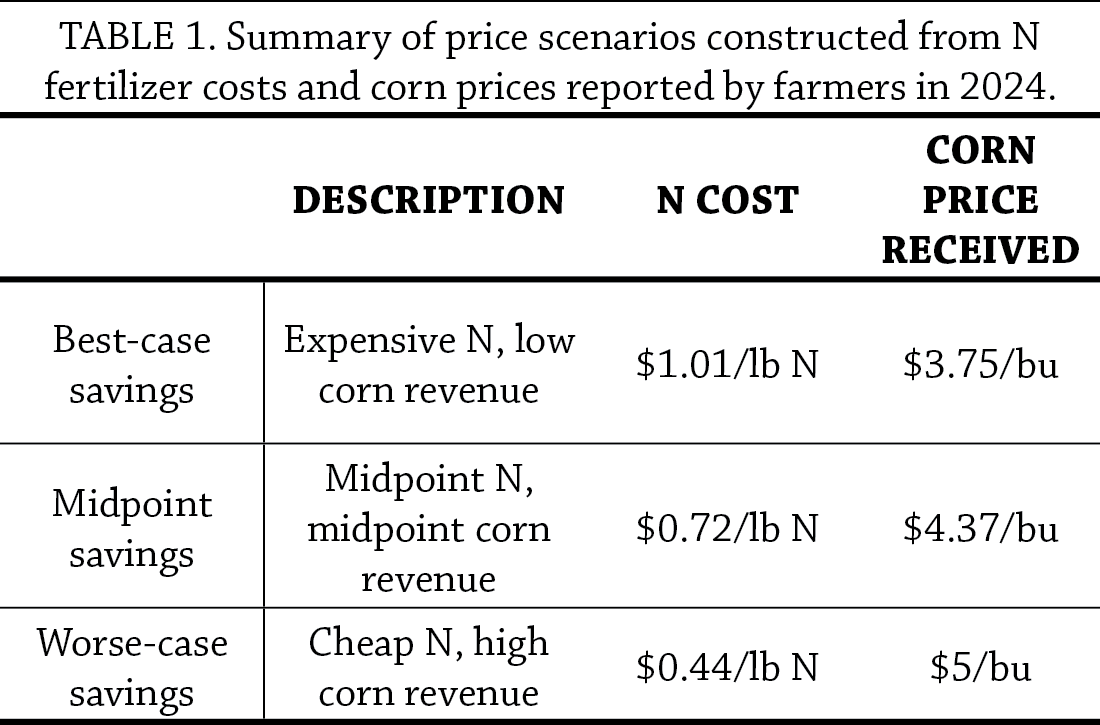
A partial budget using a given price scenario was performed for each treatment. Costs were estimated as the amount of N applied in that treatment multiplied by the assumed N cost, which depended on the scenario (Table 1). If the yields of each treatment were statistically different, each treatment’s yields were used for corn revenue calculations. If there was no statistical difference in treatment yields, the overall mean yield for the trial was used for corn revenue calculations. Partial net revenue for each treatment was calculated by subtracting the costs (N applied multiplied by N cost) from the revenue (yield multiplied by corn price). The difference between partial net revenues for the ‘reduced’, ‘typical’ and ‘zero’ treatments were calculated and reported. A positive value therefore represents financial savings at the reduced N rate. This process was done separately for the three price scenarios.
Greenhouse gas emissions
When a farmer reduces the amount of chemical N fertilizer applied to a field, two sources of greenhouse gas (GHG) emissions associated with crop production are avoided: the GHGs (expressed as carbon dioxide equivalents, CO2e released during fertilizer manufacturing processes, and the nitrous oxide (N2O) released from the soil due to biological processes driven by N application. To convert N2O to CO2e, a 100-year time horizon was assumed based on intergovernmental Panel on Climate Change (IPCC) recommendations [4]. Over the period of 100-years, one pound of N2O will have a forcing potential equal to 298 pounds of CO2e [4].
The CO2 released during fertilizer manufacturing was estimated using two values: (1) energy used to manufacture nitrogen fertilizers as reported from the 2022 GREET® (Greenhouse gases, Regulated Emissions, and Energy use in Technologies) model, developed by the Department of Energy’s Argonne National Laboratory (58 MJ/kg N) [5], and (2) the amount of CO2e released per MJ of energy used as reported by the Environmental Protection Agency [6]. The avoided N2O as a result of decreased N application was estimated using the IPCC methodologies for both direct and indirect agricultural N2O emissions [7]. All above calculations can be simplified to a constant conversion factor: the pounds of N reduced per acre from the typical rate can be multiplied by 7.82 to get pounds of CO2e avoided per acre.
The acres needed to reduce a given amount of N application to equate to the emissions generated by a single United States (US) vehicle were calculated using the EPA’s estimates for vehicle emissions [8]. The EPA uses statistics to represent an average US gasoline vehicle (22 miles per gallon, driven 11,500 miles per year), and estimates the emissions from one vehicle using those values (estimated to be 10,141 lb CO2e/year) [8].
Results and Discussion
Treatments
Nineteen farmers conducted a total of 22 independent N trials. The chosen treatments reflected the diversity in farming systems, with typical N rates ranging from 127-220 lb N/ac and reduced N rates ranging from 83-180 lb N/ac (Figure 3). When averaged over all trials, typical and reduced N rate treatments were 163 lb N/ac and 122 lb of N/ac, respectively, for an average reduction of 41 lb N/ac.
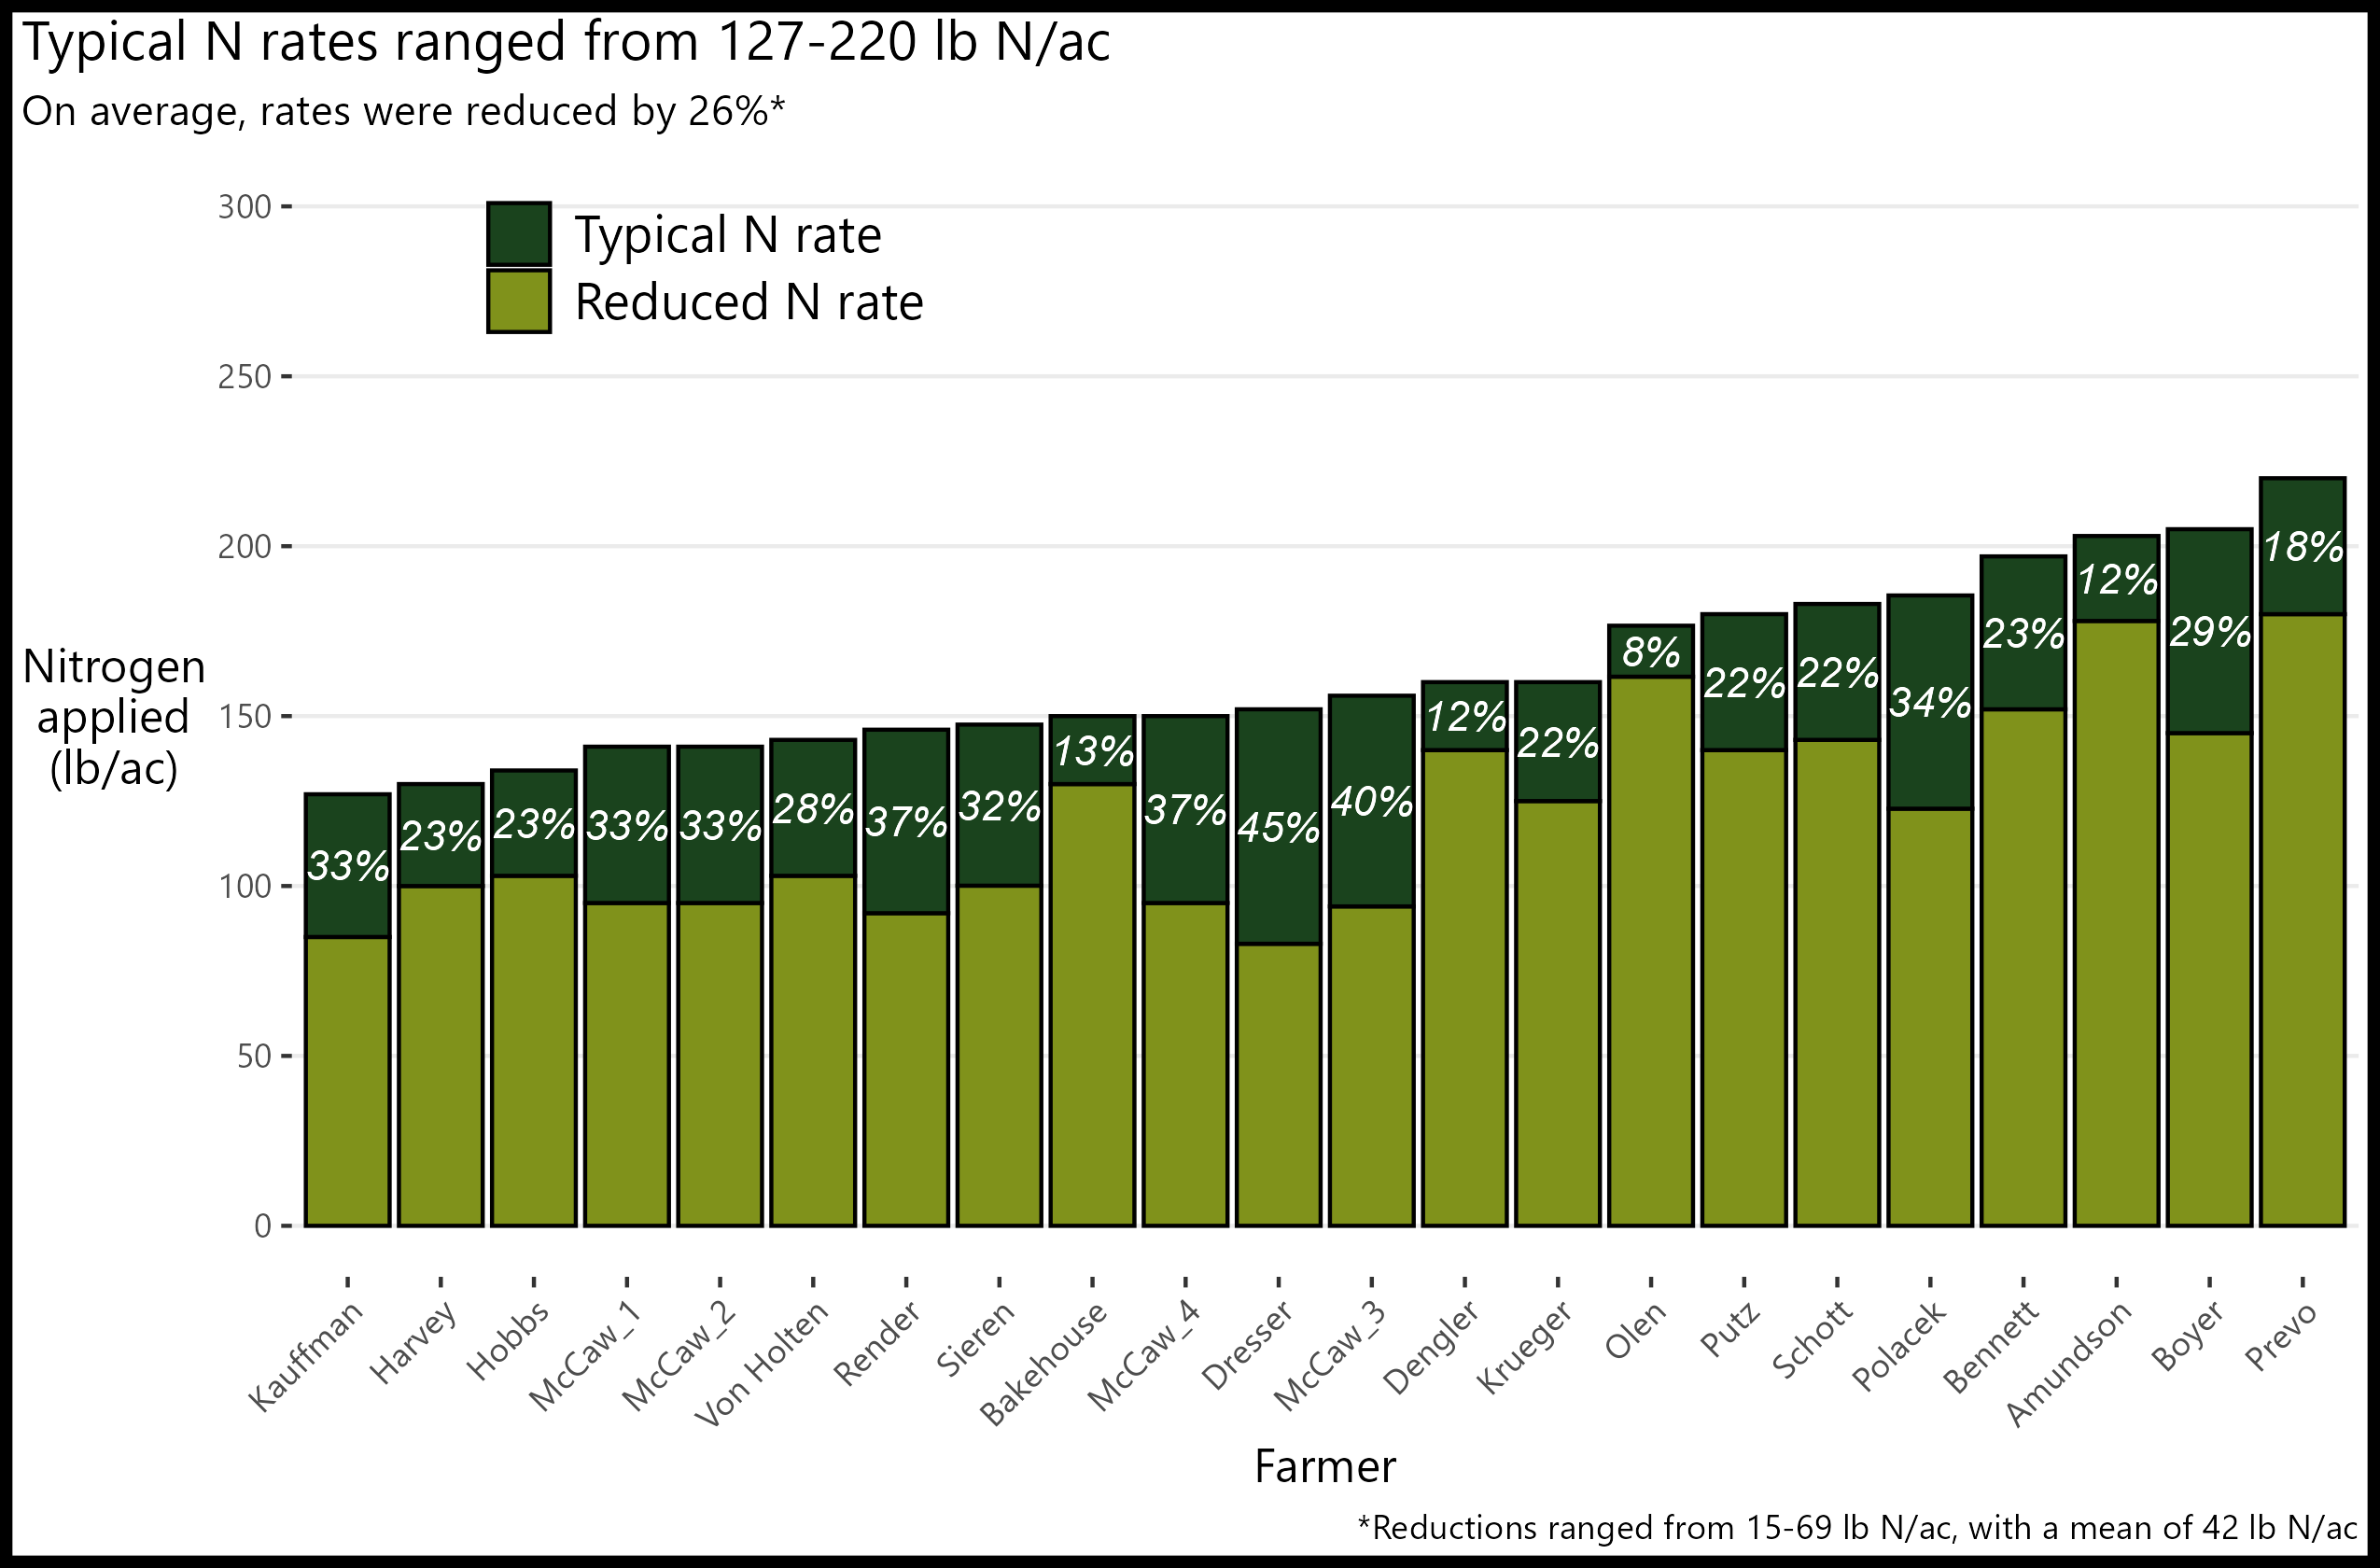
Figure 3. Twenty-two trials tested two nitrogen (N) application treatments in the 2024 growing season. A cooperator’s typical N rate (dark green bar), chosen reduced N rate (light green bar), and the reduction relative to the typical rate (white text). Four of these 22 trials also included treatment strips in which no N was applied (0N, not pictured). Click to enlarge.
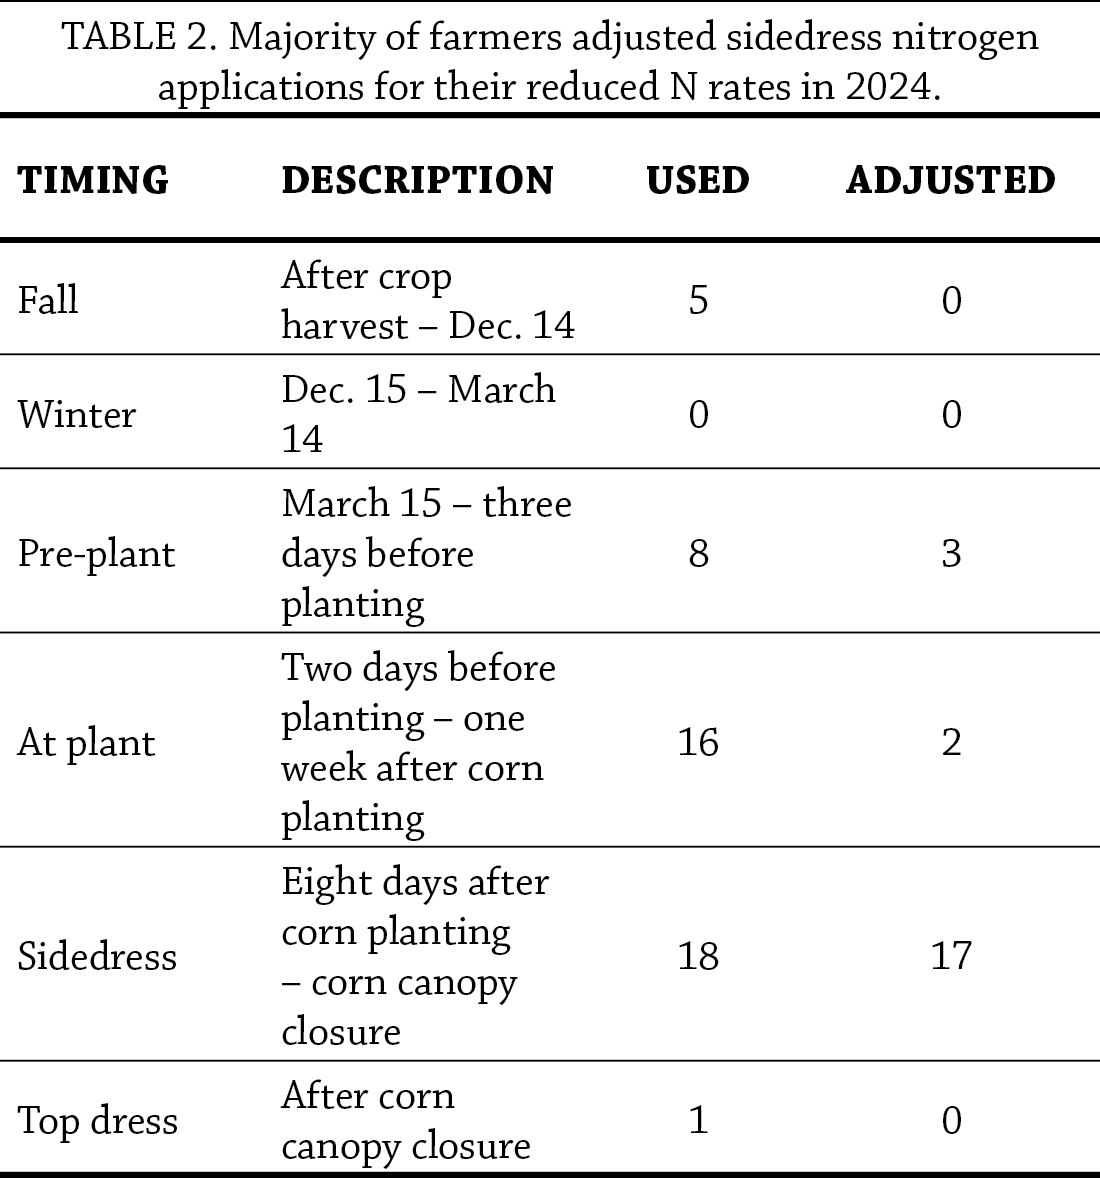 Farmers used a variety of N application timings in their production systems, with most using sidedressing. For the reduced N treatment, 17 of the 22 trials chose to reduce N rates during sidedressing, while holding other applications constant (Table 2).
Weather
All 22 trials saw a warm start and wetter-than-average growing season (Figure 4).
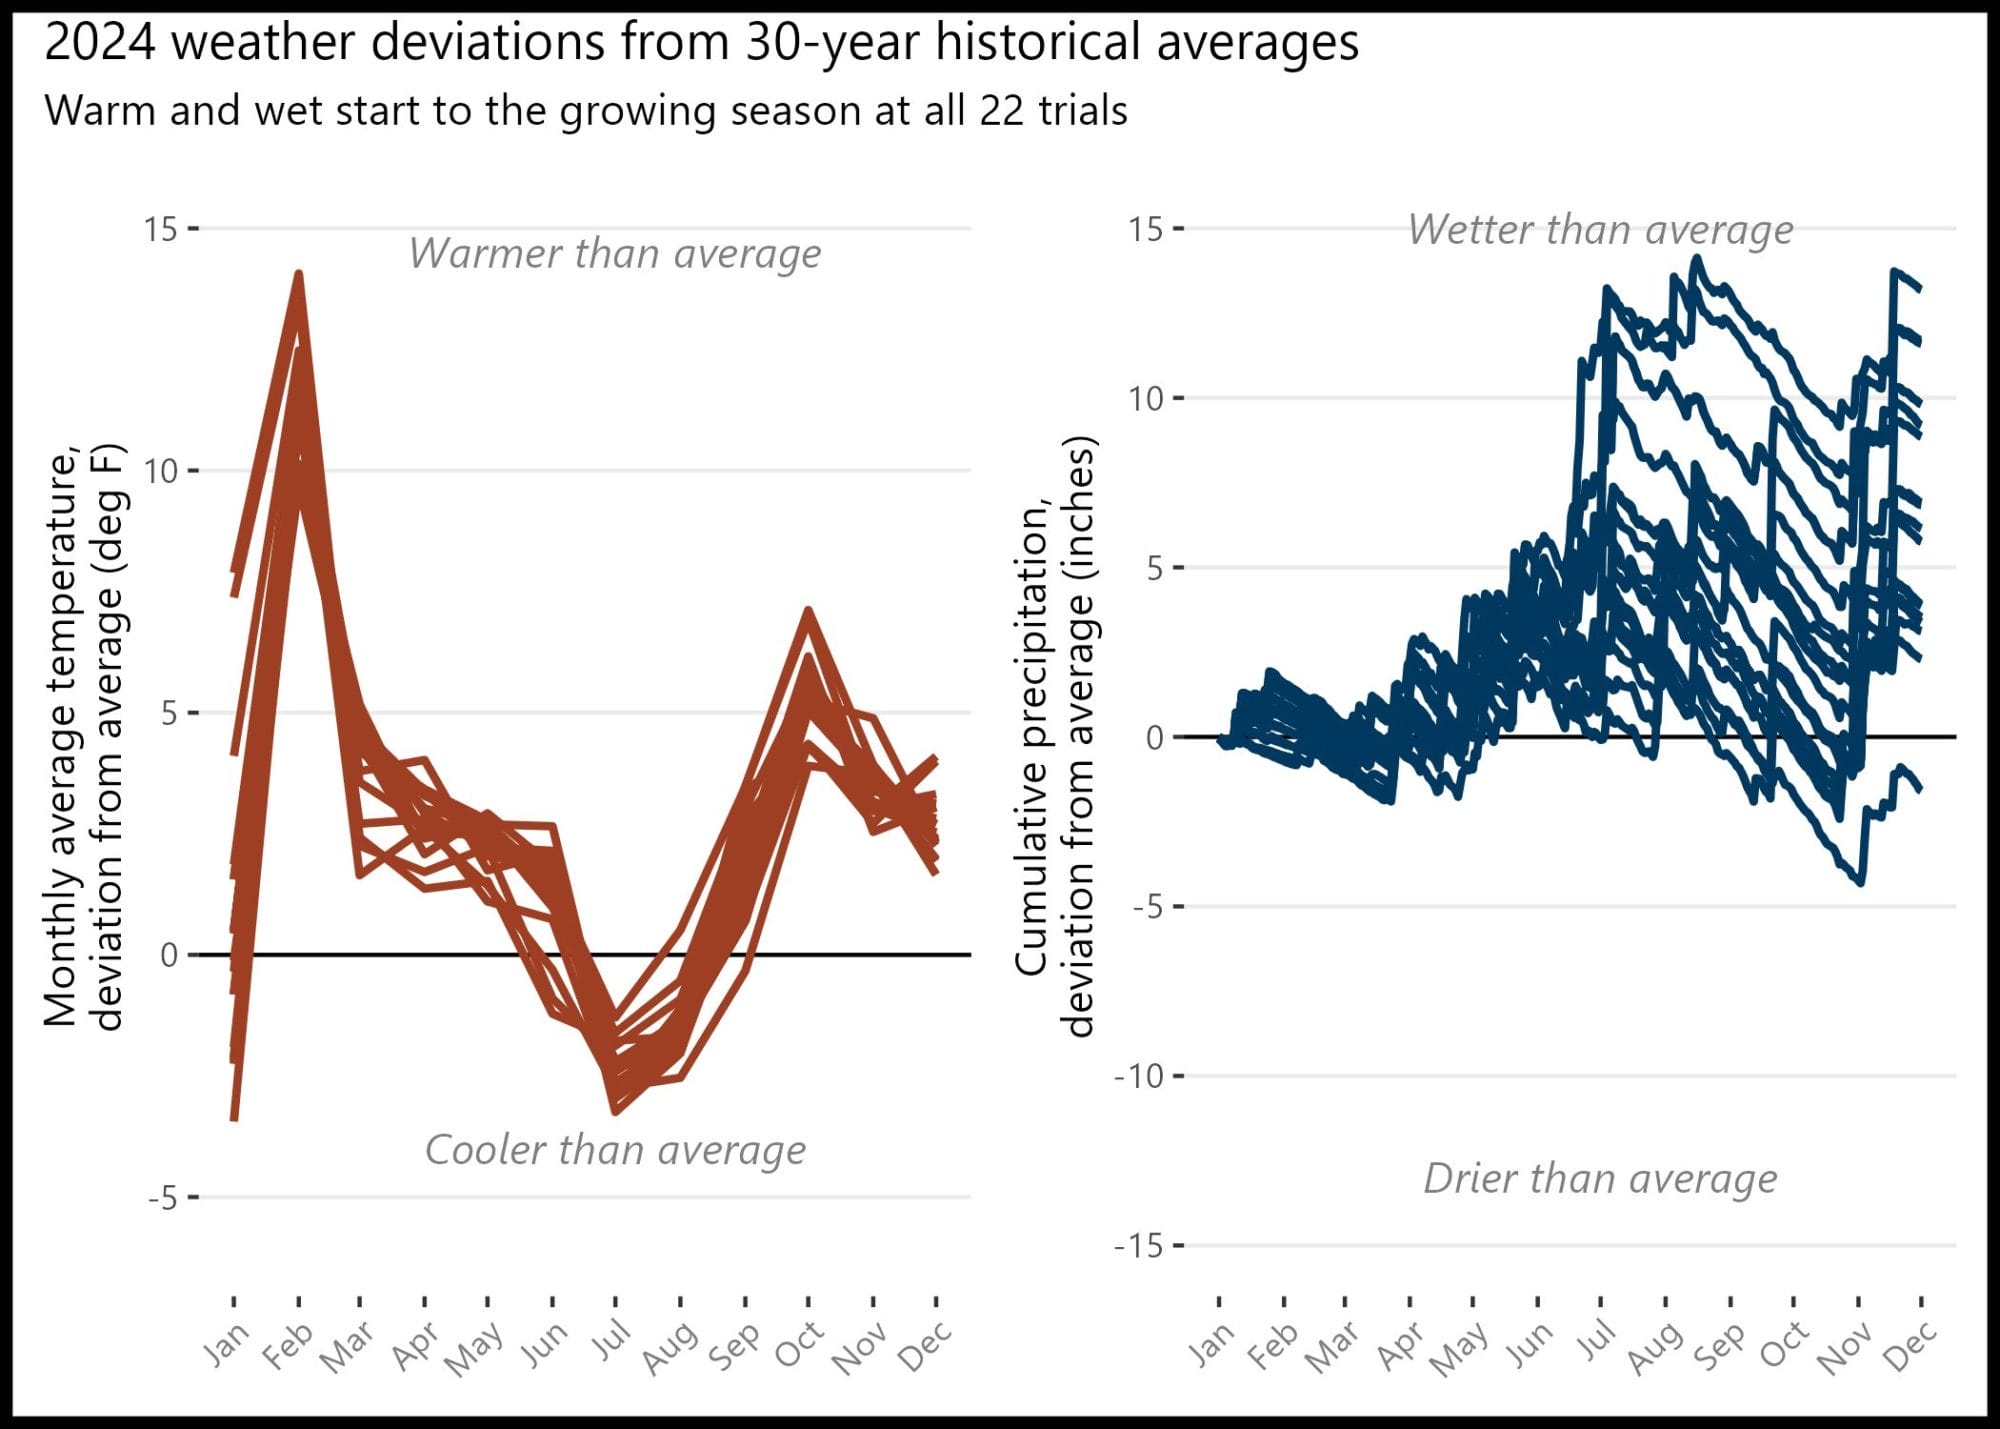
Figure 4. Individual cooperator site weather compared to 30-year historical averages for that site. (Left) Average monthly air temperature deviations and (right) cumulative precipitation deviations.
Overall, although all sites experienced a warm start and wet growing season, the diversity in N application amounts, sources, methods, and timing as well as cropping systems history contributed to varied outcomes for each cooperator. Click to enlarge.
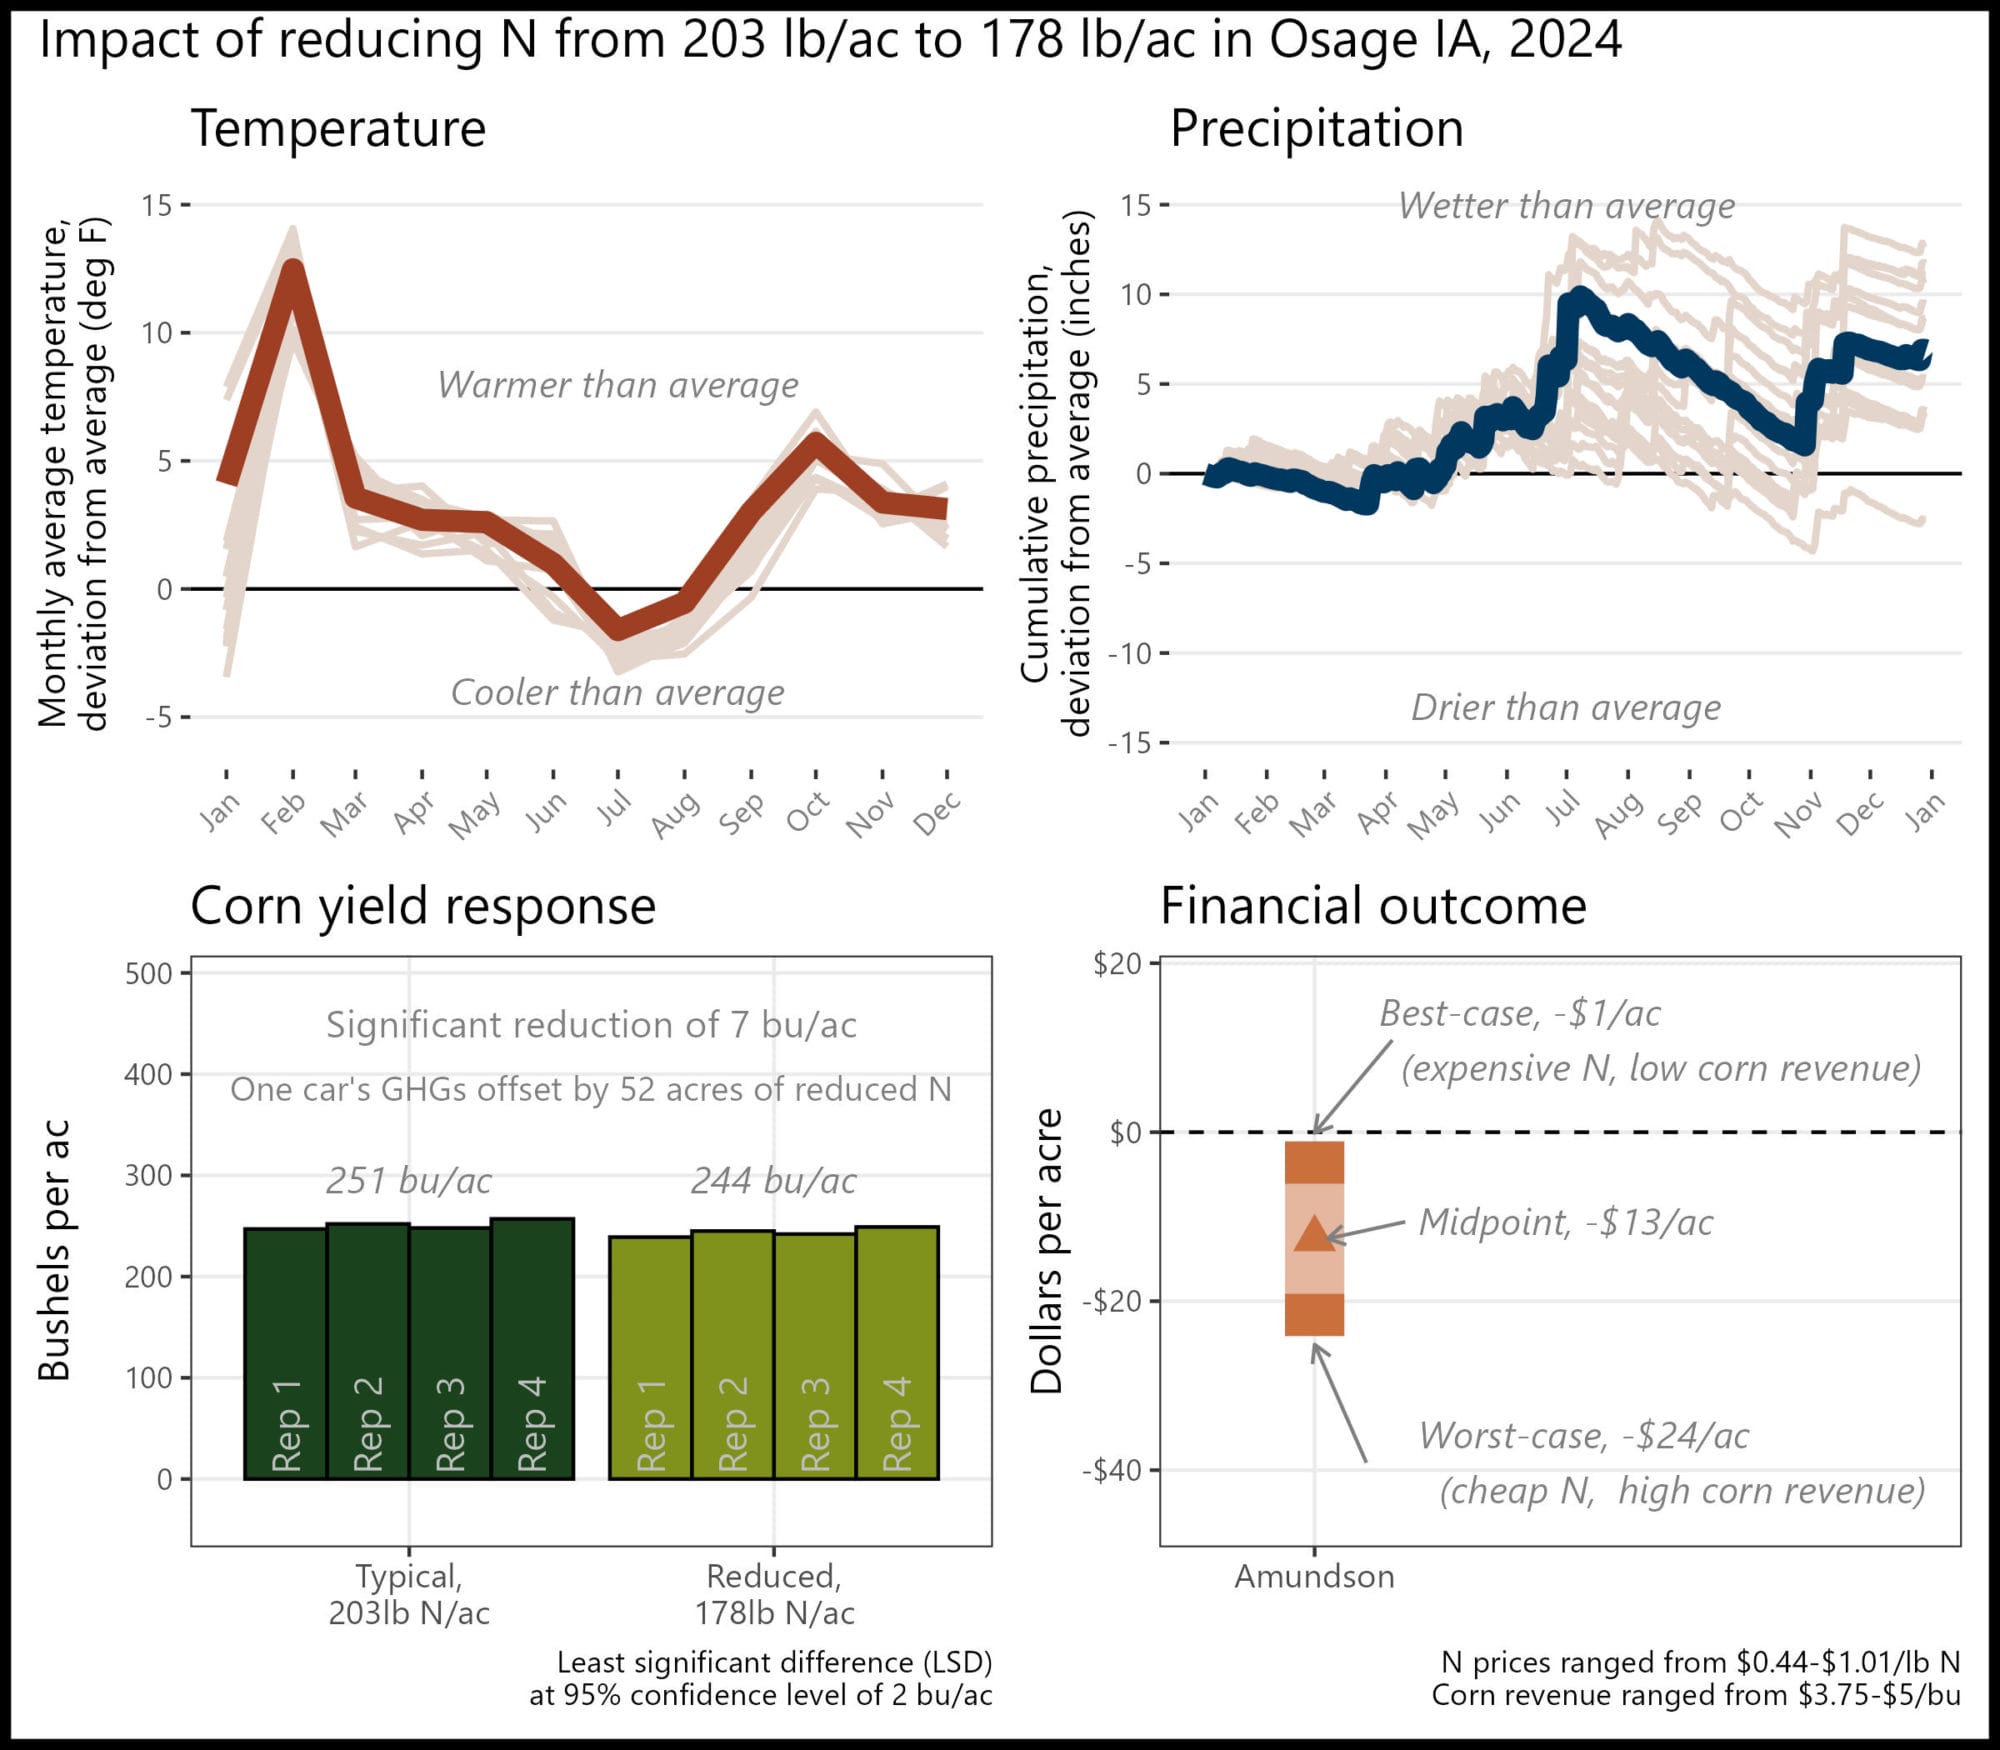
Eighteen of the 22 replicated strip trials (82%) saw statistically significant reductions in corn yields at the reduced N rate. However, it is important to note that statistical significance in yield declines is not related to financial outcomes (Figure 5, left panel). Statistical significance is a function of both the magnitude of the difference in treatments, as well as how variable the yields in the field were. It helps readers and farmers decide how much to ‘trust’ the yield changes, and therefore how to calculate financial outcomes. For example, Alec & Rachel Amundson’s reduced N treatment yielded 7.1 bu/ac less than their typical N treatment corn, and the reduction was statistically significant, so they can be confident that reduction was real. For comparison, Larry Schott’s trial saw a similar reduction in corn yield at the reduced N rate (6 bu/ac), but the reduction was not statistically significant, meaning there was more variation between strips at the Amundsons’ trial location compared to Schott’s, and they may question how ‘real’ the yield reduction was. While the Amundsons and Schott may have different conclusions about the impact of the reduced N treatment on corn yields, they both saw potential financial savings at the reduced N rate (Figure 5, right panel).
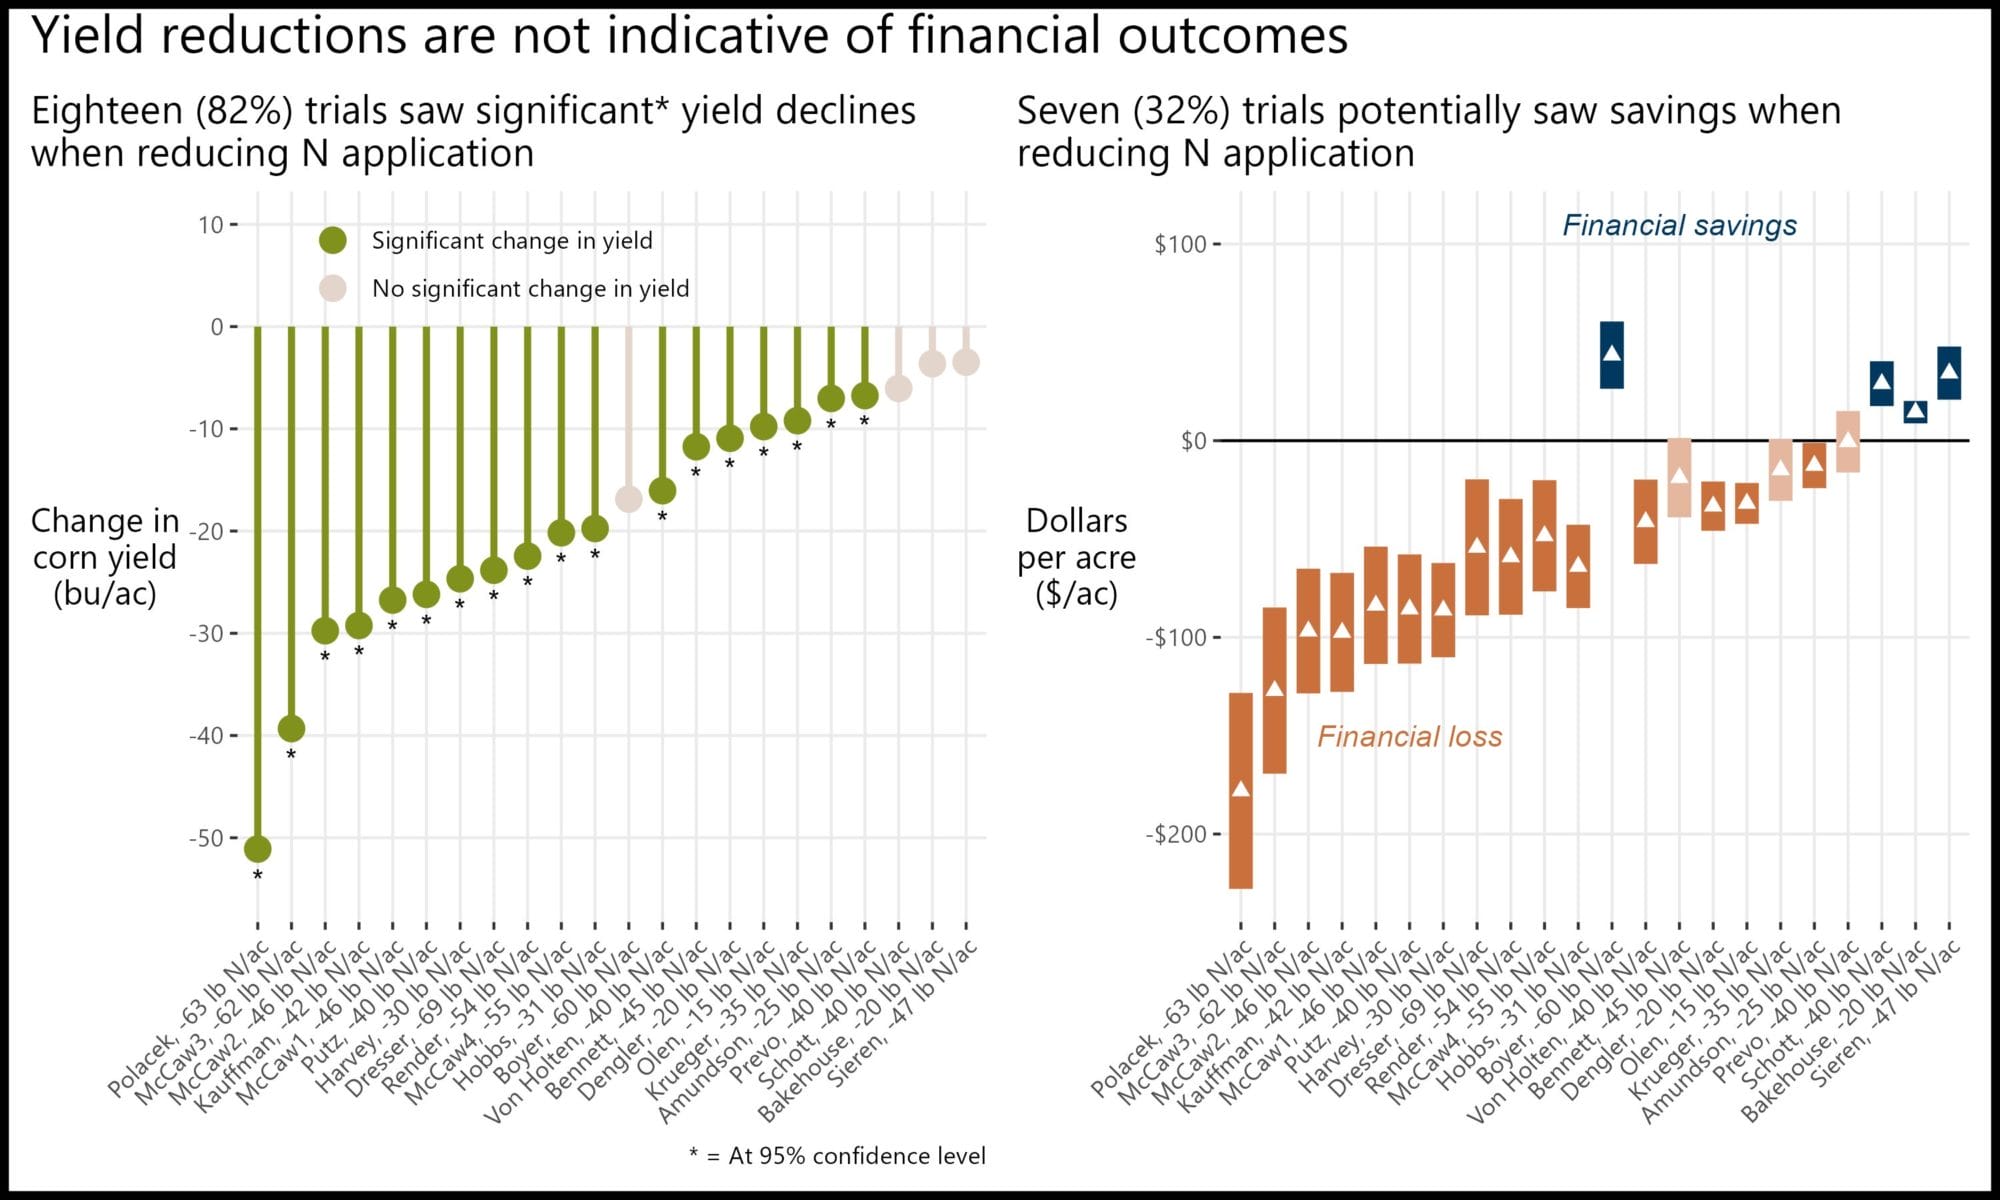
Figure 5. Impact of reducing N rates on corn yields and finances. The x-axis labels present each farmer and the amount they reduced their typical N rate to achieve the reduced N treatment (see Figure 4), ordered by their change in corn yield when reducing N rates. (Left) The y-axis presents the change in corn yields in the reduced N treatment relative to yields in the typical N treatment, with the color indicating whether the change was statistically significant (green with *) or not significant (tan). (Right) The x-axis presents the farmers, still ordered by their yield change, and the y-axis presents the financial outcome in the reduced N treatment relative to the typical N treatment assuming best-case (top of vertical bar), worst-case (bottom of bar) and midpoint 2023 price scenarios (white triangles). Blue bars indicate a financial savings in the midpoint price scenario, orange bars indicate a financial loss in the midpoint price scenario, and lighter colored bars indicate the financial outcome was sensitive to the price scenario considered. Click to enlarge.
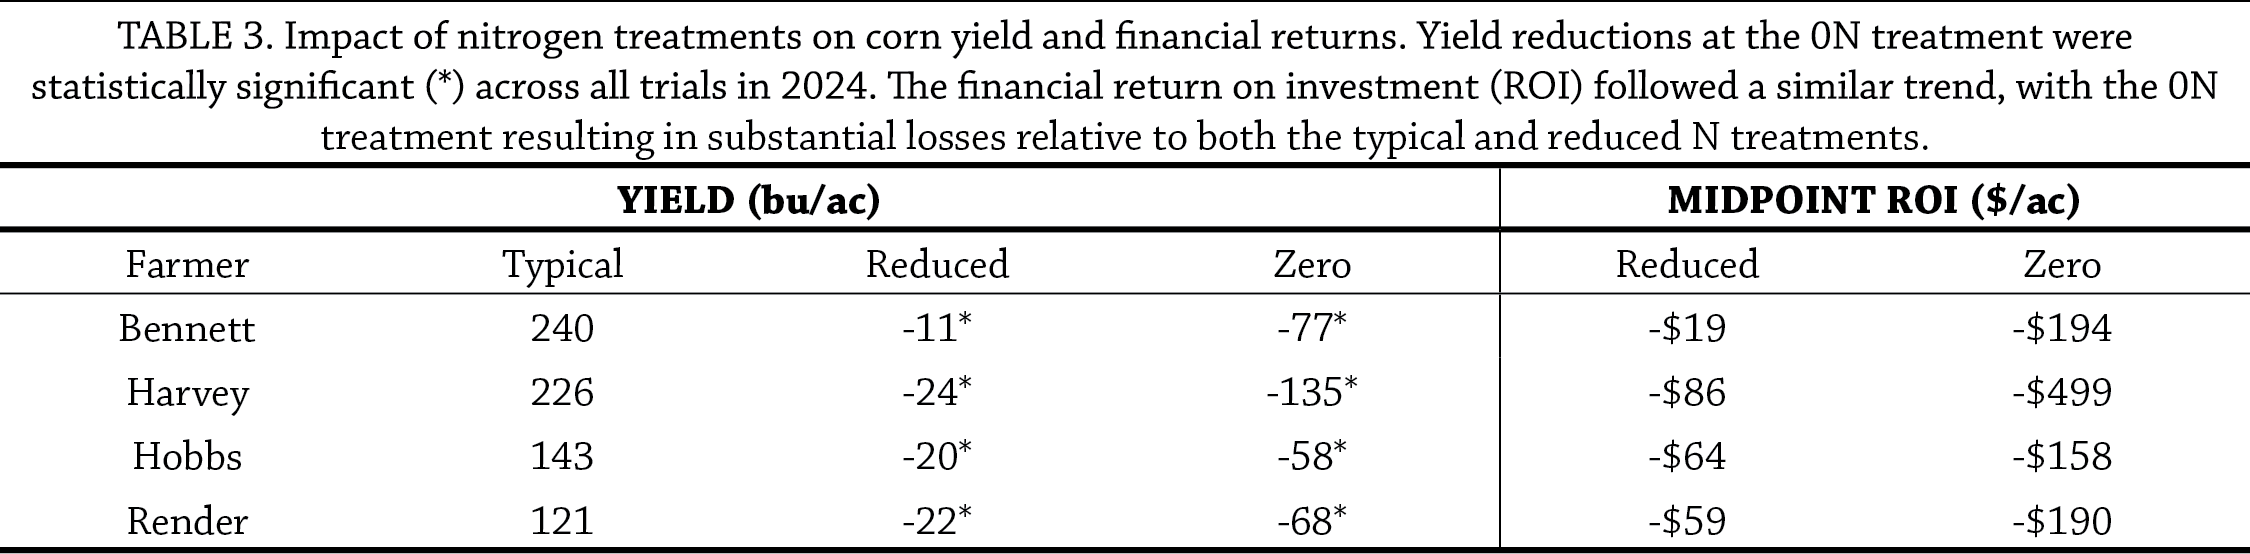
The addition of a zero–nitrogen (0N) treatment this year, used by four farmers participating in this research, provided further insights into nitrogen’s role in corn production. As expected, all four 0N trials experienced statistically significant reductions in yield compared to their typical and reduced N treatments. Yield declines at 0N treatment ranged from 58 to 135 bu/ac when compared to the typical N rate (Table 3). Financially, the 0N resulted in substantial revenue losses across all trials, with midpoint ROI reductions ranging from -$158 to -$499/ac compared to the typical N rate. Despite the yield declines and revenue losses, the 0N provided valuable insights into the baseline productivity of these fields in the absence of synthetic nitrogen inputs.
Finances
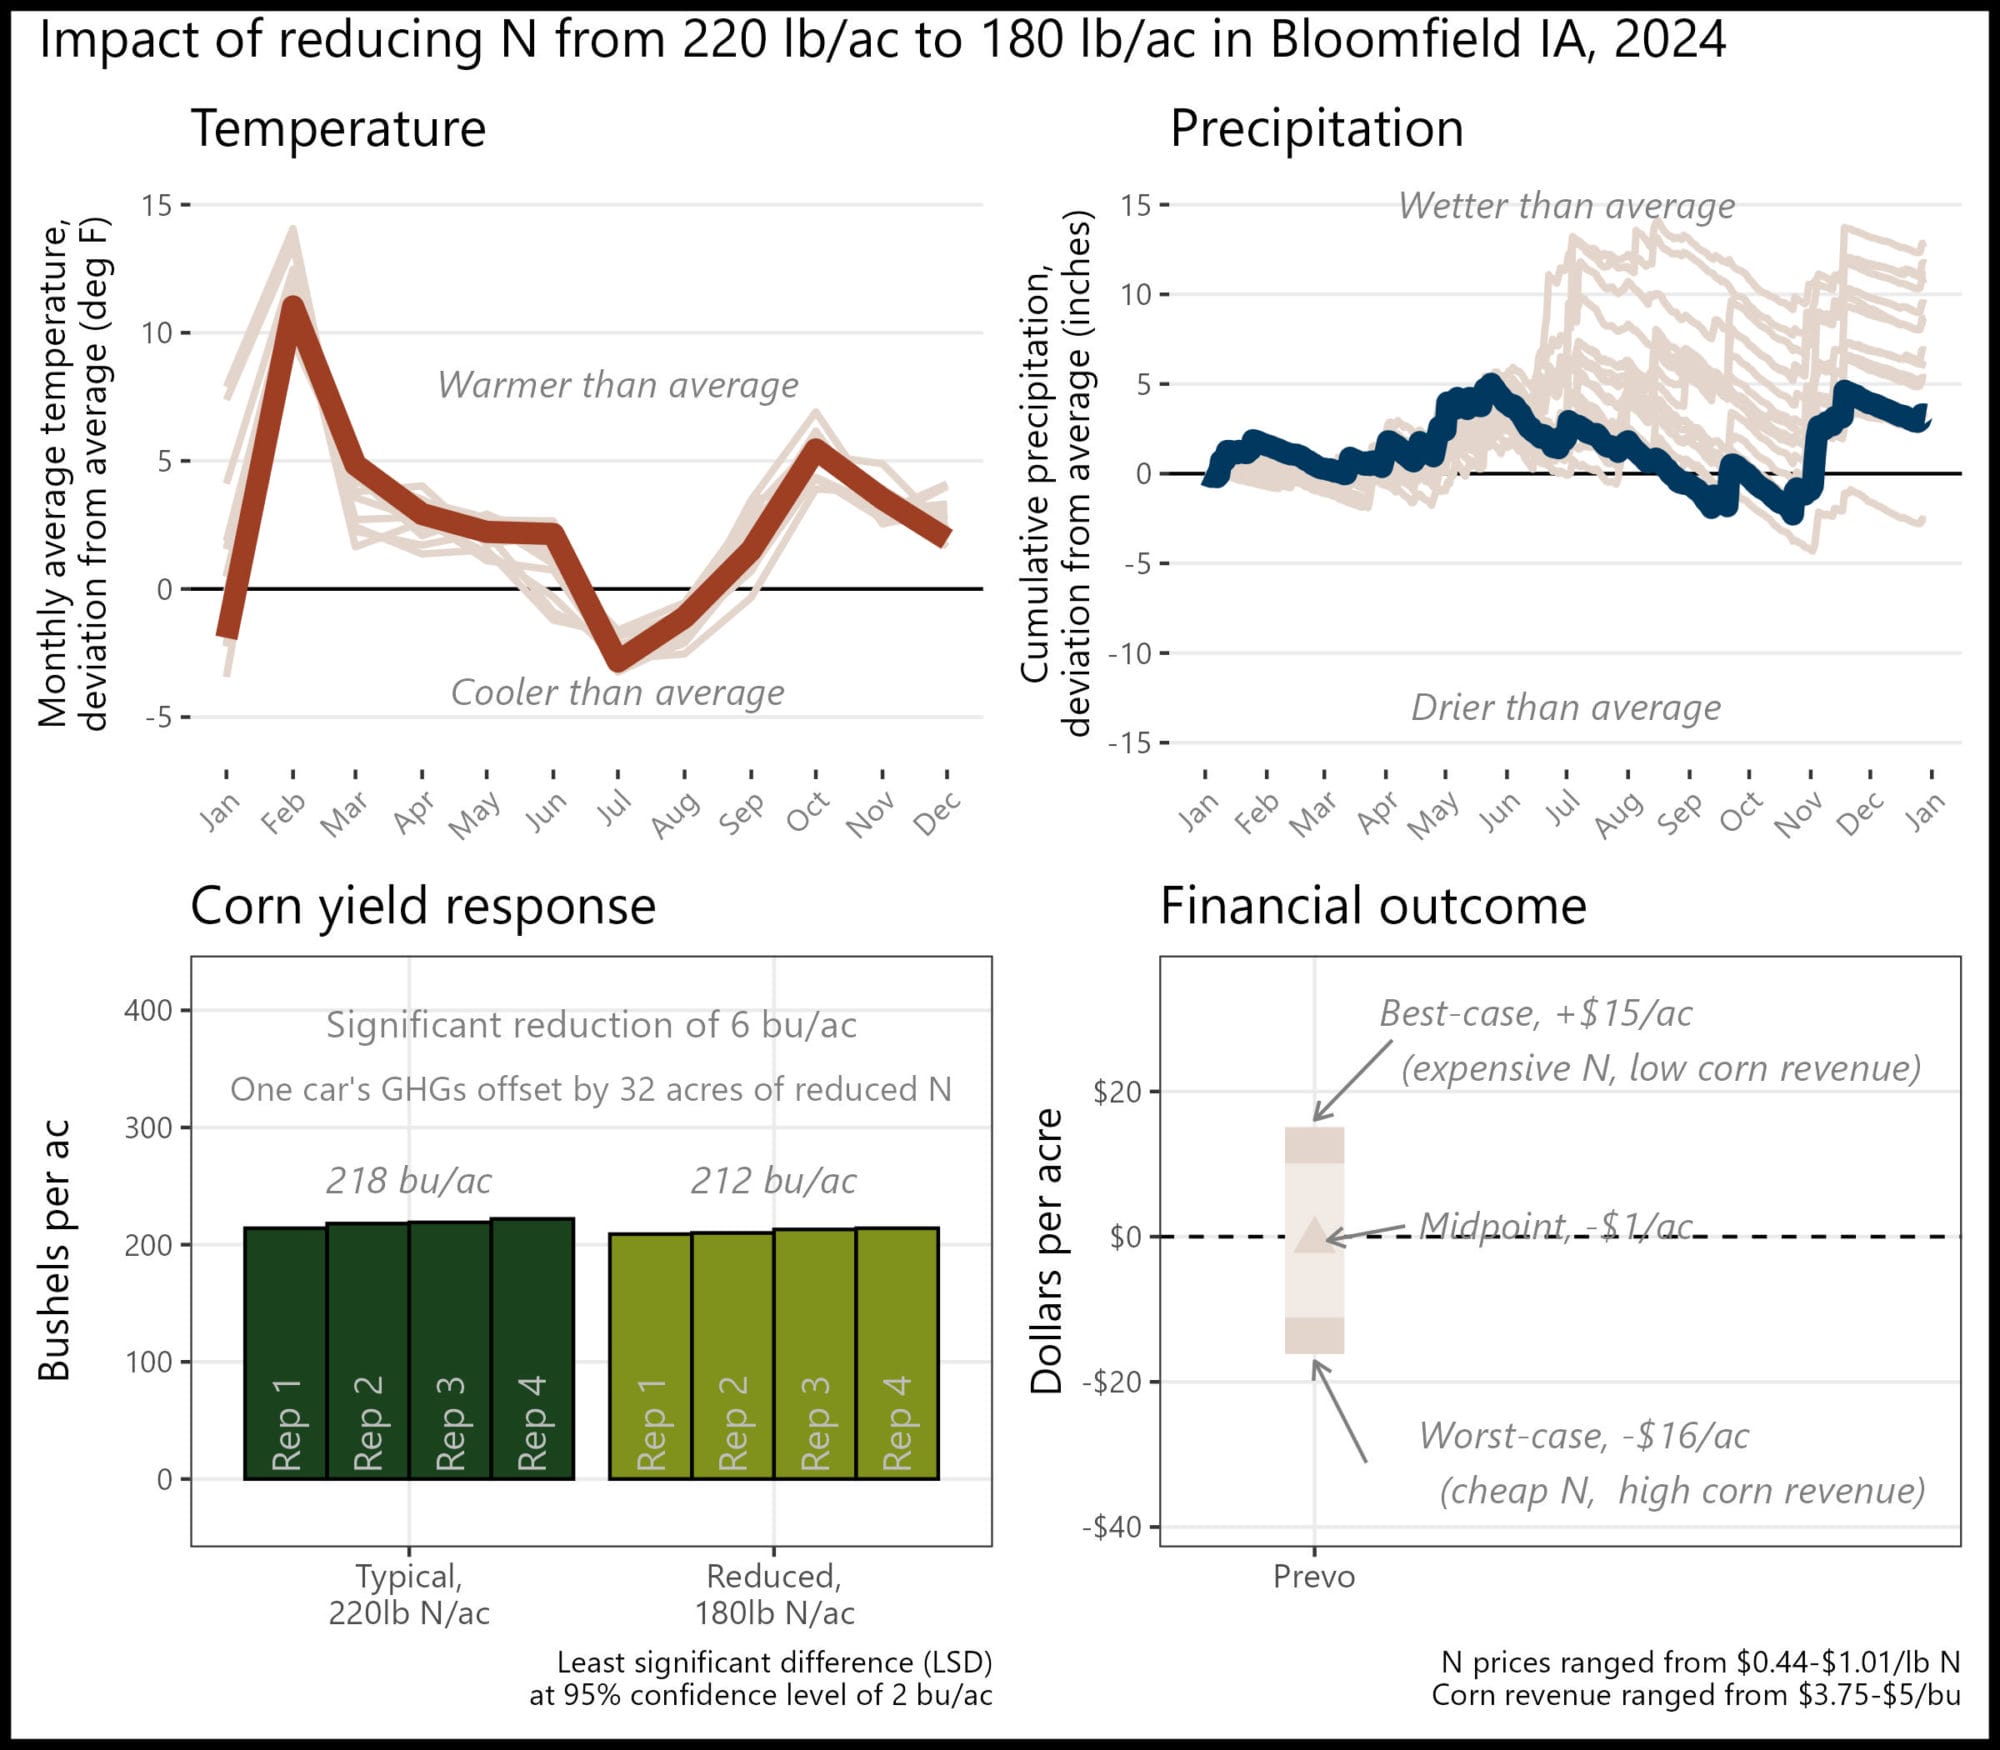
The financial outcomes of reducing applied N varied by trial and price scenario (Figure 5, right panel). Four trials saved money in the reduced N treatment compared to the typical N treatment regardless of the price scenario considered (Table 1). An additional three trials showed potential for savings under at least one price scenario. For example, in the best-case scenario Kevin Prevo saved $15/ac, but lost $0.53/ac in the mid-point scenario and lost $16/ac in the worst-case scenario. Fourteen trials lost money in every price scenario. In this set of trials, the worst potential financial loss observed was $228/ac (Polacek’s worst-case scenario), and the best potential financial savings was $60.60/ac (Boyer’s best-case scenario).
Greenhouse gas emissions
Reducing N applications will always reduce GHG emissions associated with corn production. In 2024, avoided GHGs ranged from 120-540 lb CO2e/ac. However, using midpoint price scenarios (Table 1), in four trials those avoided emissions co-occurred with a financial savings, while in 17 trials the reduced GHG emissions came at a financial loss (Figure 6, left panel).
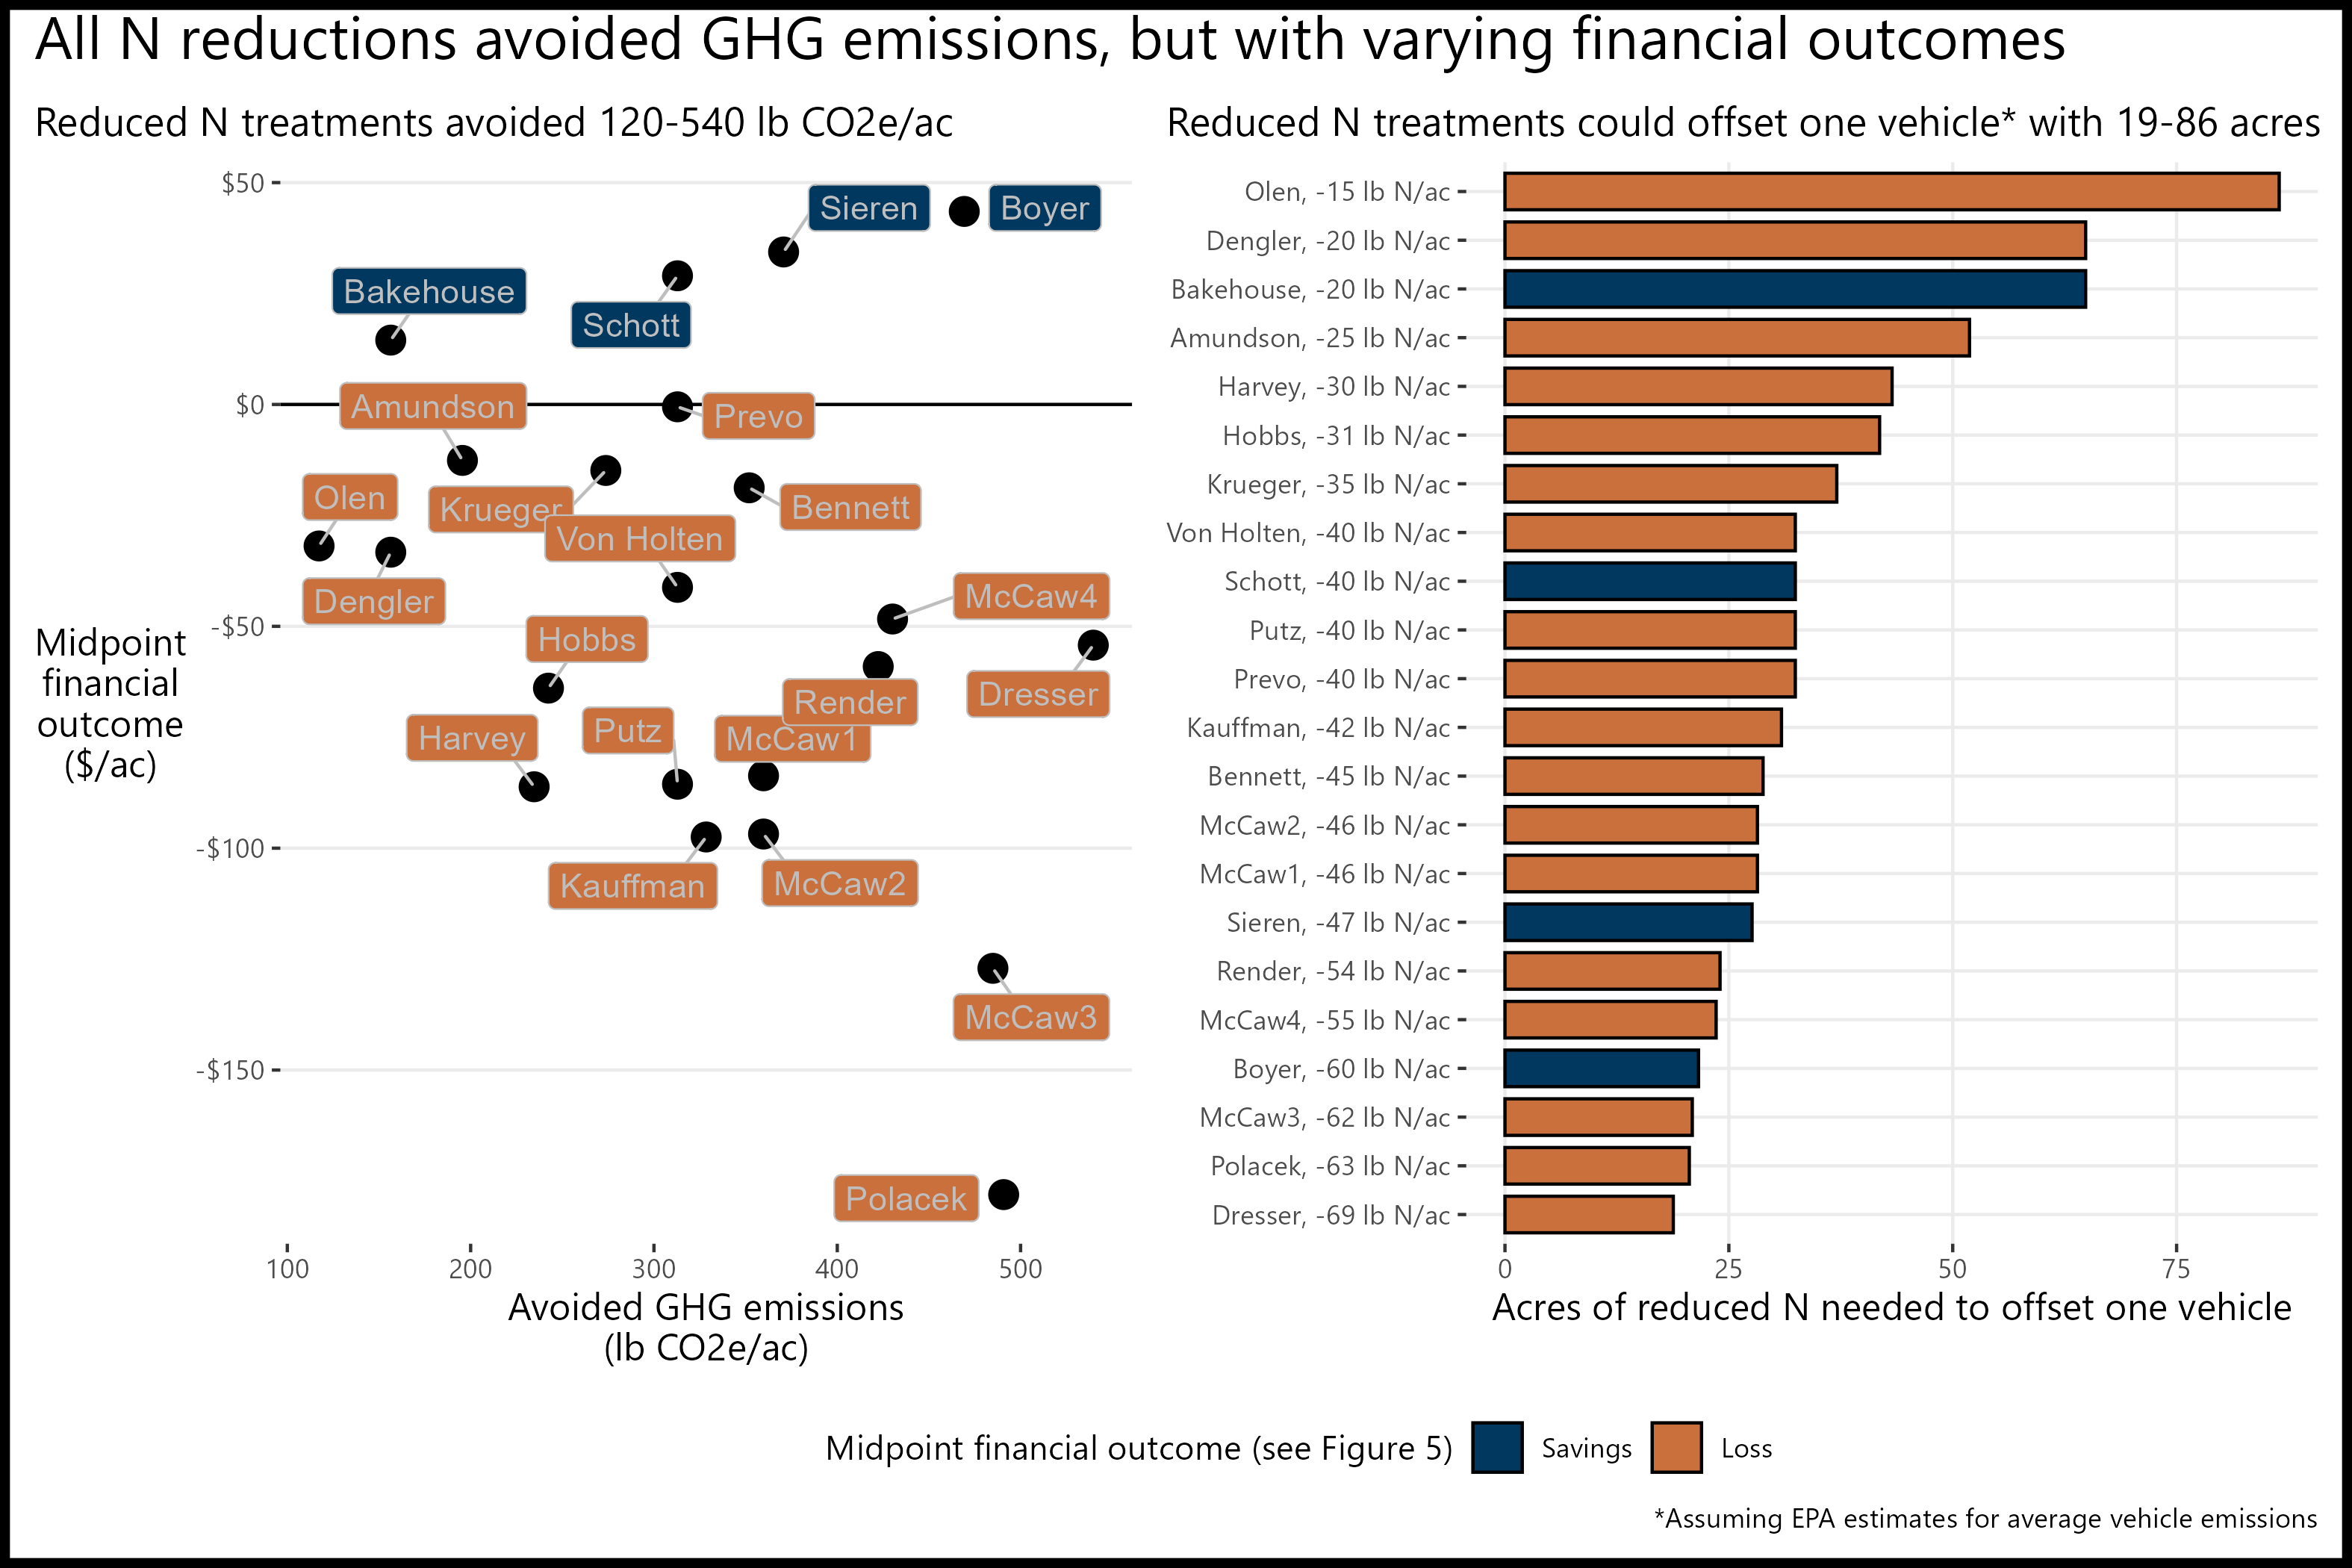
Figure 6. Seventeen farmers lost money while reducing GHG emissions, while four farmers potentially saved money in 2024. (Left) All trials avoided GHG emissions and 4 of the 22 trials also saved money assuming mid-point price scenarios (dark blue), while 17 trials lost money in the mid-point price scenario (orange). (Right) Based on the Environmental Protection Agency [8] estimated GHG emissions for one average gasoline vehicle (22.2 miles per gallon, driven 11,500 miles per year), reducing N applications by 15-69 lb/ac would offset one vehicle’s emissions if utilized on 19-86 acres. Click to enlarge.
To put these avoided GHG emissions into perspective, one vehicle emits around 10,000 lb CO2e/year [8]. Using each trial’s selected N reduction, we back-calculated how many acres the farmer would need to apply their reduced N treatment to offset one vehicle. For example, Larry Schott chose to reduce his typical N application by 40 lb/ac. Schott could offset one vehicle’s emissions by using his reduced N rate on 32 acres (Figure 6, right panel). Using his midpoint price scenario savings of $29/ac (Figure 5, right panel) he would potentially save around $900. However, if, for example, Sam Bennett applied his reduced N treatment (45 lb/ac reduction) to 28 acres, he could offset one vehicle’s emissions but would also lose $19/ac, or around $500.
Conclusions and Next Steps
Of the 22 replicated strip-trials, seven potentially saved money in the reduced N treatment (any part of the bars above the zero line in the right panel of Figure 5). More specifically, four trials saved money under all three price scenarios, and three trials saved money only under the best-case price scenario. Fourteen trials likely lost money in the reduced N treatment under all price scenarios.
All trials avoided GHG emissions by reducing N fertilizer and 4 of the 22 trials could do so while also saving money under the mid-point price scenario (left pane of Figure 6). To offset the emissions of a single vehicle, those farmers would have to apply their reduced N rate to only 19-86 acres on their farms. That is a climate-smart win-win for farming and the environment.
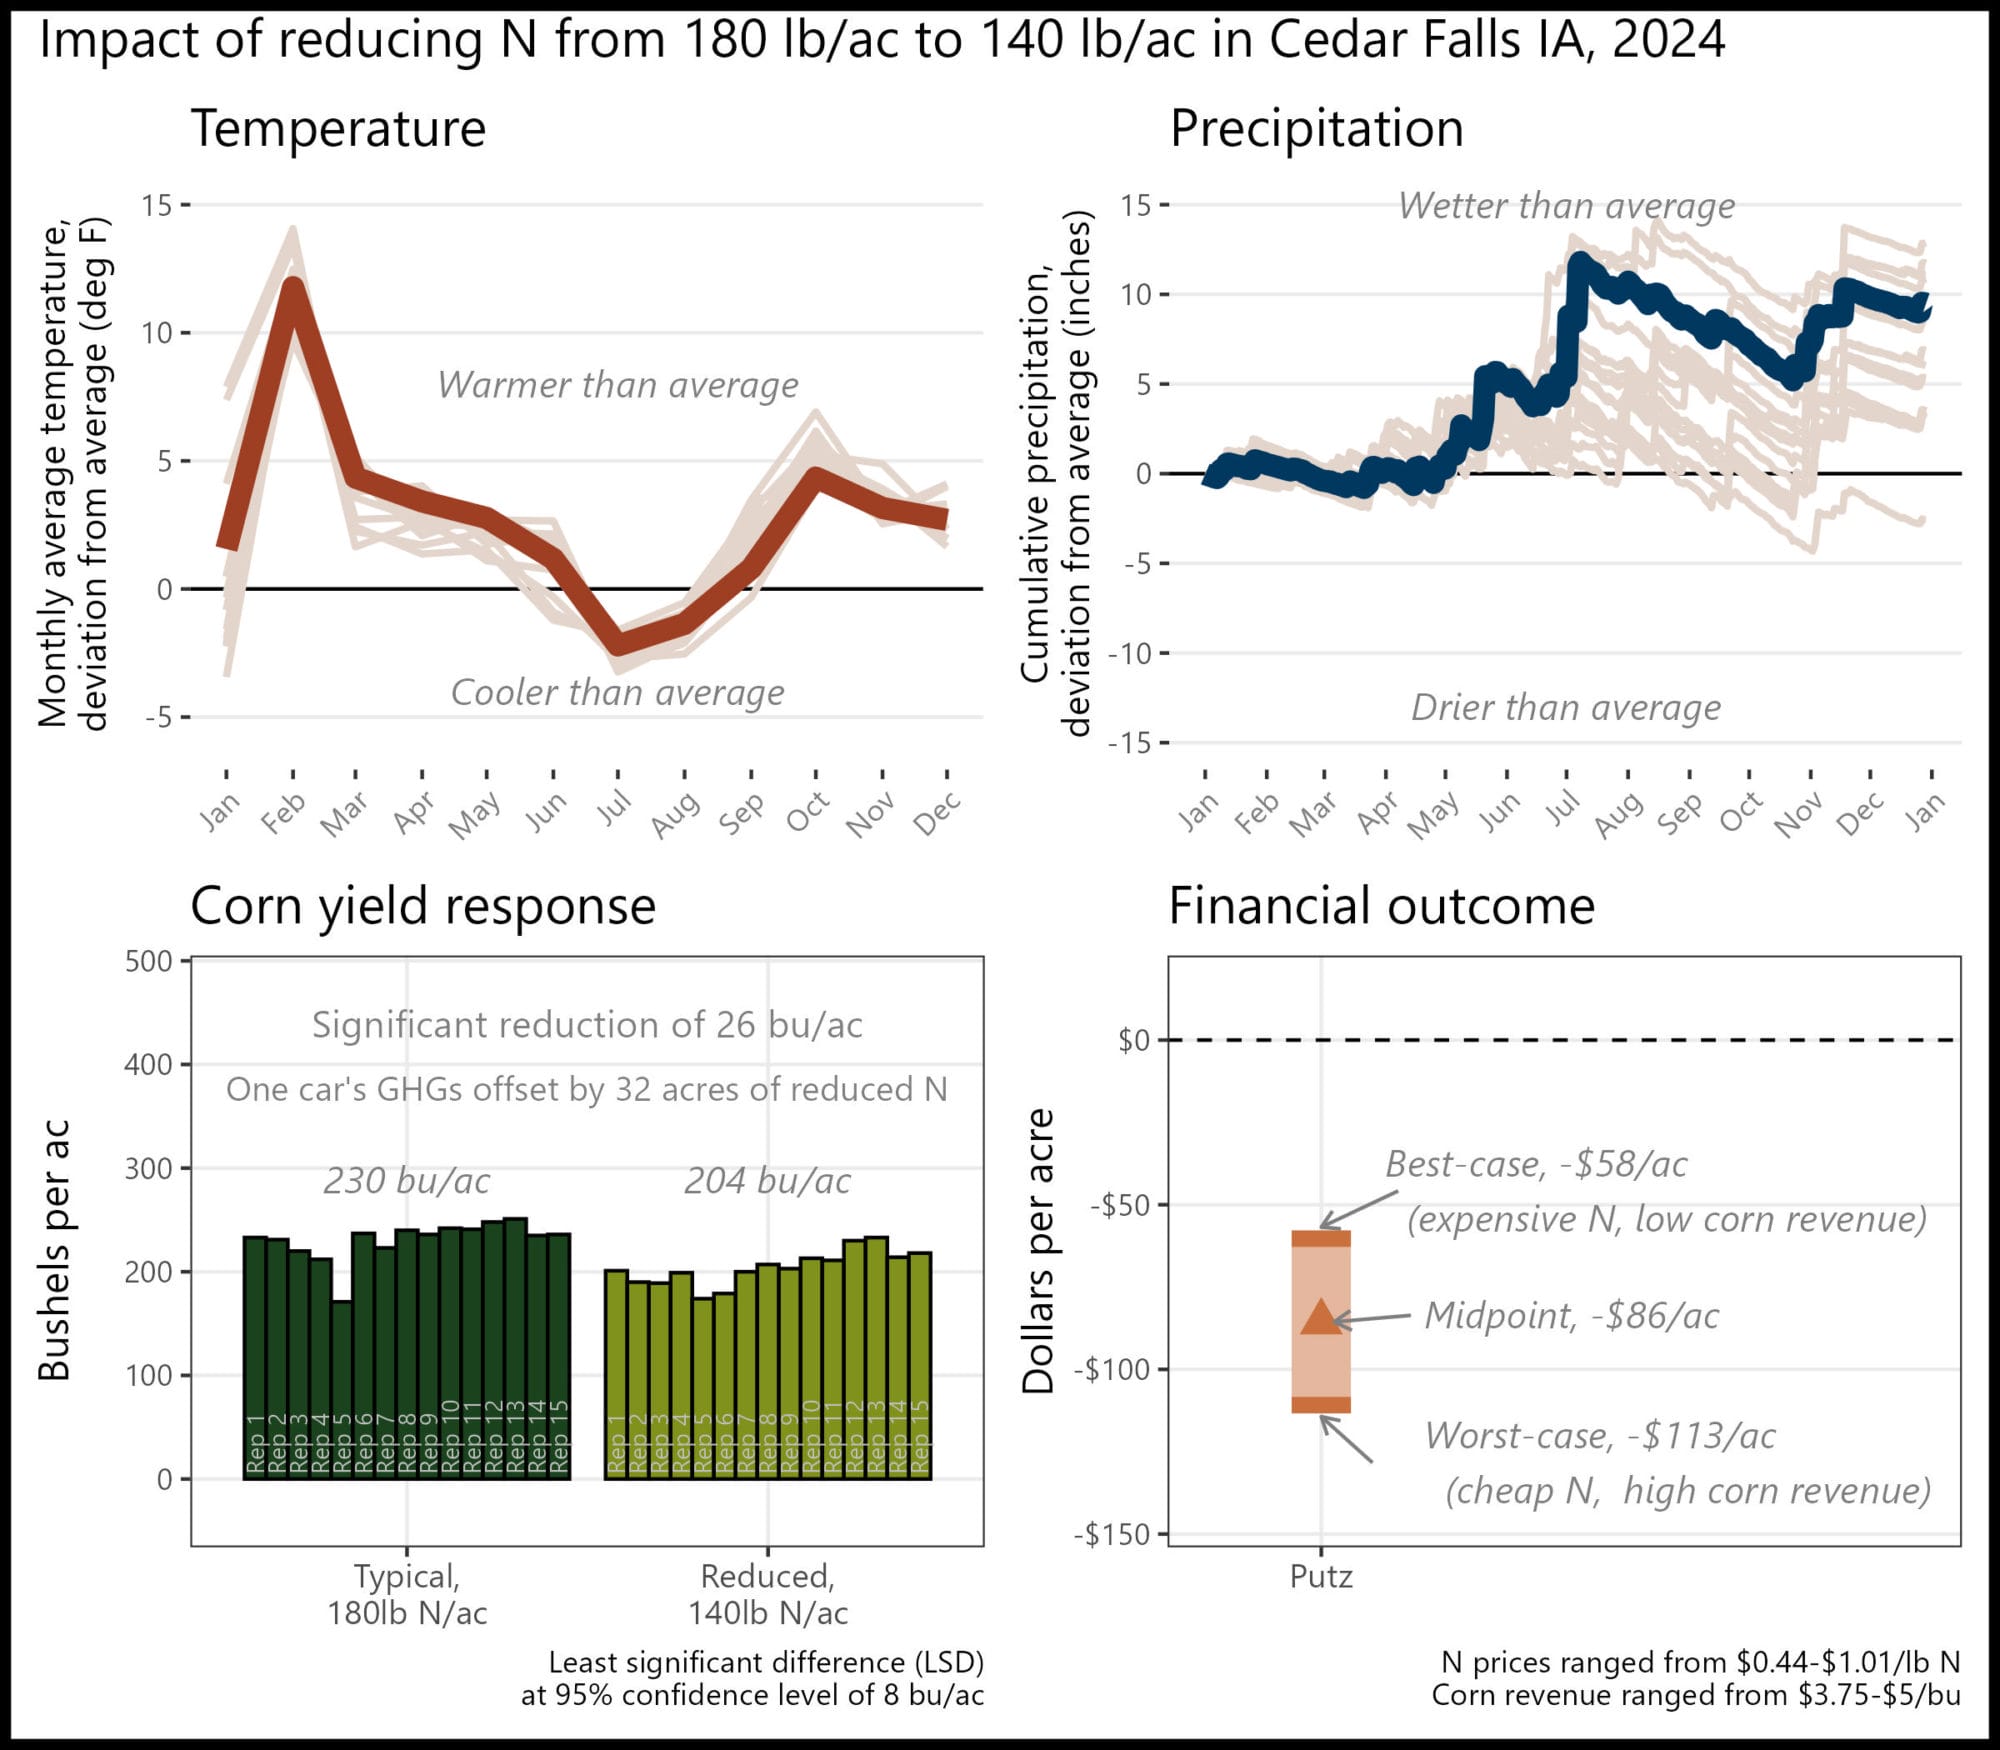
The 2024 N rate trials continued to build upon previous years’ findings, further exploring the economic and environmental impacts of reducing N applications in corn production. Recognizing the influence of weather and other variable conditions on outcomes, we will continue expanding data collection to strengthen the reliability of our insights. As participant Don Putz emphasized, “We will be running this same scenario for at least two more years to get a clearer picture of the results.” This ongoing effort will help account for year-to-year variability and refine recommendations, ensuring that future conclusions are based on a more comprehensive dataset rather than isolated seasonal conditions.
Appendix A. Alec and Rachel Amundson; Osage, Iowa
“I’ll continue to fine tune nitrogen applications.”
The financial outcome at the reduced N rate was likely a financial loss compared to the typical N rate. A 25 lb N/ac reduction was likely too large this year, but there may be potential for financial savings with a smaller N reduction.
Historical cropping system (5 year): No-till corn, soybeans, oats, cereal rye and clover cover crops.
Previous crop: Oats, clover cover crop.
Strip size: 1.8 ac
Corn planting/harvest date: May 13/October 15
Corn row spacing/planting density: 30 in; 33,670 seeds/ac
Nitrogen sources and timing: Chemical sources; fall, at-plant, sidedress, topdress
Appendix B. Jon Bakehouse; Hastings, Iowa
“We’ve been running this kind of trial for many years, so we’ve already learned a lot. It’s amazing that we are still gleaning useful information after all these years.”
The financial outcome at the reduced N rate was likely a financial savings compared to the typical N rate. A 20 lb N/ac reduction saved money this year, and, when applied to at least 65 acres, could offset the average annual GHGs of one vehicle.

Historical cropping system (5 year): No-till corn and soybeans, cereal rye cover crop
Previous crop: Soybeans
Strip size: 0.4 ac
Corn planting/harvest date: April 24/October 5
Corn row spacing/planting density: 30 in; 32,000 seeds/ac
Nitrogen sources and timing: Chemical; pre-plant, sidedress
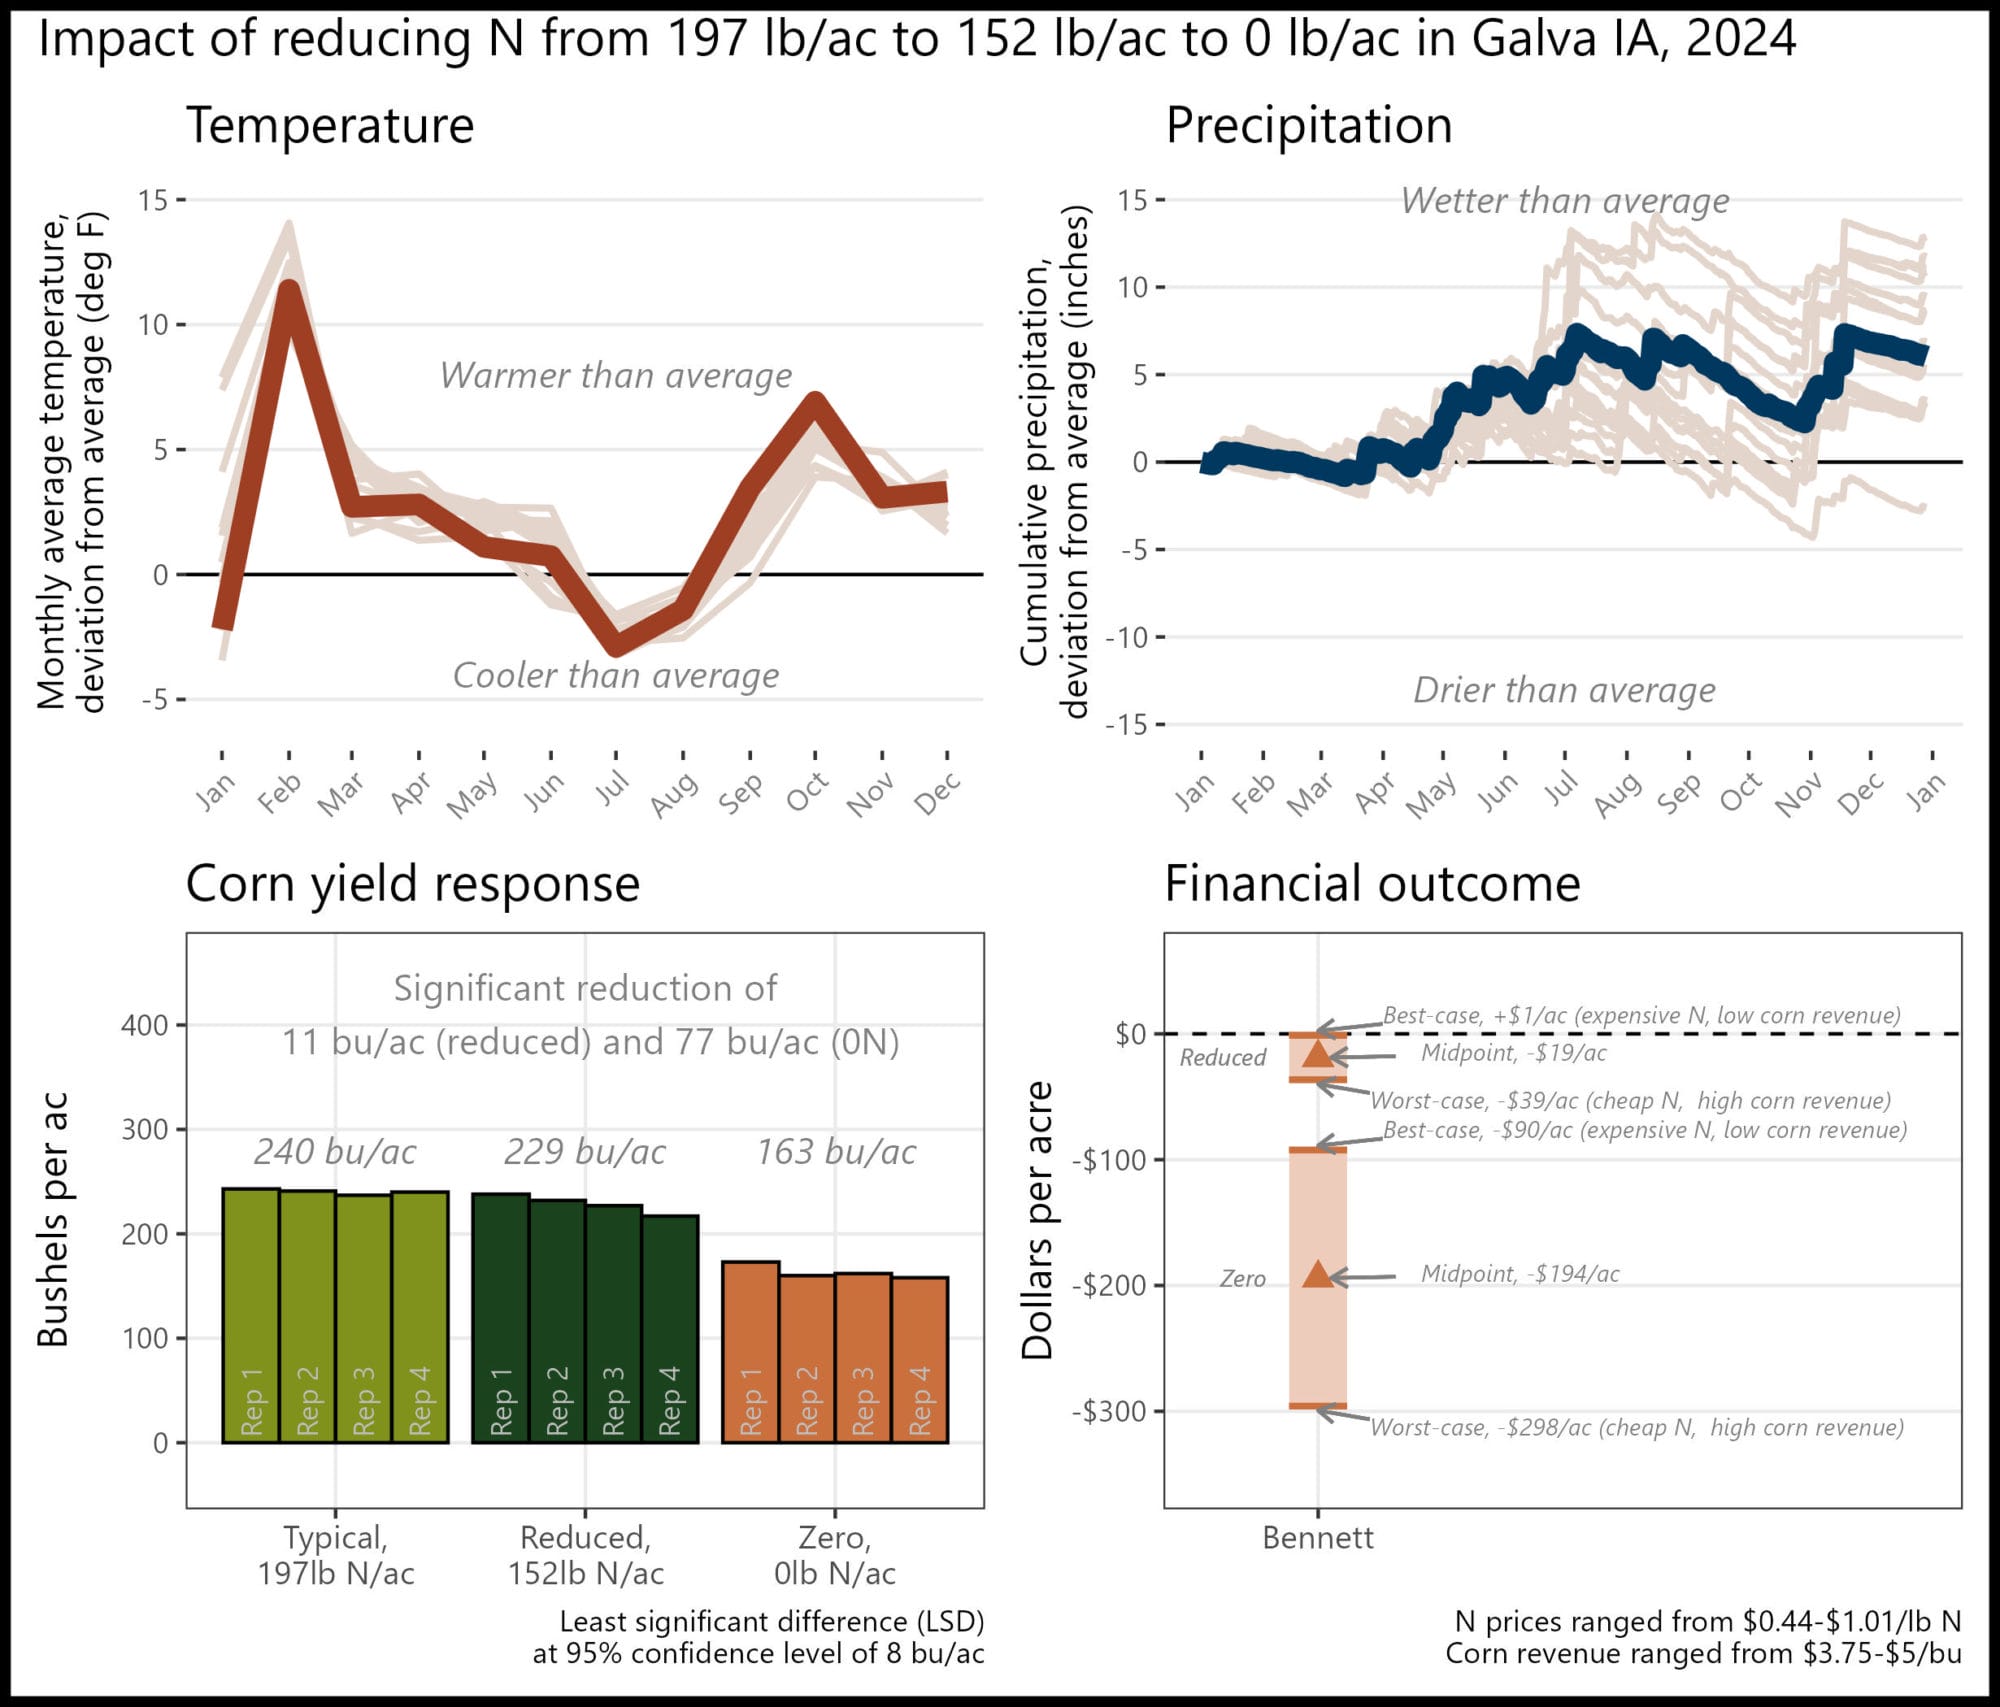
Appendix C. Sam Bennett; Galva, Iowa
“Continuing to dial in an N rate. Trying to quantify and monetize soil health”
The financial outcome at both the reduced N rate and zero N rate resulted in a financial loss compared to the typical N rate. A reduction of 45 lb N/ac was likely too large this year, but there may be potential financial savings with a smaller N reduction. While considerable yield losses are expected when no nitrogen is applied, the 0N treatment is important for understanding the full impact of nitrogen on yield and profitability.
 Historical cropping system (5 year): Strip/no-till corn and soybeans, cereal rye cover crop
Previous crop: Soybeans and cereal rye
Strip size: 0.9 ac
Corn planting/harvest date: April 25/October 20
Corn row spacing/planting density: 30 in; 36,000 seeds/ac
Nitrogen sources and timing: Chemical; fall, at-plant, sidedress
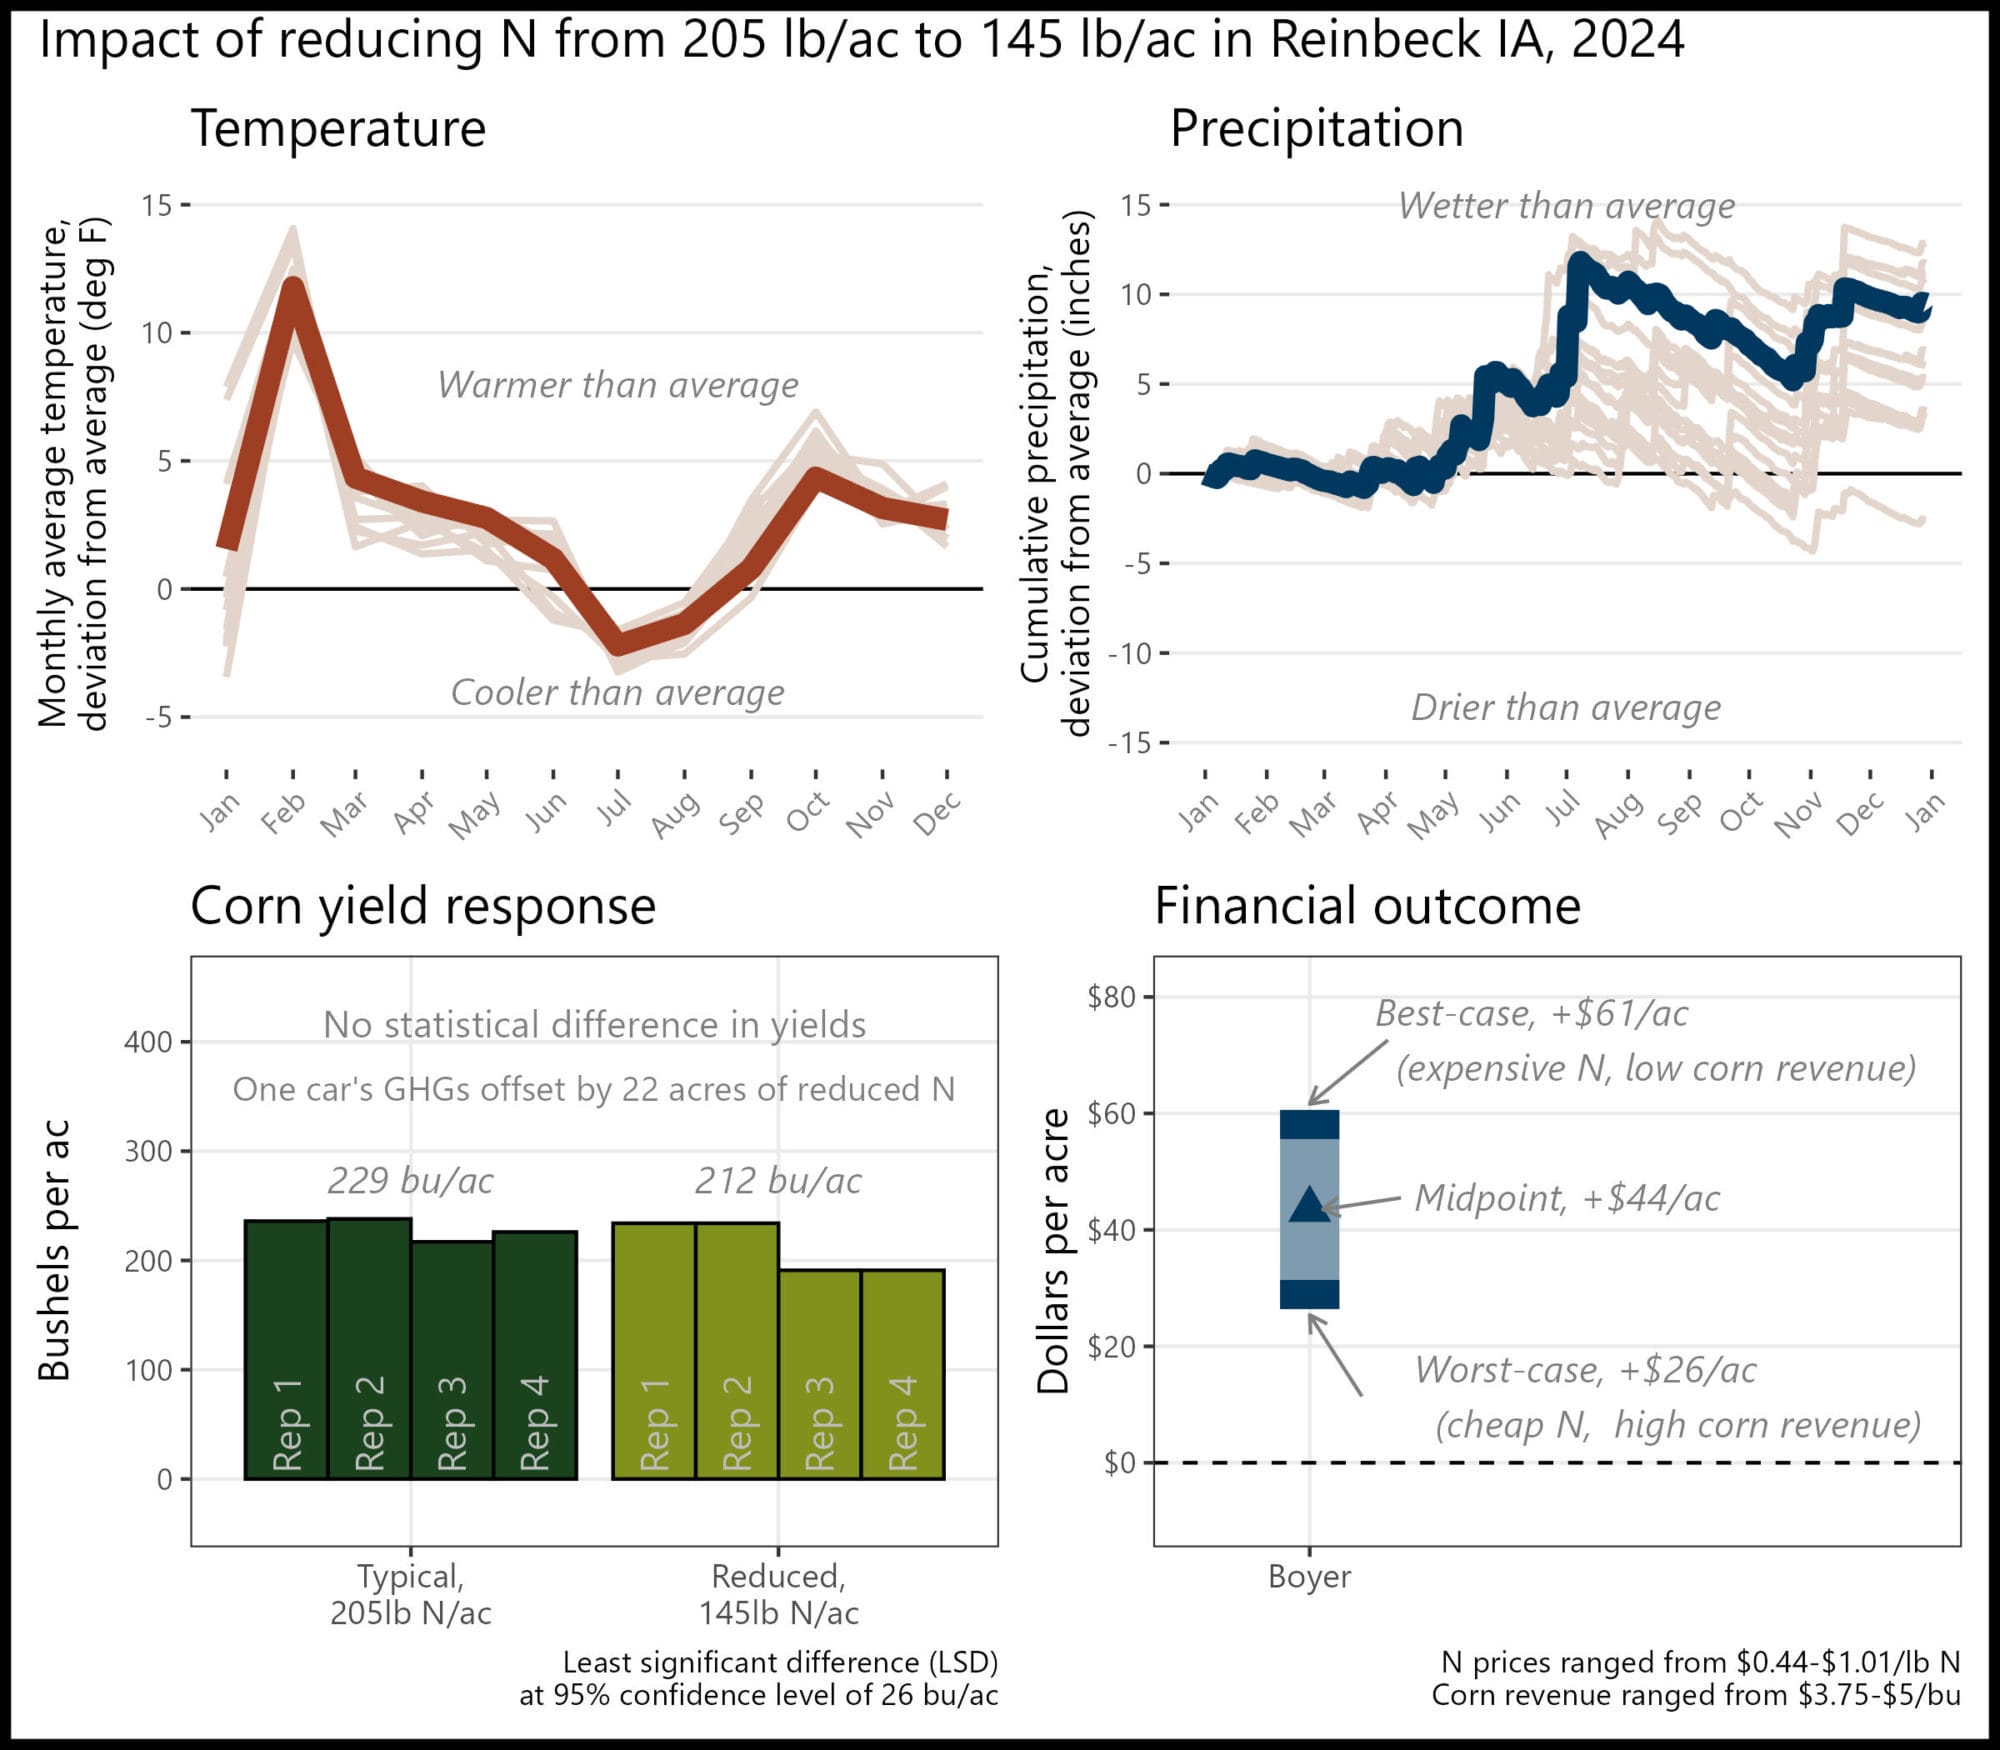
Appendix D. Jack Boyer; Reinbeck, Iowa
“This is confirmation of previous trials that builds a stronger case that N can be reduced.”
The financial outcome at the reduced N rate was likely a financial savings compared to the typical N rate. A 60 lb N/ac reduction saved money this year, and, when applied to at least 22 acres, could offset the average annual GHGs of one vehicle.
Historical cropping system (5 year): No-till soybeans and corn, cereal rye cover crop
Previous crop: Soybeans and cereal rye
Strip size: 0.6 ac
Corn planting date: April 17
Corn row spacing/planting density: 30 in; 34,000 seeds/ac
Nitrogen sources and timing: Chemical; at-plant, sidedress
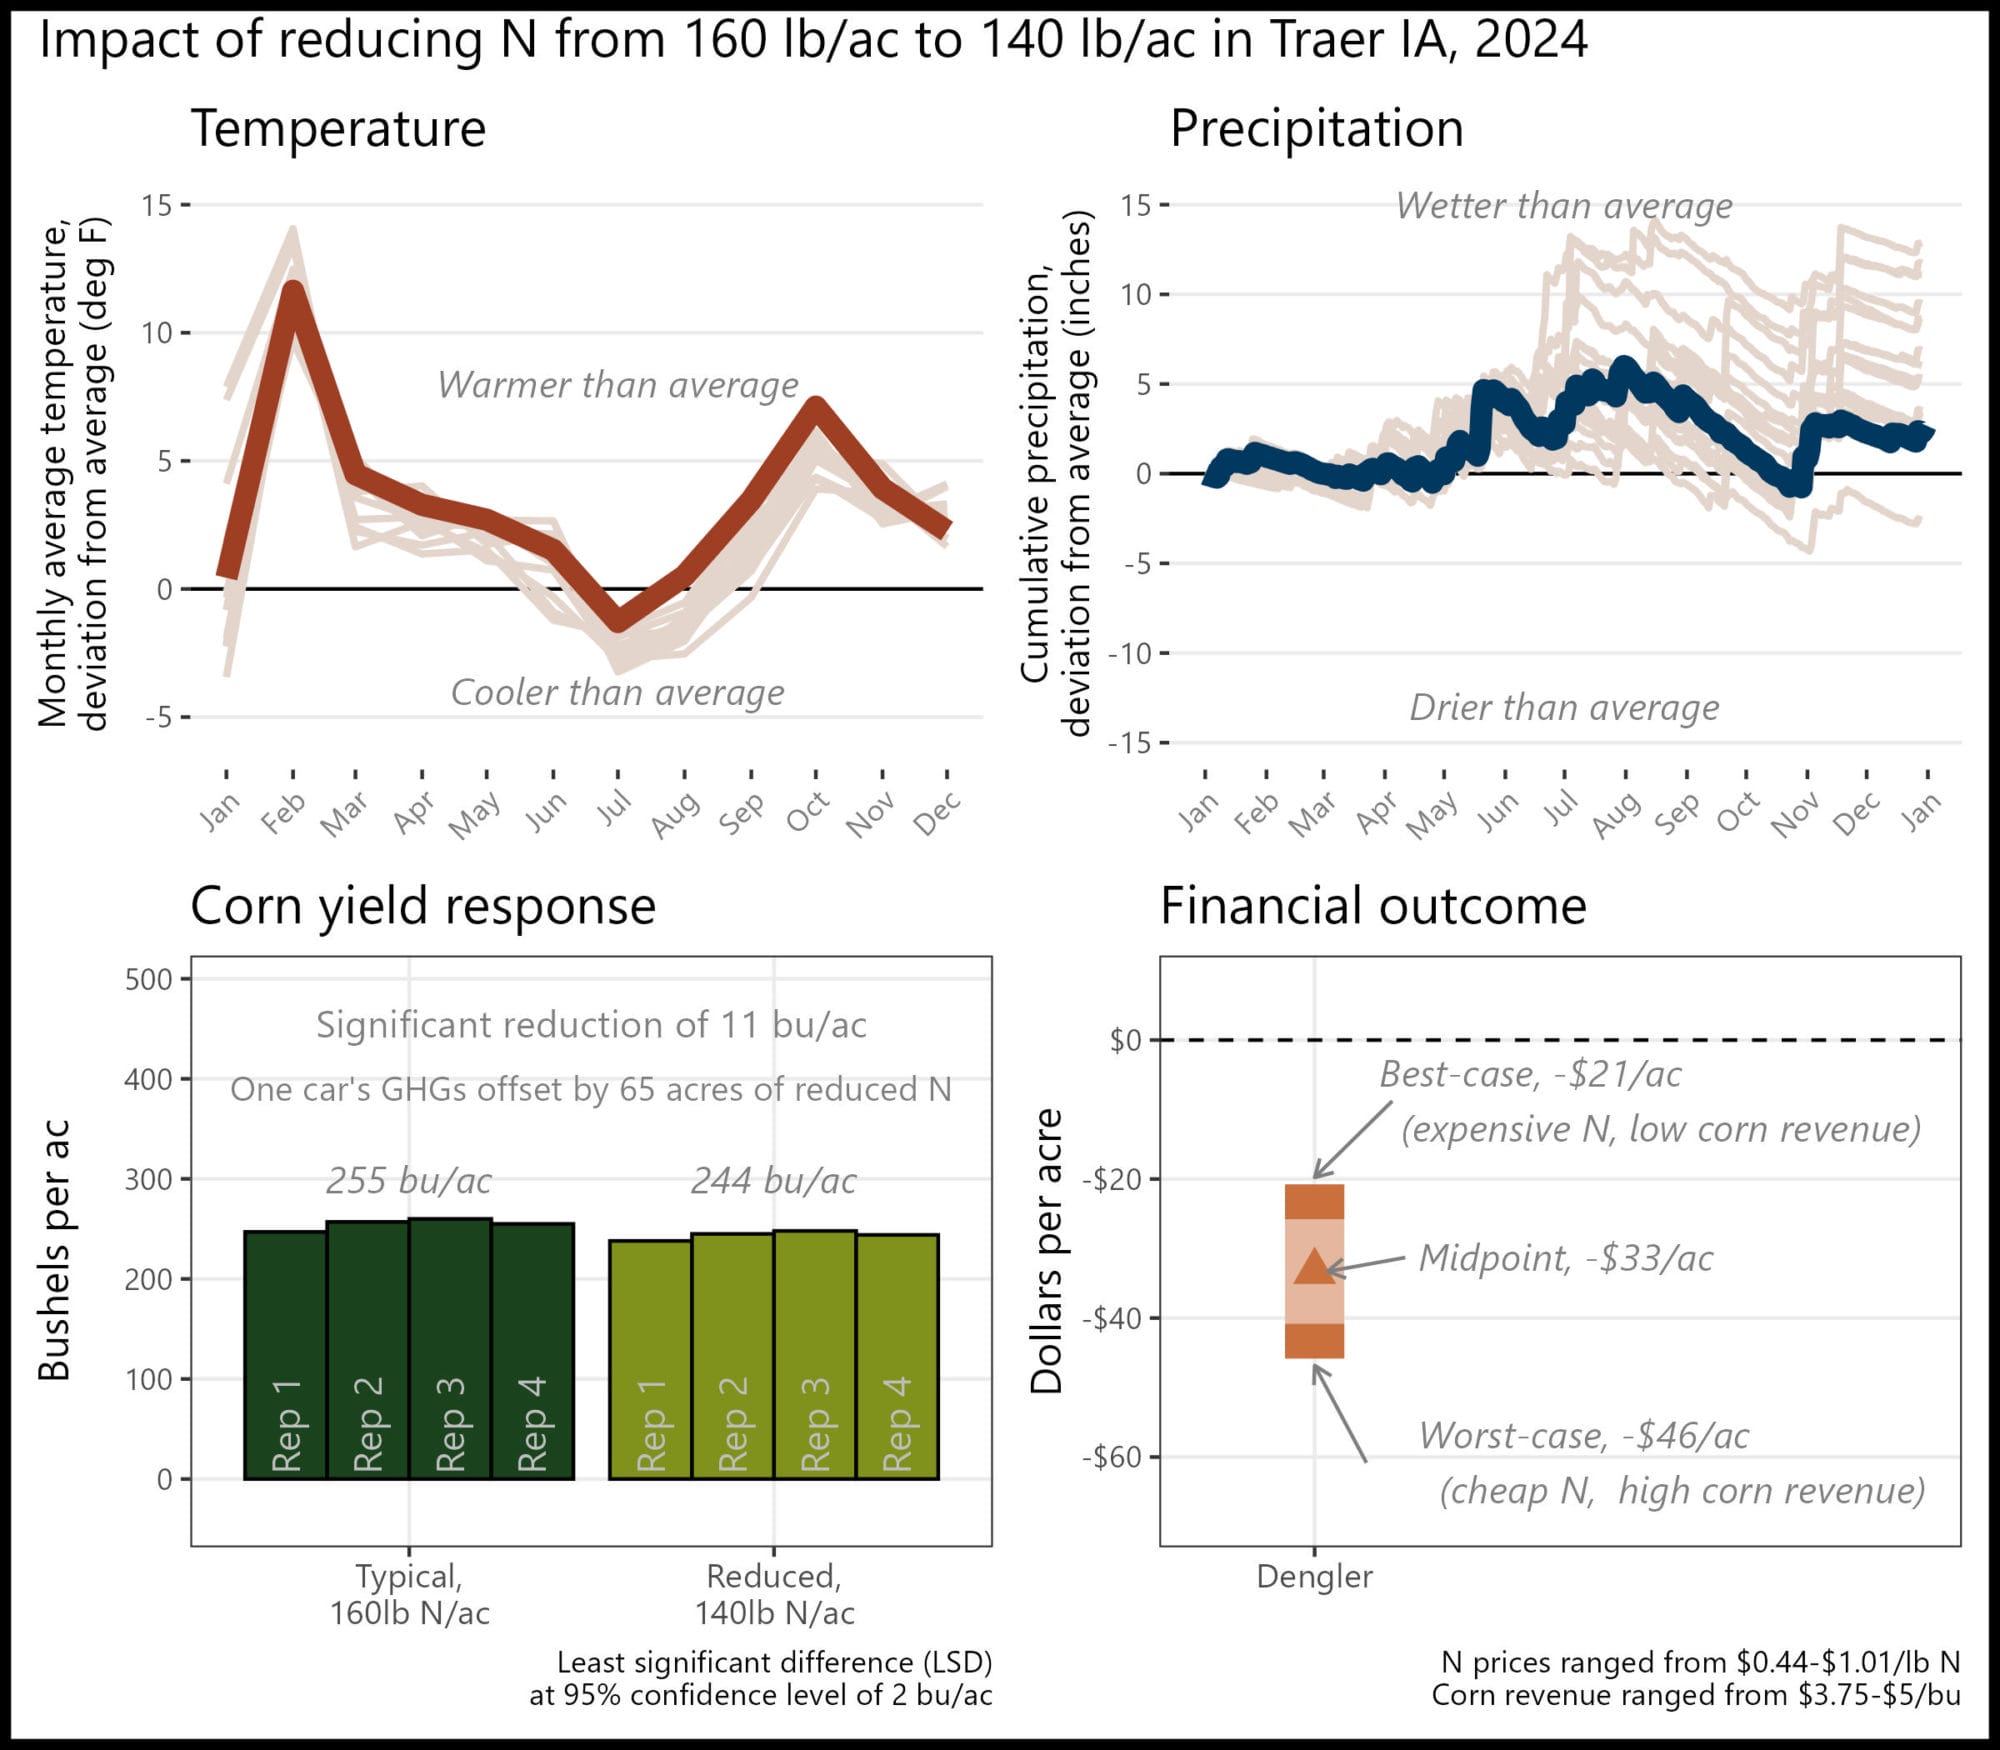
Appendix E. Sean Dengler; Traer, Iowa
“I have done this before, and this year I learned I reduced too much. I was not expecting that.”
The financial outcome at the reduced N rate was likely a financial loss compared to the typical N rate. A 20 lb N/ac reduction was likely too large this year, but there may be potential for financial savings with a smaller N reduction.
Historical cropping system (5 year): Conventional/strip/no-till soybeans and corn, winter wheat and cereal rye cover crops
Previous crop: Soybeans
Strip size: 1.6 ac
Corn planting/harvest date: April 25/October 17
Corn row spacing/planting density: 30 in; 32,000 seeds/ac
Nitrogen sources and timing: Chemical; pre-plant and sidedress
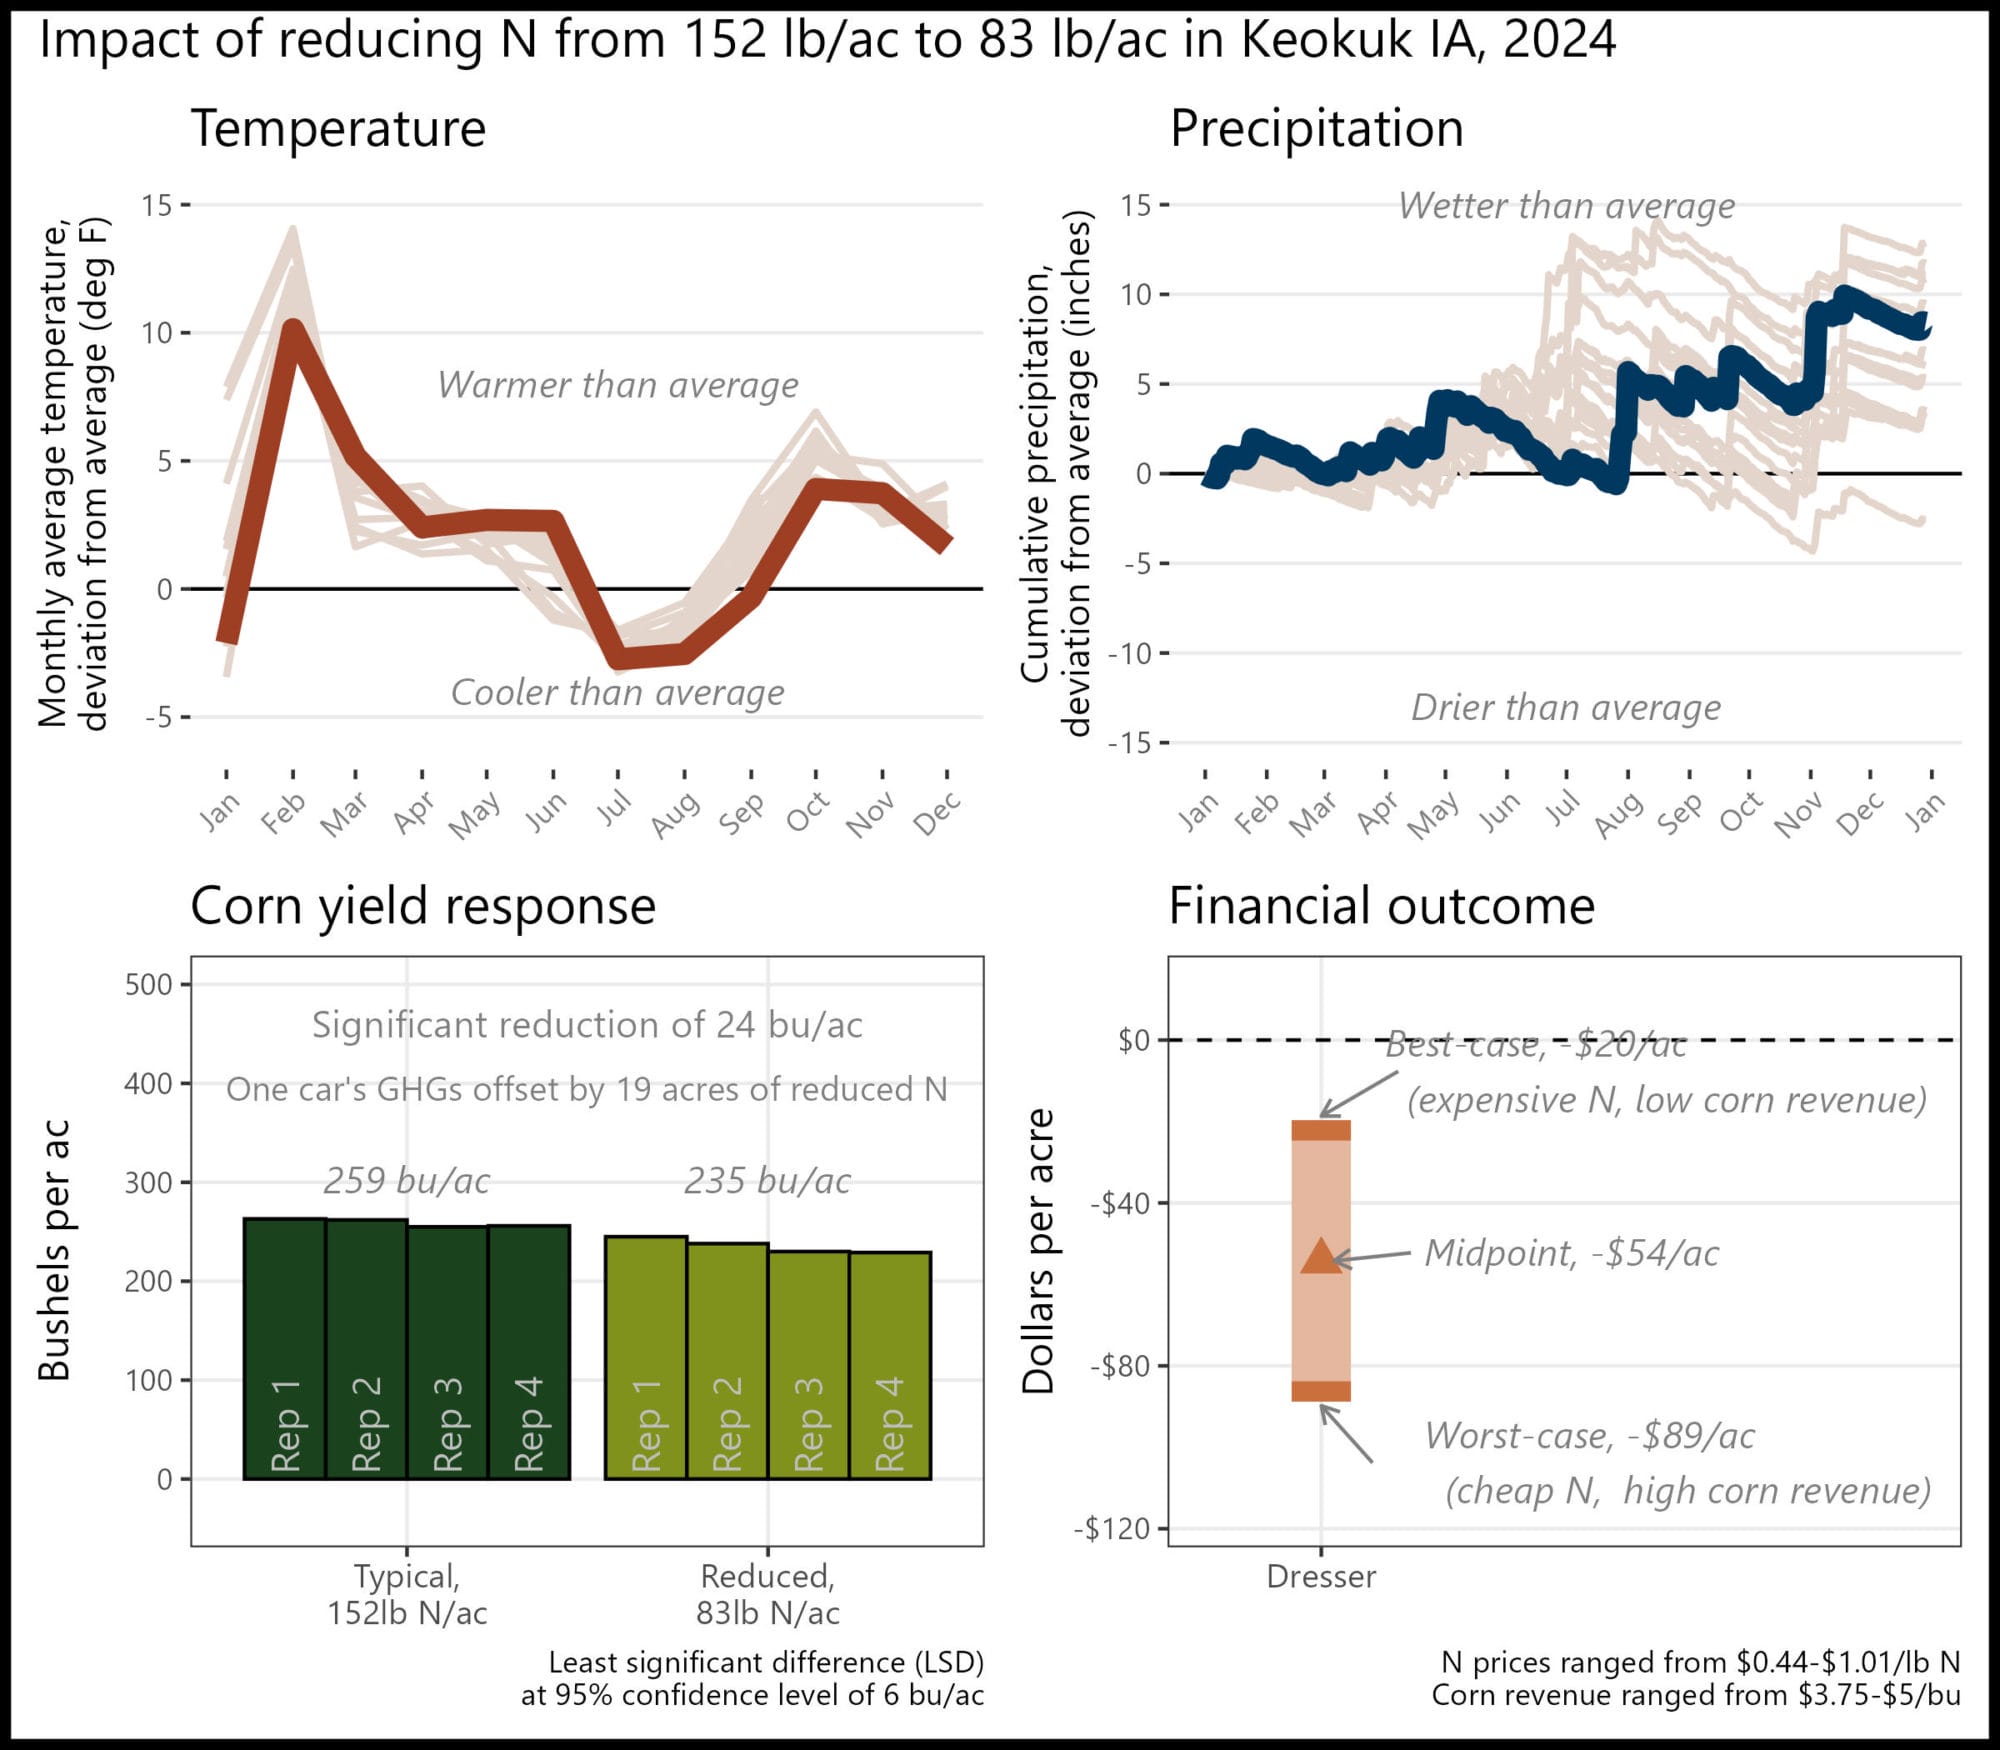
Appendix F. Brent Dresser; Keokuk, Iowa
“I will continue to trial nitrogen at a variety of rates and as my farming practices change along with the years.”
The financial outcome at the reduced N rate was likely a financial loss compared to the typical N rate. A 69 lb N/ac reduction was likely too large this year, but there may be potential for financial savings with a smaller N reduction.
Historical cropping system (5 year): Disk-harrow tillage; corn and soybeans
Previous crop: Soybeans
Strip size: 0.5 ac
Corn planting/harvest date: May 20/November 2
Corn row spacing/planting density: 30 in; 32,000 seeds/ac
Nitrogen sources and timing: Chemical; pre-plant, at-plant, sidedress
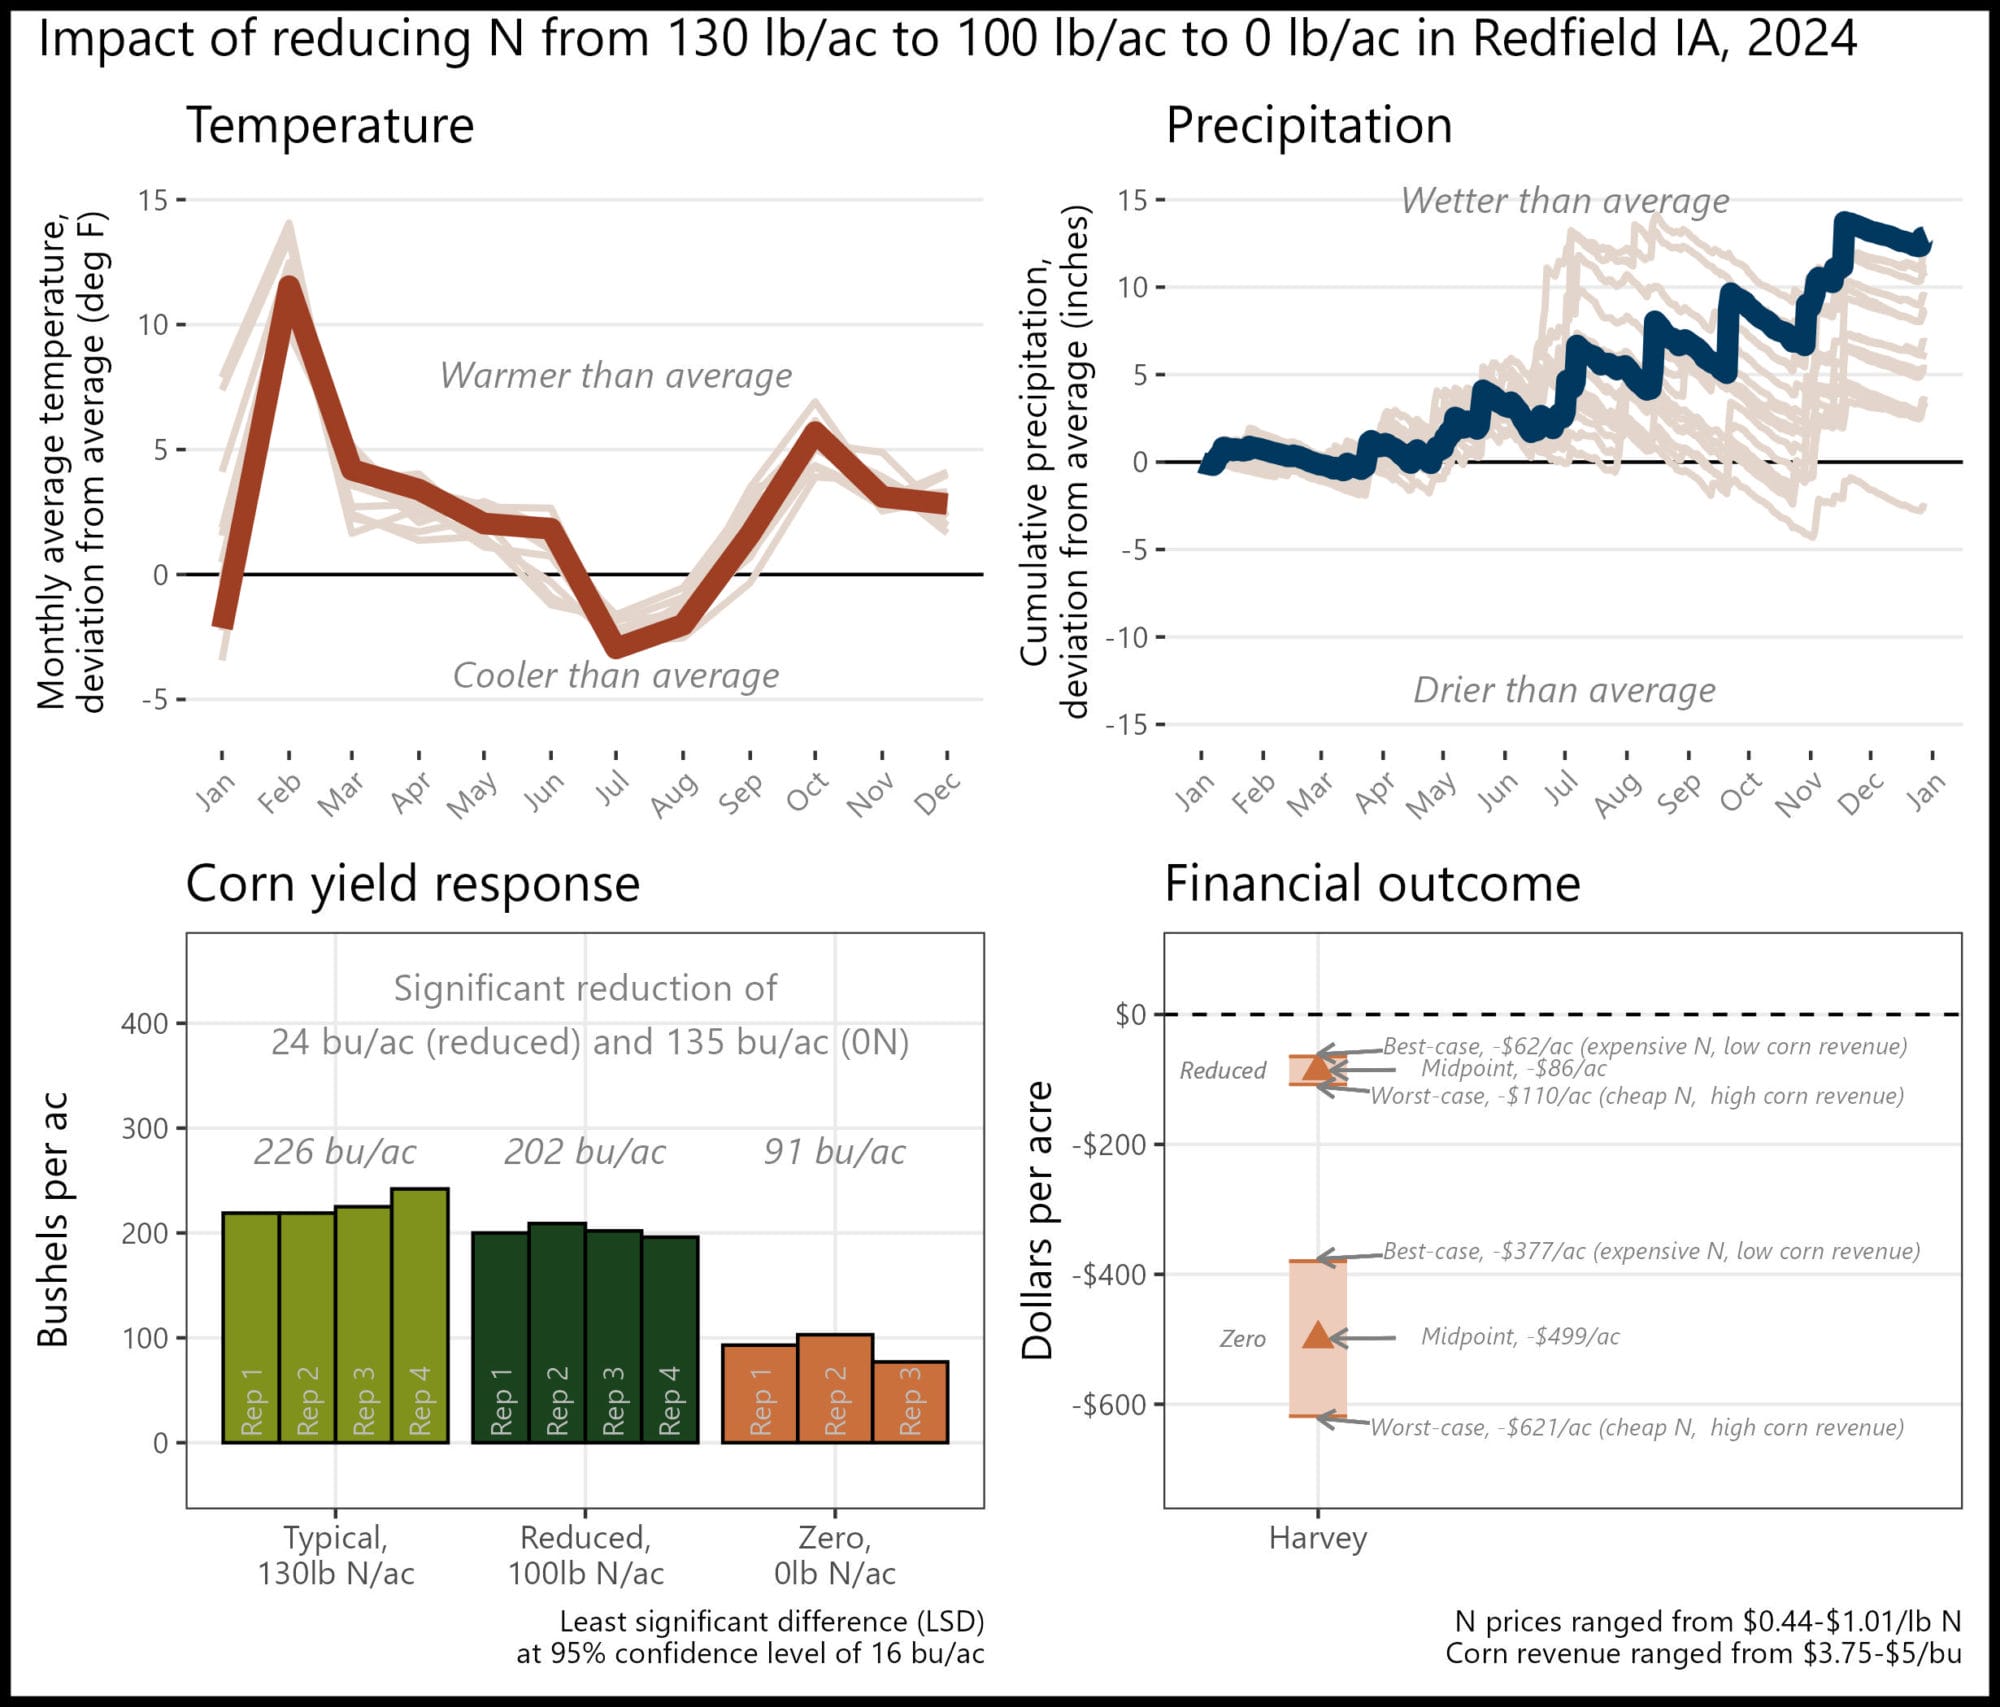
Appendix G. Robert Harvey; Redfield, Iowa
“I’m already on the road to cutting back N rates”
The financial outcome at both the reduced N rate and zero N rate resulted in a financial loss compared to the typical N rate. A reduction of 30 lb N/ac was likely too large this year, but there may be potential financial savings with a smaller N reduction. While considerable yield losses are expected when no nitrogen is applied, the 0N treatment is important for understanding the full impact of nitrogen on yield and profitability.
Historical cropping system (5 year): No-till corn and soybeans; cereal rye cover crop
Previous crop: Soybeans and cereal rye
Strip size: 0.6 ac
Corn planting/harvest date: April 24/October 14
Corn row spacing/planting density: 30 in; 31,000 seeds/ac
Nitrogen sources and timing: Chemical; sidedress
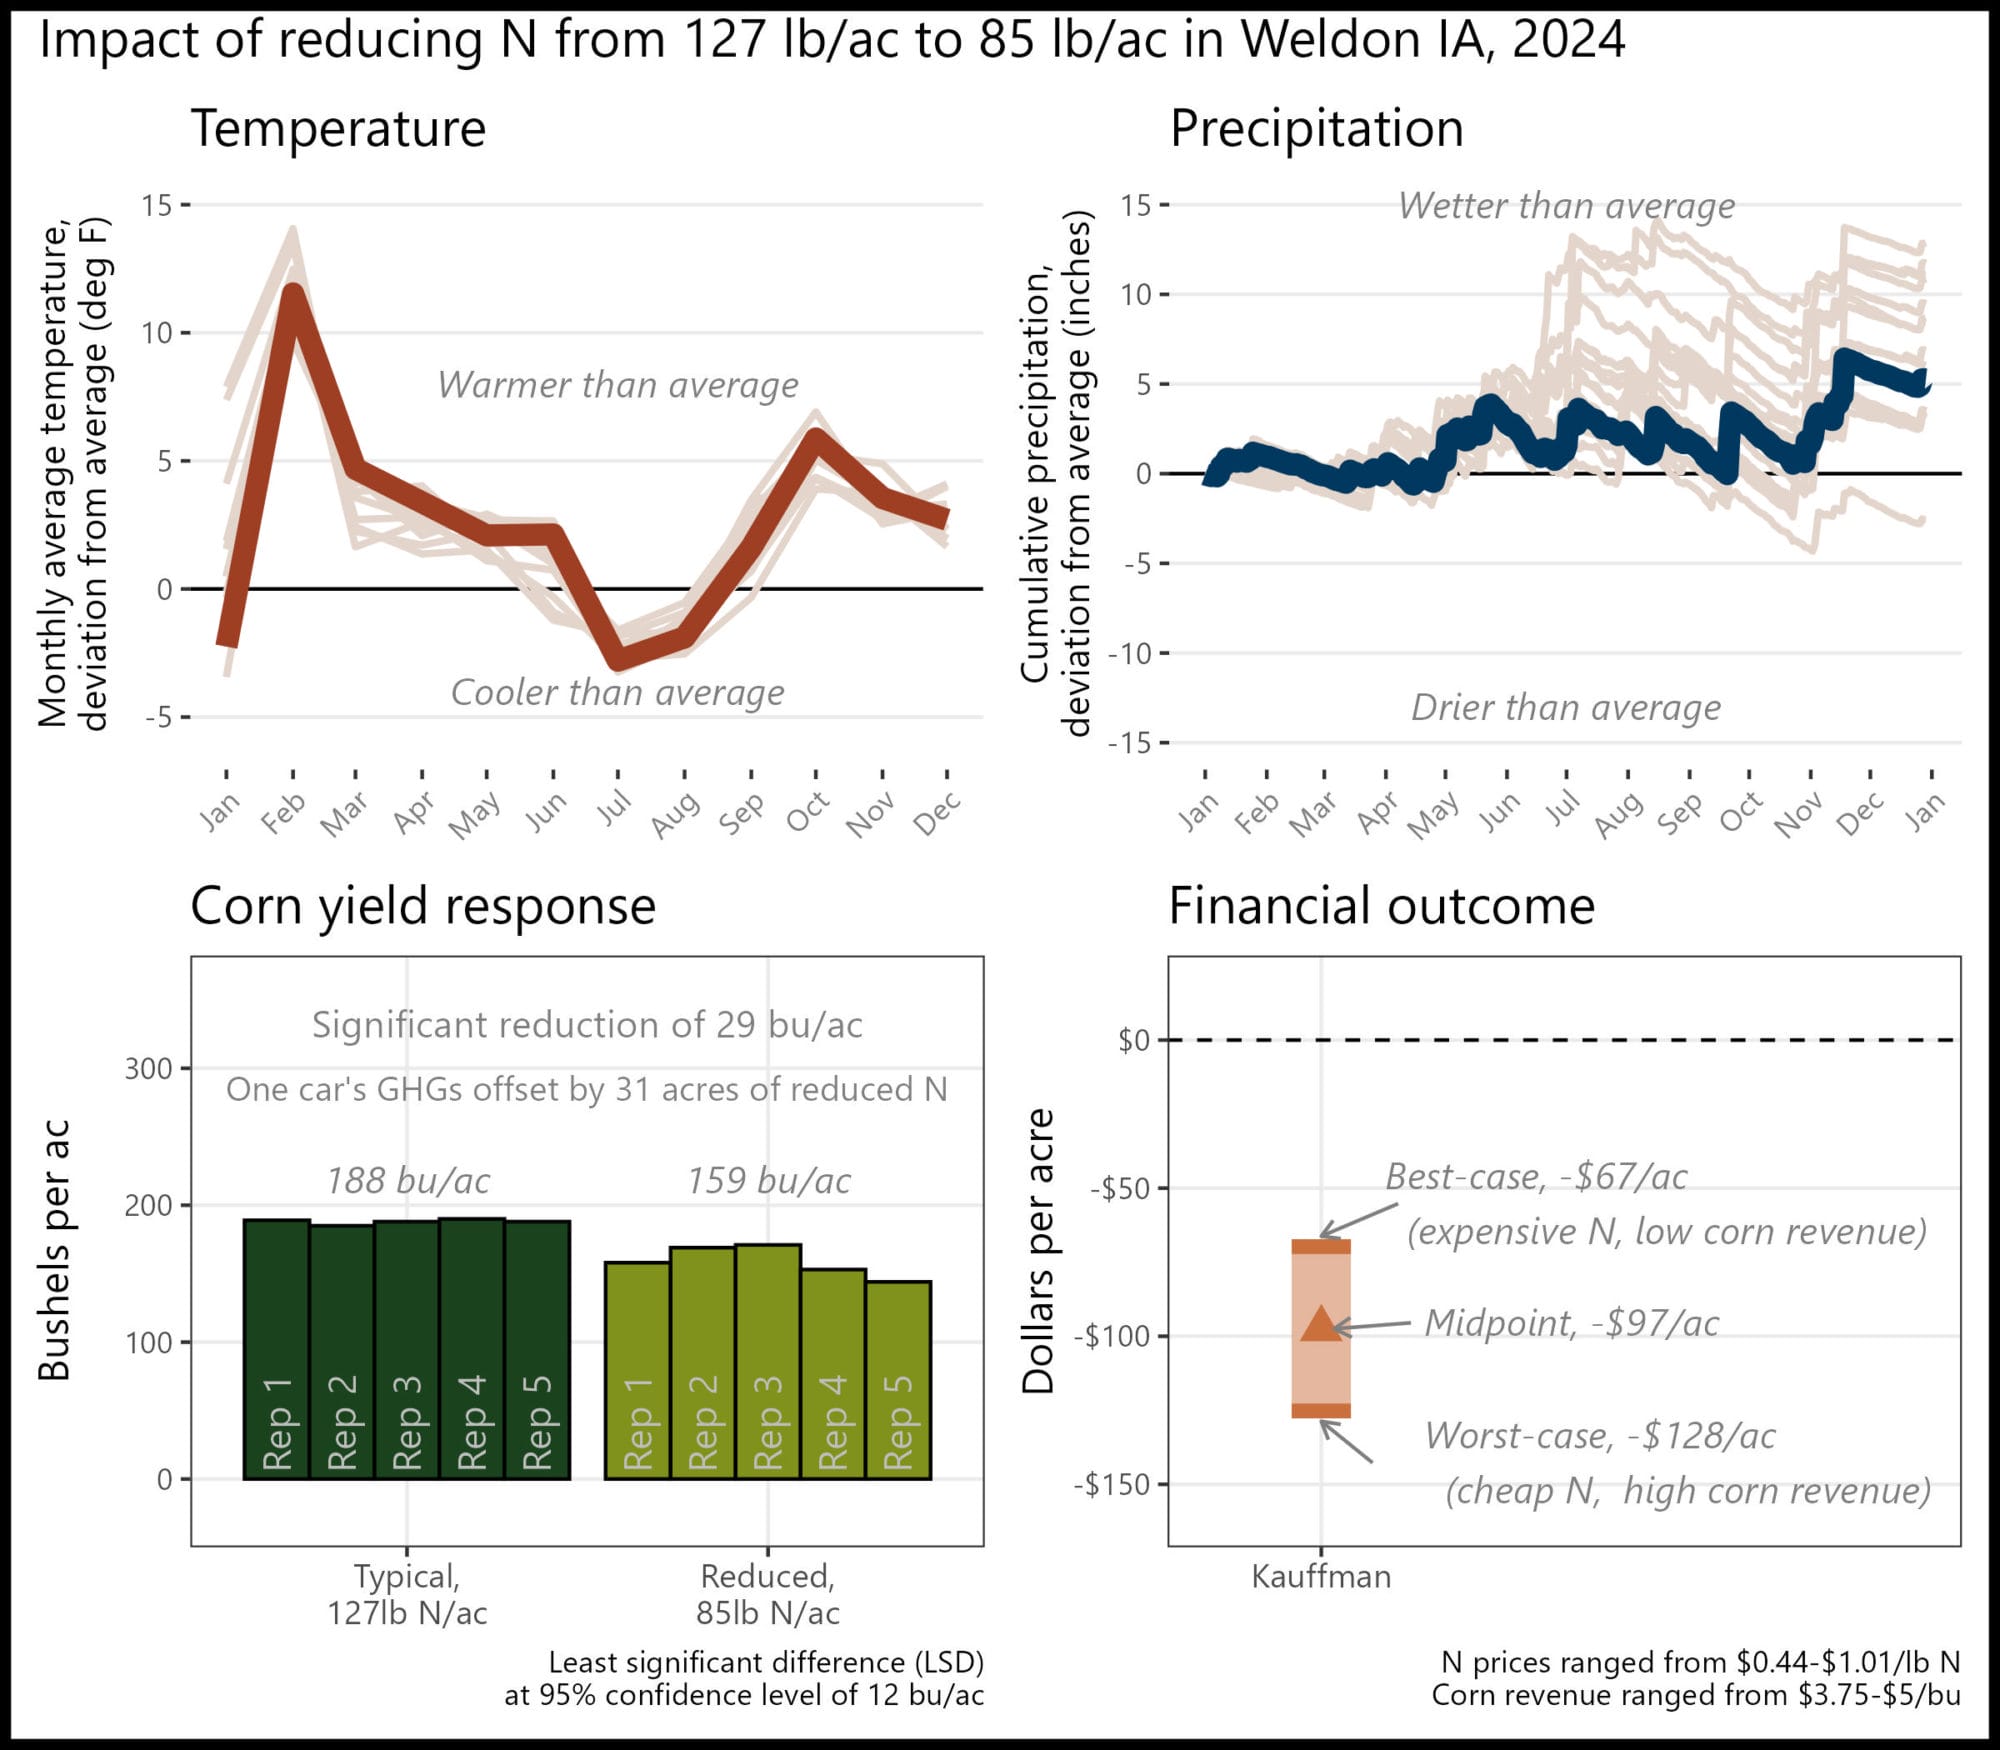
Appendix H. Arlyn Kauffman; Weldon, Iowa
“I am already going down this path to 0 synthetic fertilizer. This is just a solid step in the right direction”
The financial outcome at the reduced N rate was likely a financial loss compared to the typical N rate. A 42 lb N/ac reduction was likely too large this year, but there may be potential for financial savings with a smaller N reduction.
Historical cropping system (5 year): No-till corn, soybeans, clover, wheat, oats, and cereal rye cover crops, grazing
Previous crop: Oats/clover
Corn planting/harvest date: May 30/October 16
Corn row spacing/planting density: 30 in; 30,500 seeds/ac
Nitrogen sources and timing: Organic and chemical; pre-plant, at-plant
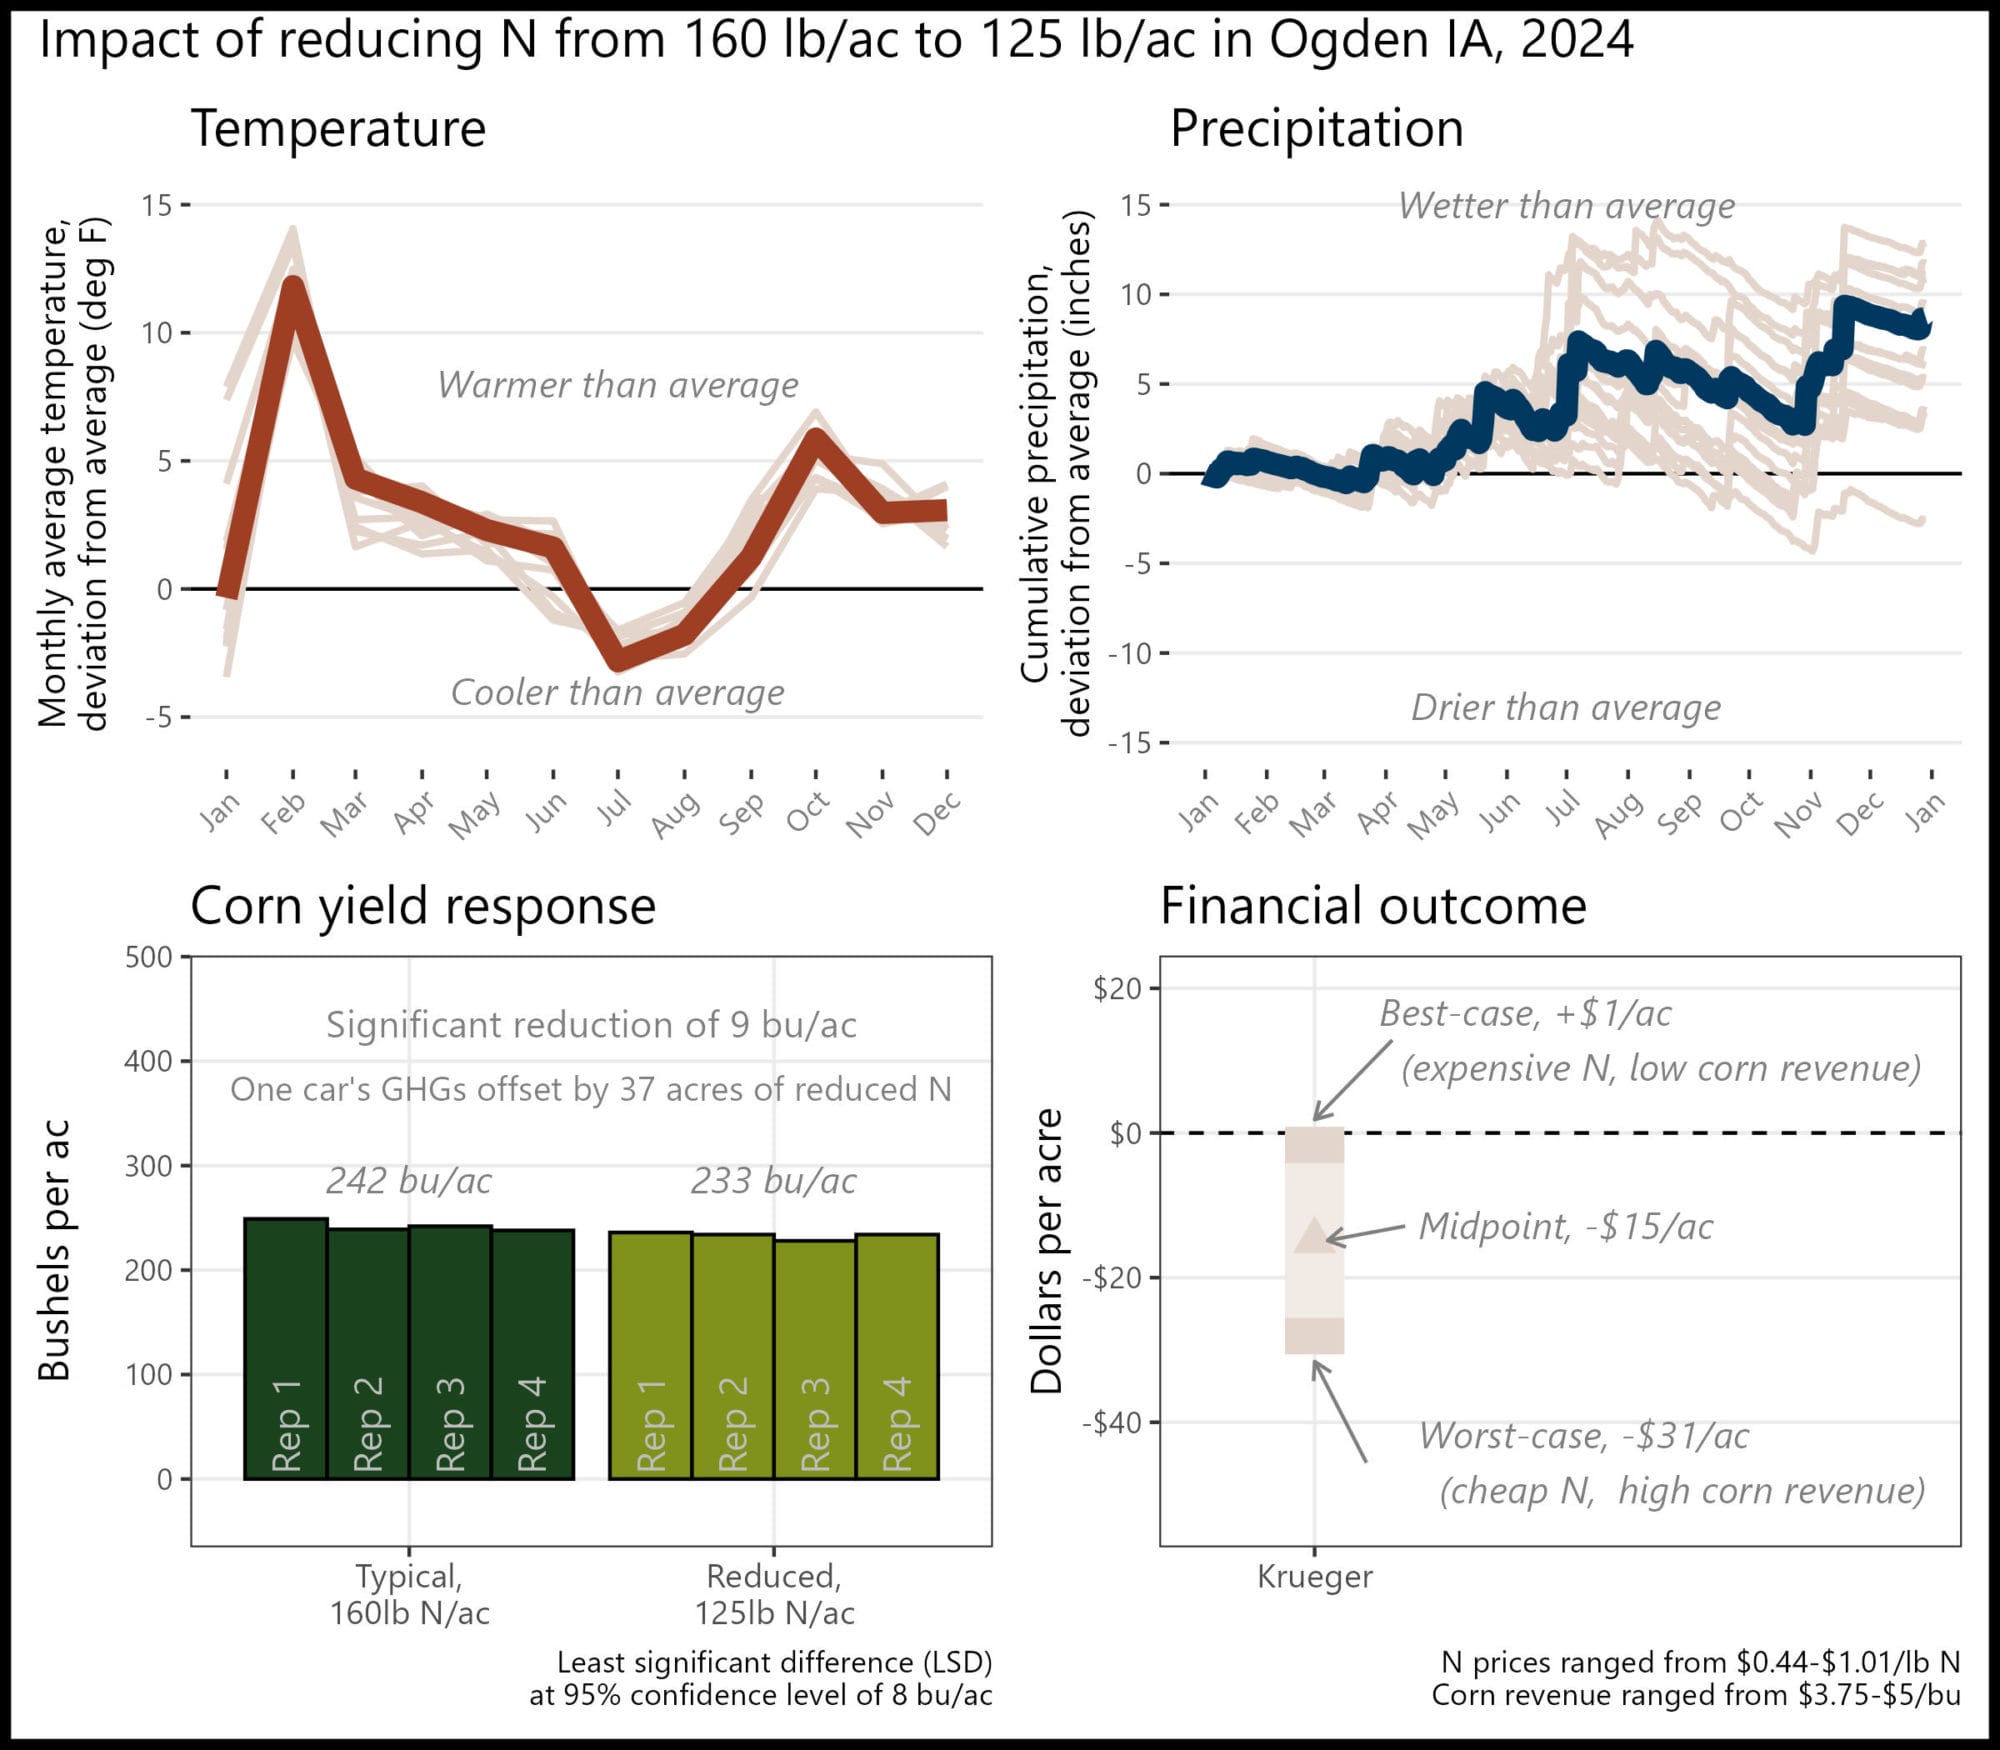
Appendix I. Keaton Krueger; Ogden, Iowa
“Nitrogen is hard to assess the actual need. Two different years showing the same results helps to build confidence.”
The financial outcome at the reduced N rate was likely a financial loss compared to the typical N rate. A 35 lb N/ac reduction was likely too large this year, but there may be potential for financial savings with a smaller N reduction.
Historical cropping system (5 year): Conventional/strip/no-till; corn, soybeans, cereal rye, triticale, oats, and camelina cover crops
Previous crop: Soybeans and triticale/oats/camelina
Strip size: 0.9 ac
Corn planting/harvest date: April 24/October 10
Corn row spacing/planting density: 30 in; 34,500 seeds/ac
Nitrogen sources and timing: Chemical; pre-plant, sidedress
Appendix J. Ross McCaw; Marengo, Iowa
“I’m getting a better idea of what my operation fertility needs. I’m finding that it isn’t just soil type but the organic matter as well.”
The financial outcome at the reduced N rate in the three fields was likely a financial loss compared to the typical N rate. Reductions of 46 and 62 lb N/ac were likely too large this year, but there may be potential for financial savings with a smaller N reduction.
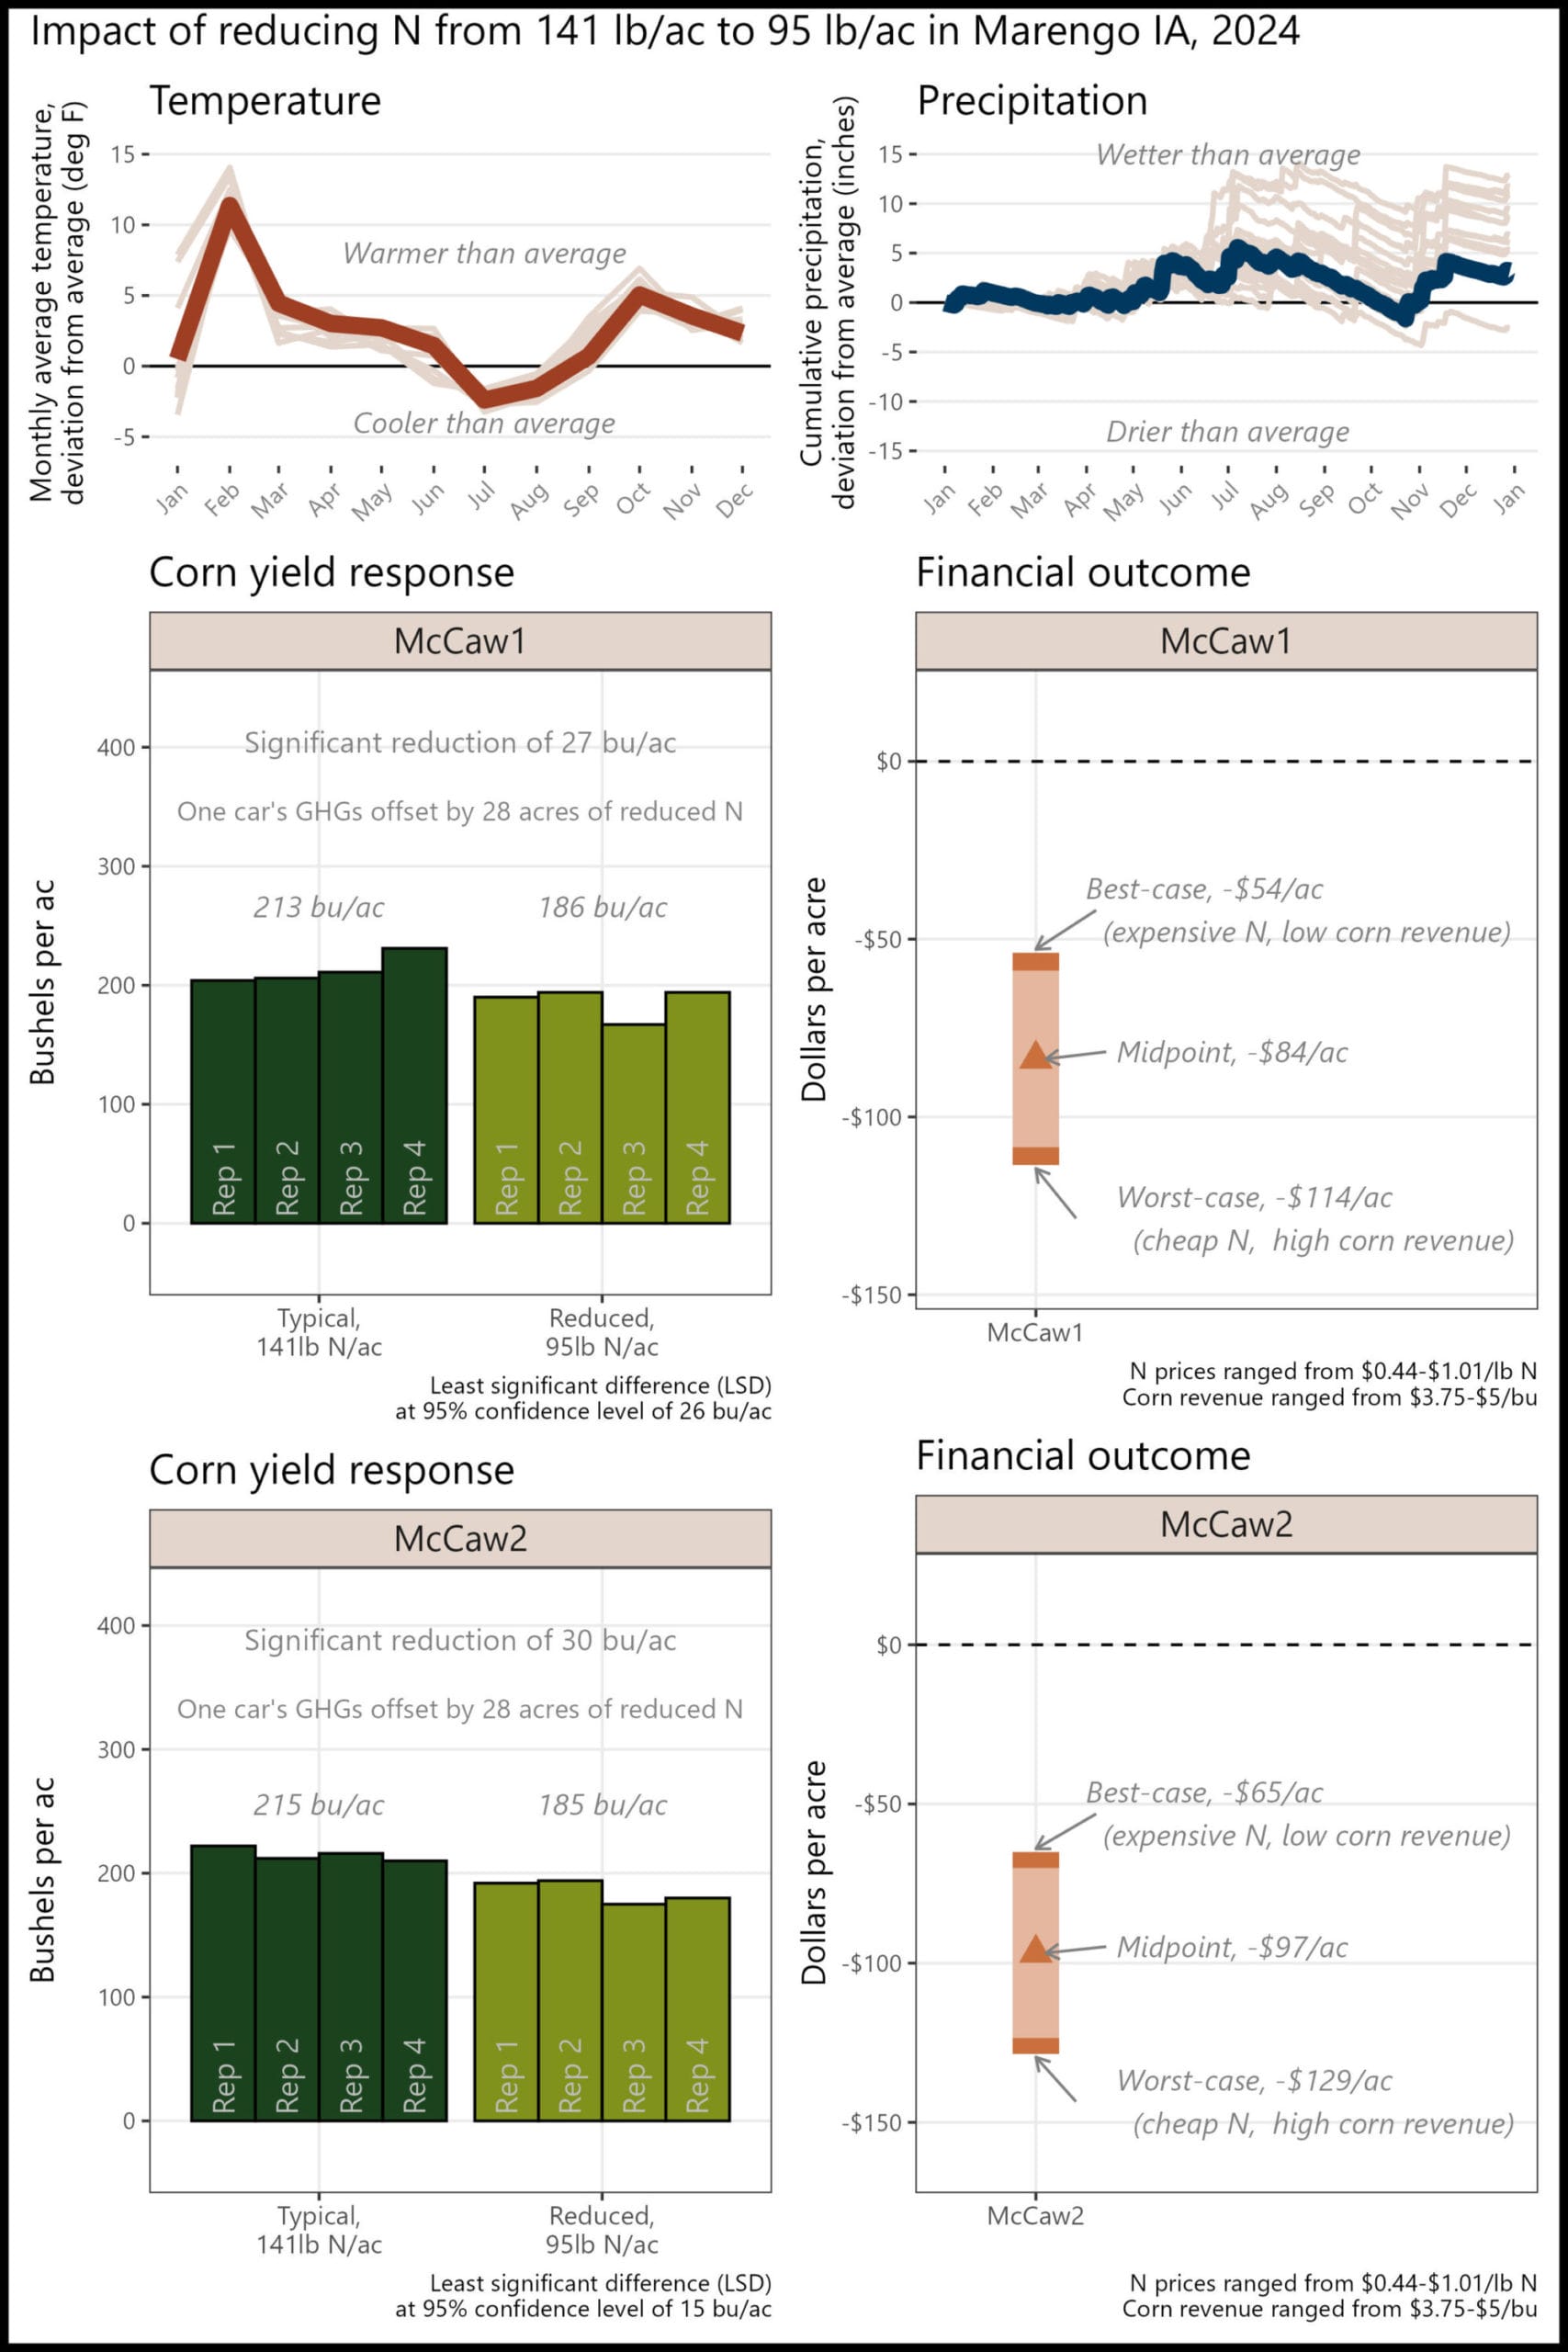
Fields 1 and 2
Historical cropping system (5 year): No-till corn and soybeans; cereal rye cover crop
Previous crop: Soybeans and cereal rye
Strip size: 0.3 ac
Corn planting/harvest date: May 17/October 23
Corn row spacing/planting density: 30 in; 35,000 seeds/ac
Nitrogen sources and timing: Chemical; at-plant, sidedress
Appendix K. Ross McCaw; Marengo, Iowa
The financial outcome at the reduced N rate in the three fields was likely a financial loss compared to the typical N rate. Reductions of 62 and 55 lb N/ac were likely too large this year, but there may be potential for financial savings with a smaller N reduction.
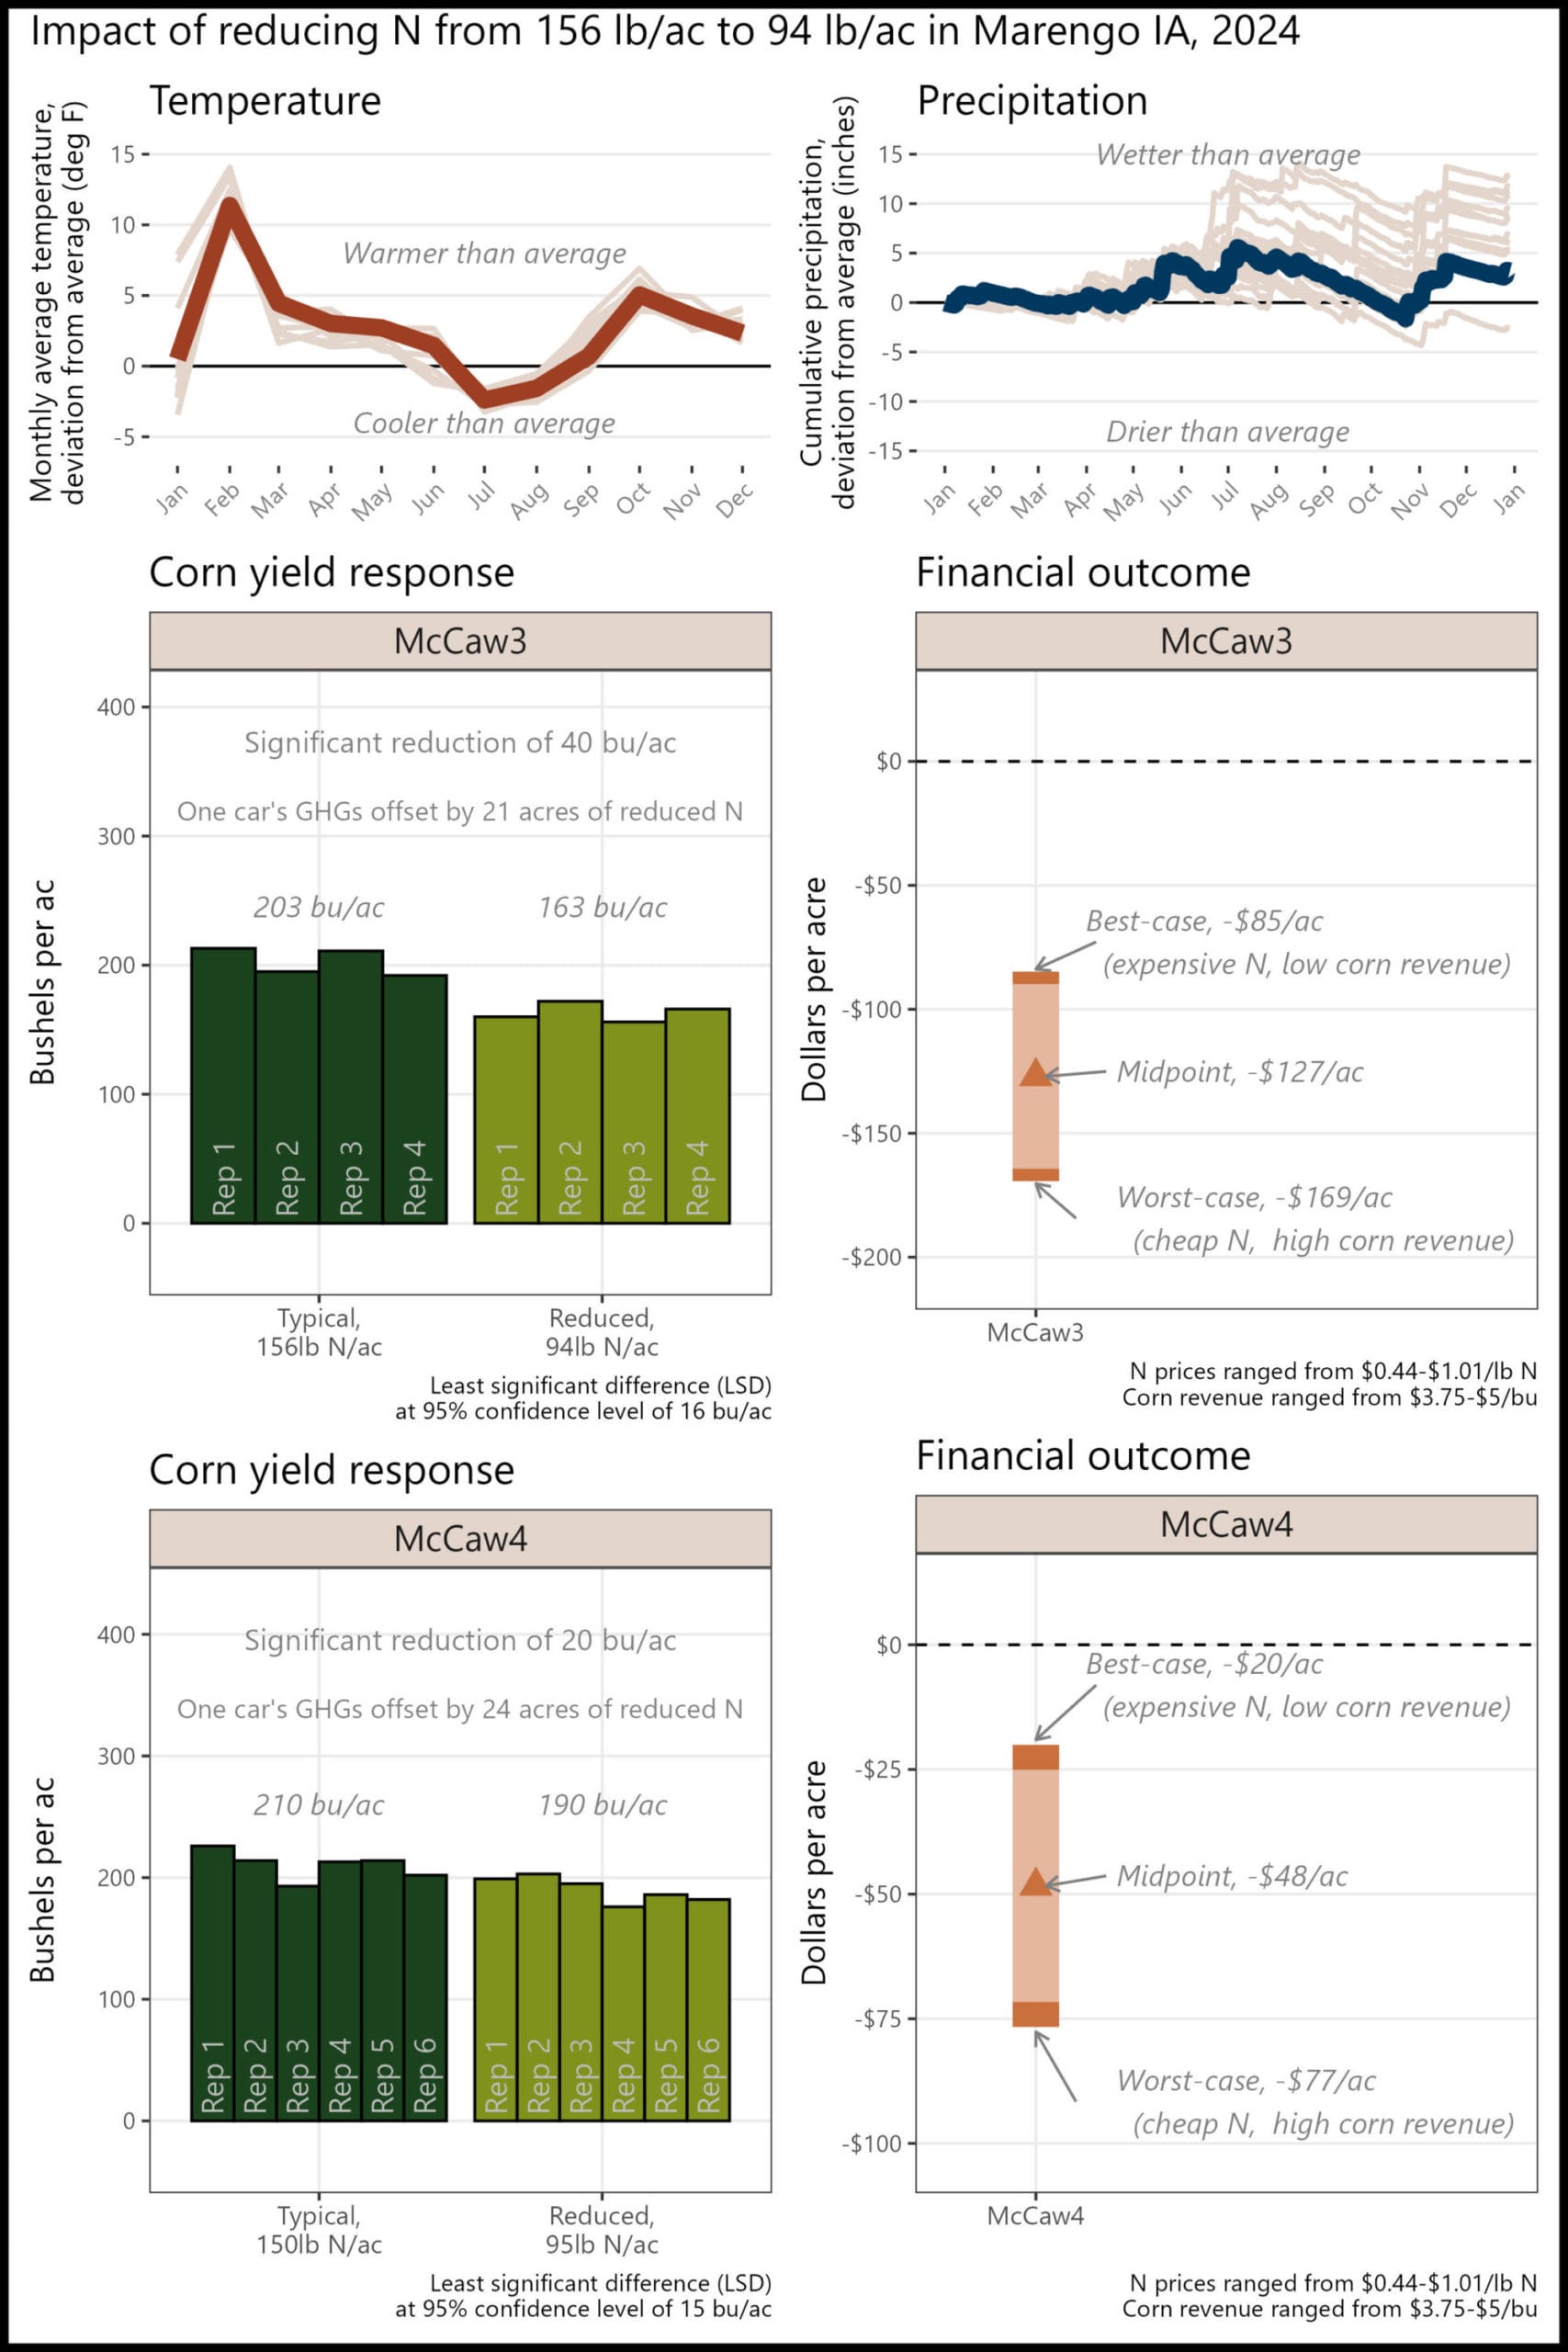
Field 3
Historical cropping system (5 year): No-till corn and soybeans, cereal rye and cover crop mixes, manure applications, grazing
Previous crop: Corn and cereal rye
Corn planting/harvest date: May 18/October 1
Corn row spacing/planting density: 30 in; 35,000 seeds/ac
Nitrogen sources and timing: Chemical; at-plant, sidedress
Field 4
Historical cropping system (5 year): No-till corn and soybeans, cereal rye and cover crop mixes, manure application
Previous crop: Cereal rye
Corn planting/harvest date: May 16/October 24
Corn row spacing/planting density: 30 in; 35,000 seeds/ac
Nitrogen sources and timing: Chemical; at-plant, sidedress
Appendix L. Lucas Olen; Mora, Minnesota
“I will continue to adjust fertilizer rates.”
The financial outcome at the reduced N rate was likely a financial loss compared to the typical N rate. A 15 lb N/ac reduction was likely too large this year, but there may be potential for financial savings with a smaller N reduction.

Historical cropping system (5 year): No-till corn and soybeans
Previous crop: Soybeans
Corn planting/harvest date: May 17/October 30
Corn row spacing/planting density: 30 in; 31,000 seeds/ac
Nitrogen sources and timing: Chemical; fall, at-plant, sidedress
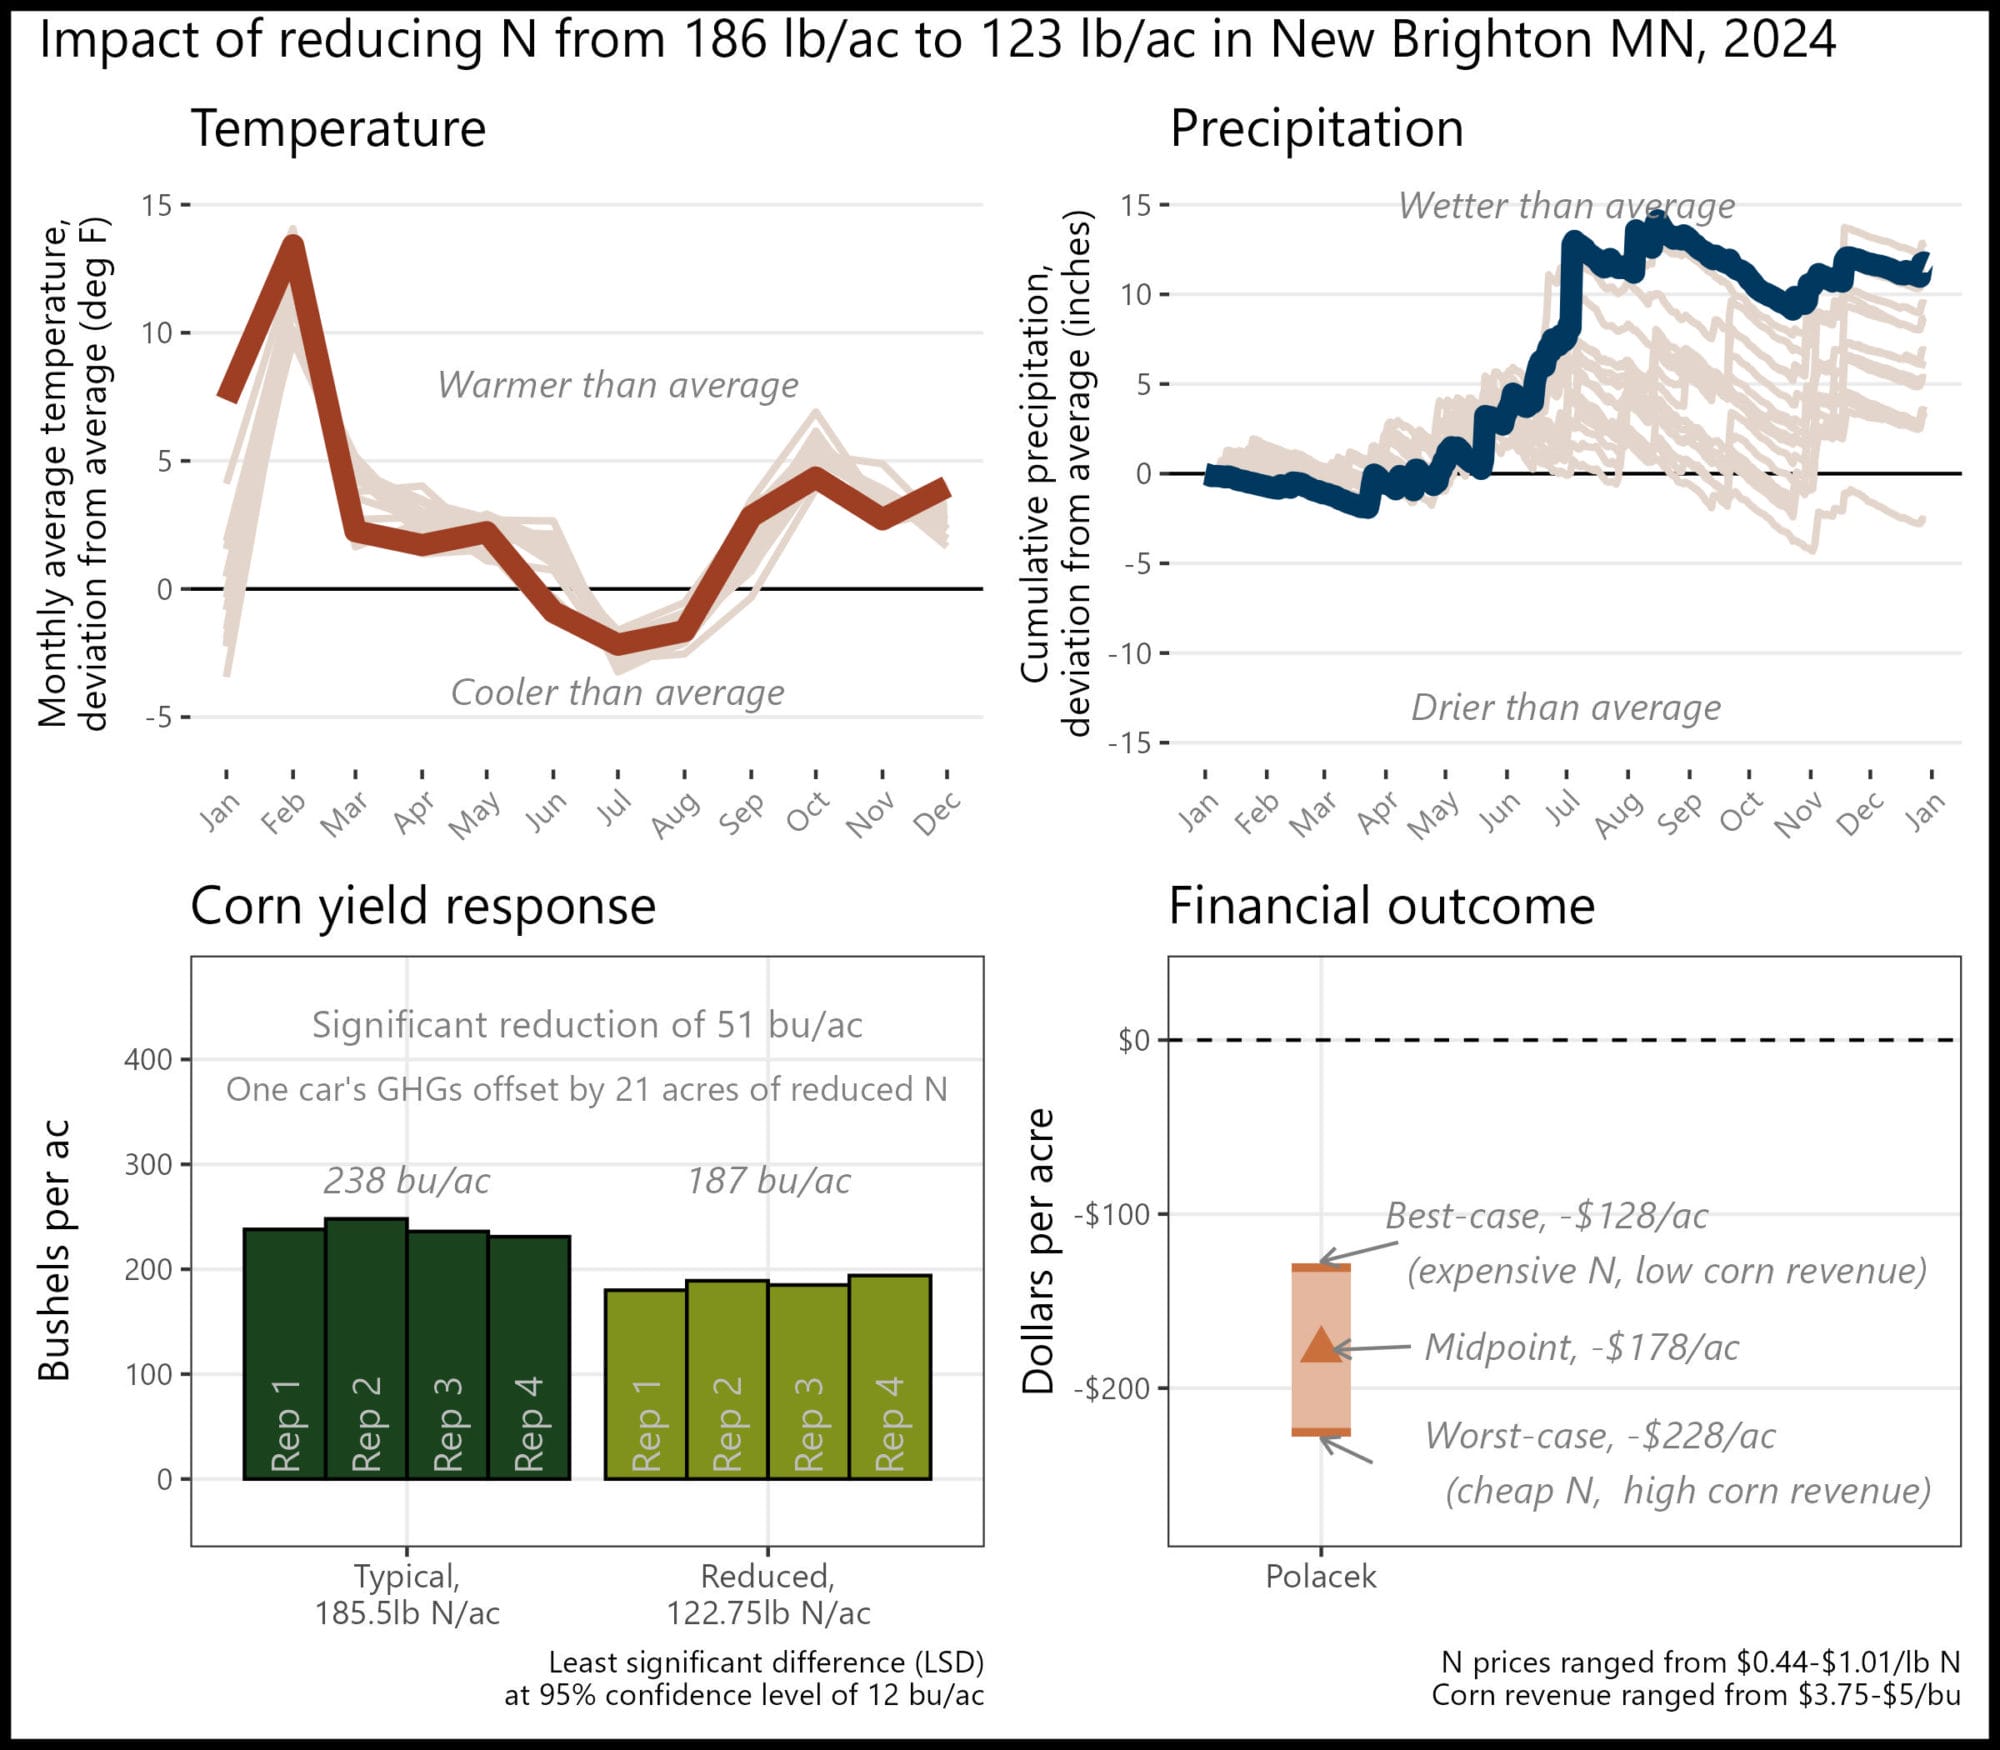
Appendix M. Tom Polacek; New Brighton, Minnesota
“The most valuable aspect of conducting this trial is being part of a group running the same trial. It helps corroborate the findings.”
The financial outcome at the reduced N rate was likely a financial loss compared to the typical N rate. A 63 lb N/ac reduction was likely too large this year, but there may be potential for financial savings with a smaller N reduction.
Historical cropping system (5 year): Strip/no-till corn and soybeans; cover crop mixes
Previous crop: Soybeans and rye, triticale and camelina
Strip size: 1.2 ac
Corn planting/harvest date: April 22/October 17
Corn row spacing/planting density: 30 in; 35,100 seeds/ac
Nitrogen sources and timing: Chemical; fall, at-plant, sidedress
Appendix N. Kevin Prevo; Bloomfield, Iowa
The financial outcome at the reduced N rate was likely a financial loss compared to the typical N rate. A 40 lb N/ac reduction was likely too large this year, but there may be potential for financial savings with a smaller N reduction.
Historical cropping system (5 year): No-till corn and soybeans, wheat, cereal rye and cover crop mixes, manure application, and fall grazing
Previous crop: Soybeans and wheat
Strip size: 0.9 ac
Corn planting/harvest date: April 11/October 21
Corn row spacing/planting density: 30 in; 32,000 seeds/ac
Nitrogen sources and timing: Organic and Chemical; fall, sidedress
Appendix O. Don Putz; Cedar Falls, Iowa
“We will be running this same scenario for at least two more years to get a clearer picture of the results.”
The financial outcome at the reduced N rate was likely a financial loss compared to the typical N rate. A 40 lb N/ac reduction was likely too large this year, but there may be potential for financial savings with a smaller N reduction.
Historical cropping system (5 year): No-till corn and soybeans; camelina and cereal rye cover crops
Previous crop: 50/50 corn-soybeans, camelina and rye
Corn planting/harvest date: April 24/October 16
Corn row spacing/planting density: 30 in; 33,000 seeds/ac
Nitrogen sources and timing: Chemical; pre-plant, sidedress
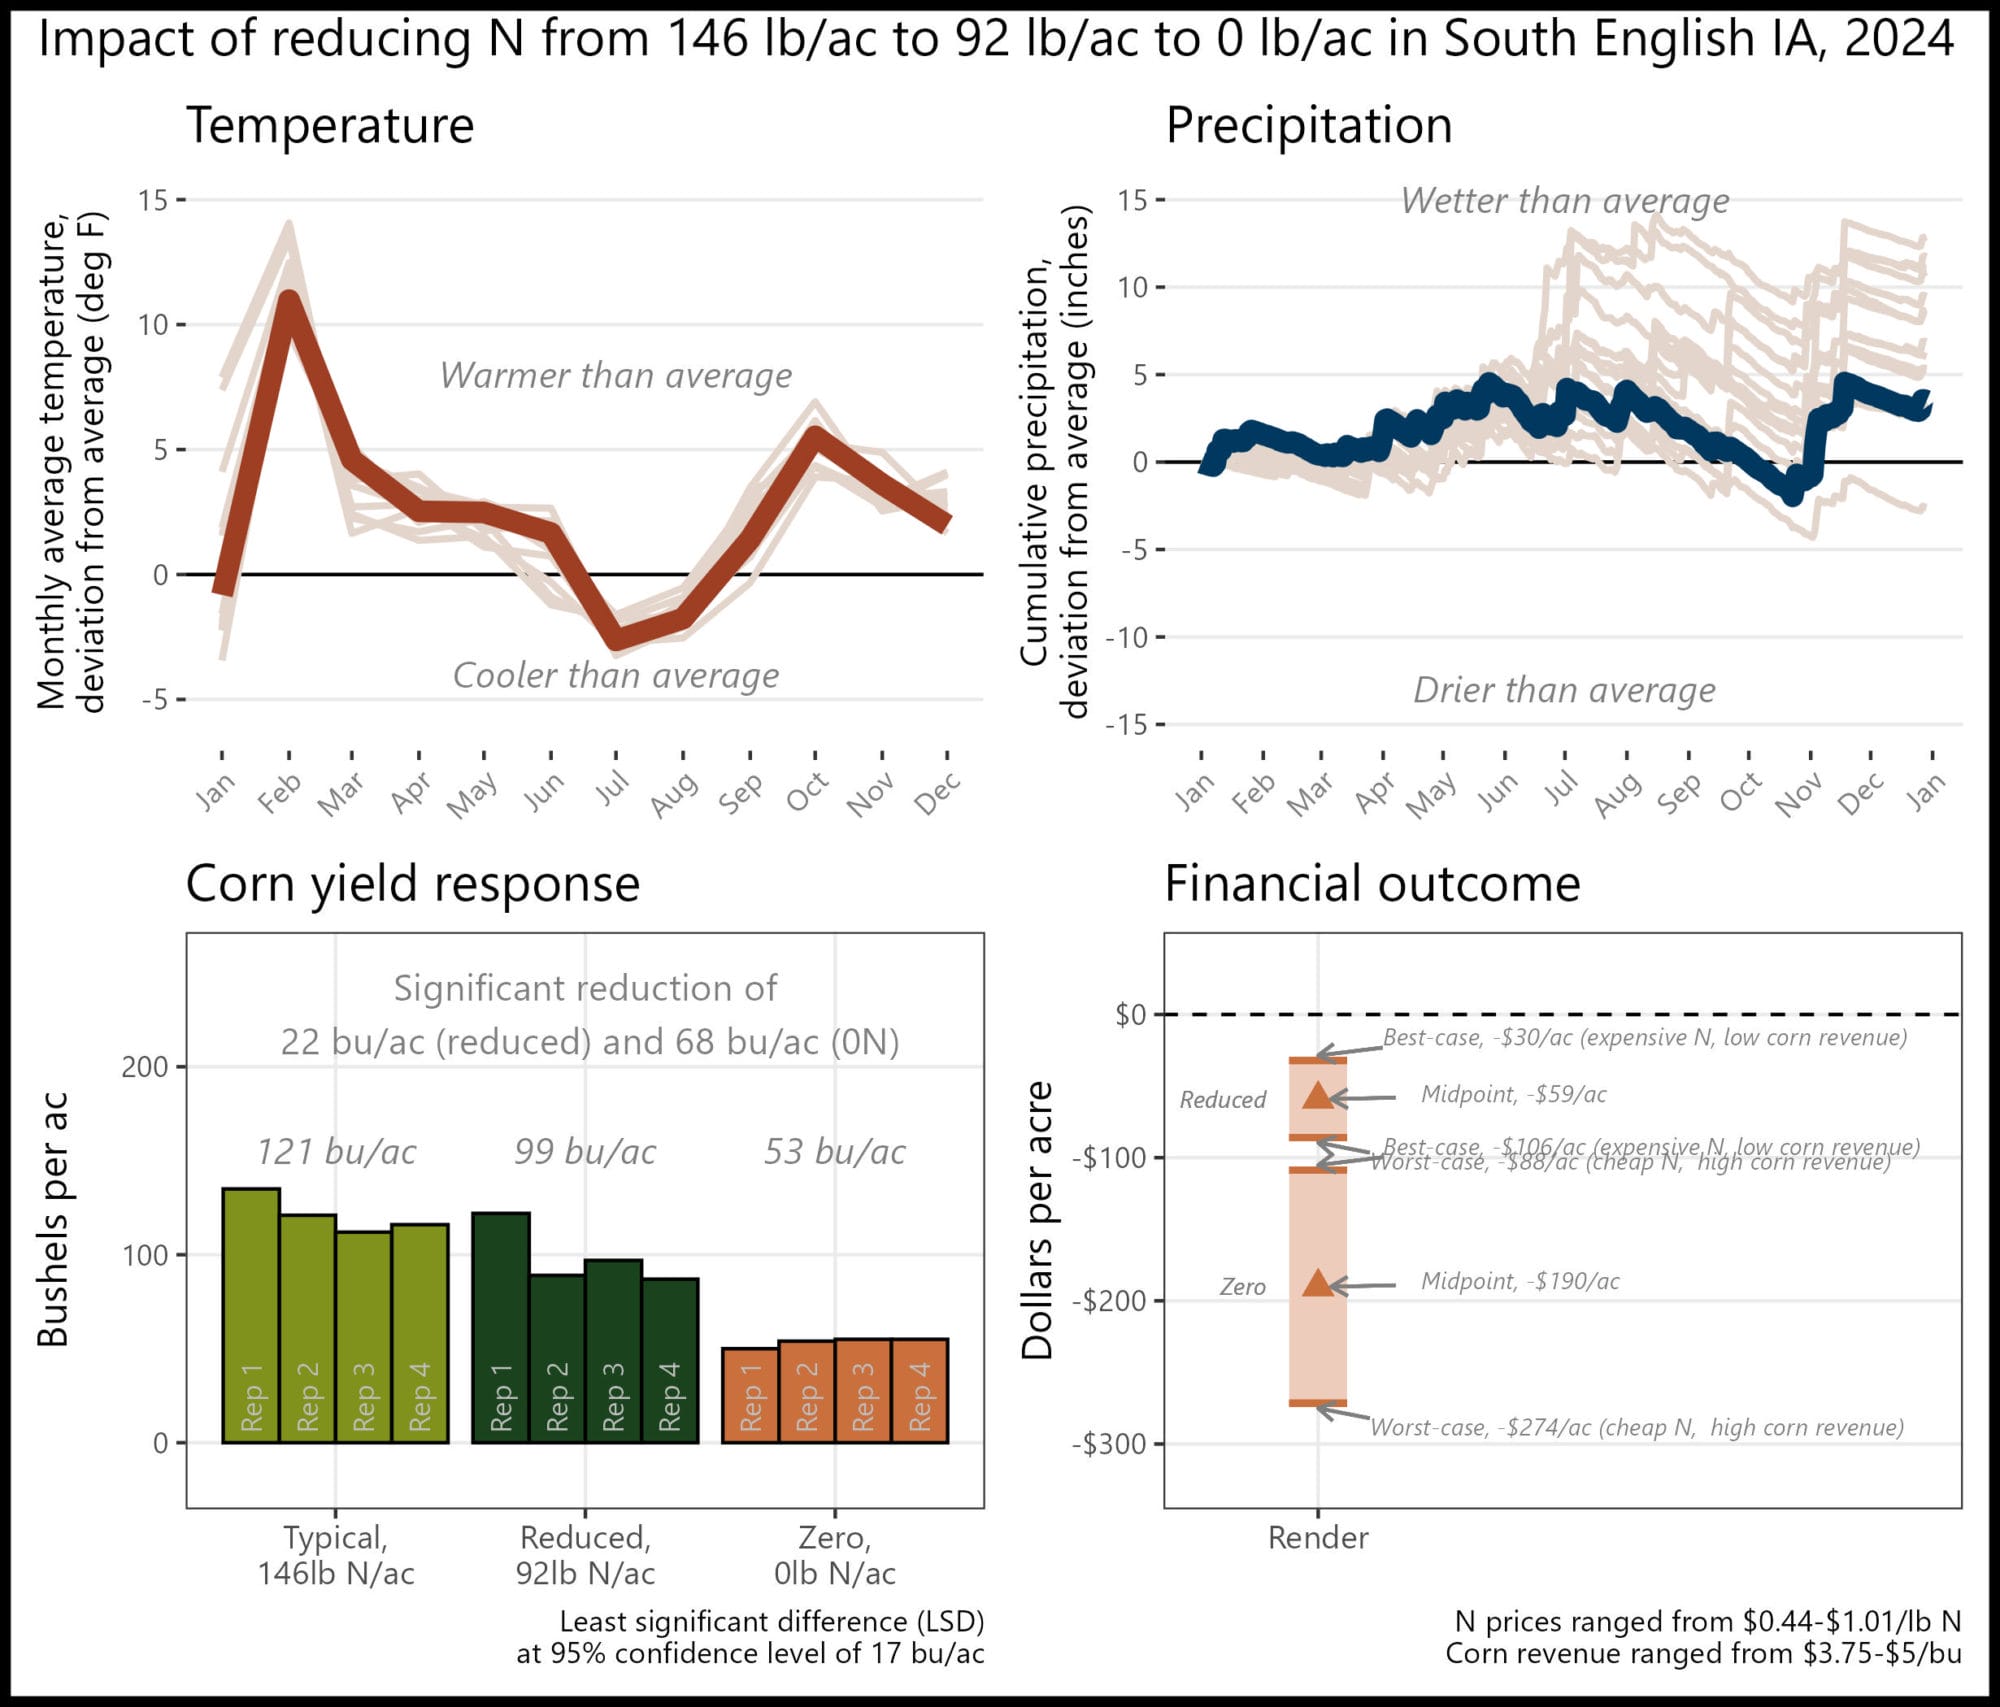
Appendix P. Justin Render; South English, Iowa
“I may change my upfront N from sprayer to planter and see how that effects the ability to make the N$ spent more efficient”
The financial outcome at both the reduced N rate and zero N rate resulted in a financial loss compared to the typical N rate. A reduction of 54 lb N/ac was likely too large this year, but there may be potential financial savings with a smaller N reduction. While considerable yield losses are expected when no nitrogen is applied, the 0N treatment is important for understanding the full impact of nitrogen on yield and profitability.
Historical cropping system (5 year): No-till corn and soybeans, cereal rye cover crop, grazing, cattle manure application
Previous crop: Soybeans
Strip size: 0.9 ac
Corn planting/harvest date: May 18/October 16
Corn row spacing/planting density: 30 in; 33,475 seeds/ac
Nitrogen sources and timing: Chemical; at-plant, sidedress
Appendix Q. Larry Schott; Riverside, Iowa
“I wouldn’t have guessed the reduced rate would not be statistically different from our typical rate”
The financial outcome at the reduced N rate was likely a financial savings compared to the typical N rate. A 40 lb N/ac reduction saved money this year, and, when applied to at least 32 acres, could offset the average annual GHGs of one vehicle.

Historical cropping system (5 year): No-till corn and soybeans
Previous crop: Soybeans
Strip size: 0.6 ac
Corn planting/harvest date: April 22/September 24
Corn row spacing/planting density: 30 in; 35,300 seeds/ac
Nitrogen sources and timing: Chemical; pre-plant, at-plant
Appendix R. Bailey Scott Hobbs; Dunnell, Minnesota
“I didn’t expect the no nitrogen to be quite that low. I also thought there would be even more of a significant difference in the typical to reduced rate.”
The financial outcome at both the reduced N rate and zero N rate resulted in a financial loss compared to the typical N rate. A reduction of 30 lb N/ac was likely too large this year, but there may be potential financial savings with a smaller N reduction. While considerable yield losses are expected when no nitrogen is applied, the 0N treatment is important for understanding the full impact of nitrogen on yield and profitability. 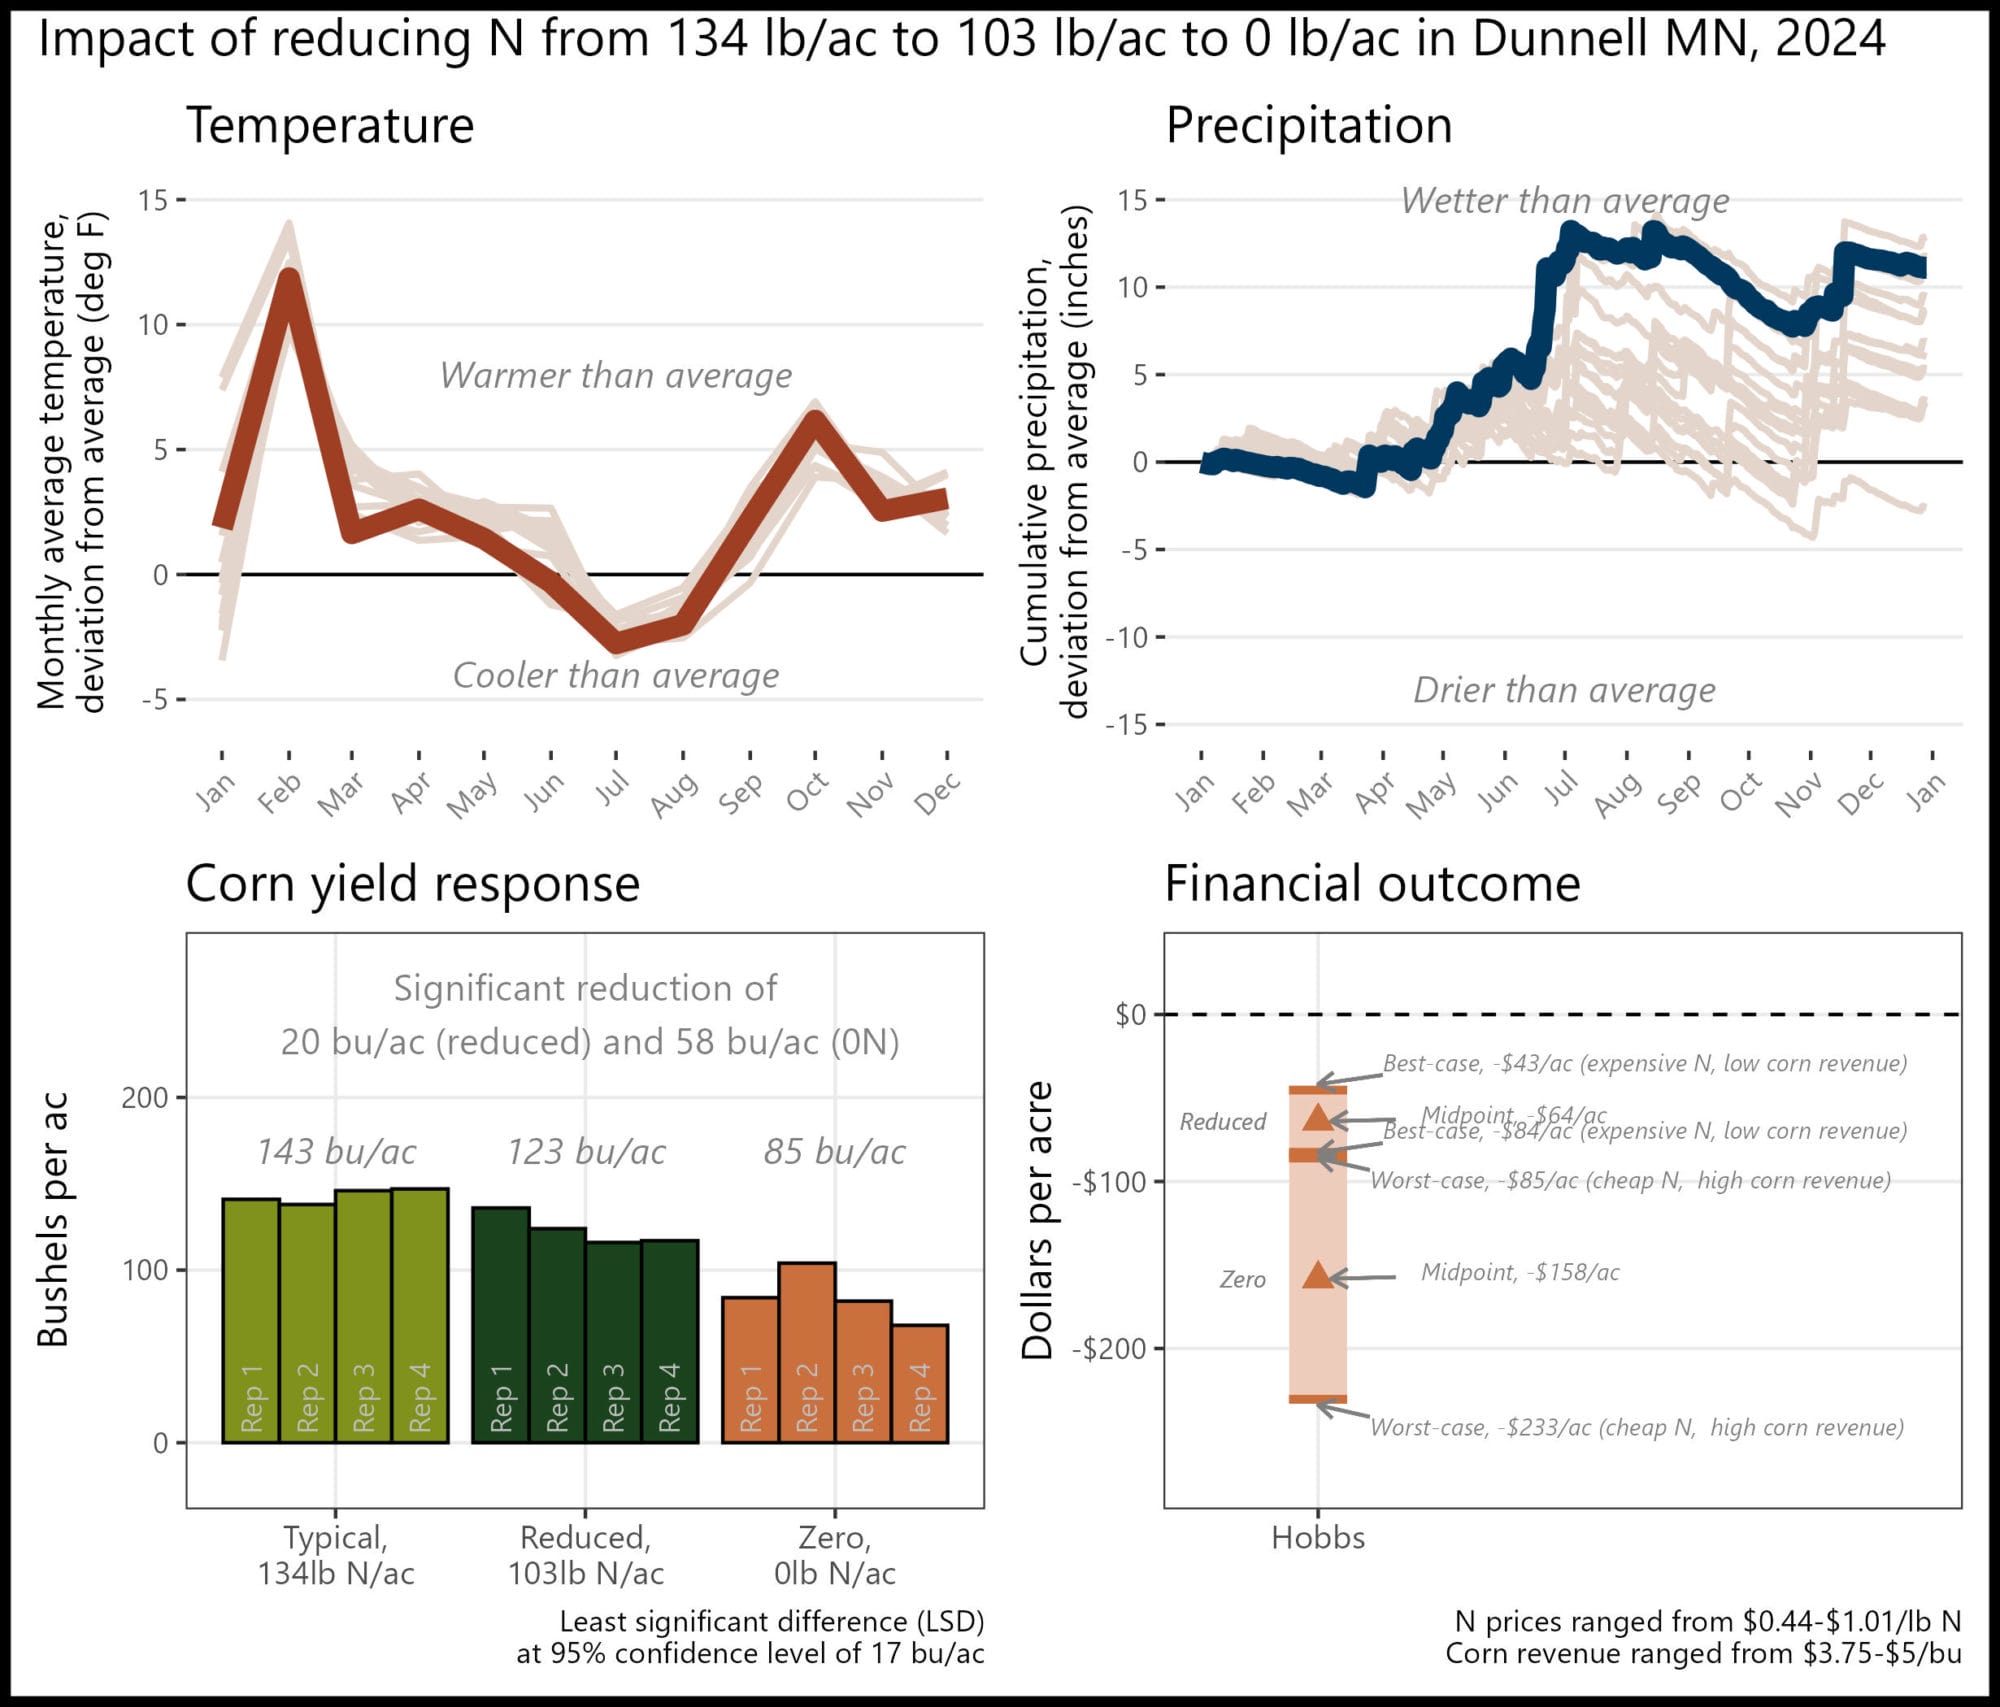
Historical cropping system (5 year): Conventional/strip/no-till soybeans and corn
Previous crop: Soybeans and cereal rye cover crop
Strip size: 12.4 ac
Corn planting/harvest date: May 18/November 1
Corn row spacing/planting density: 30 in; 35,000 seeds/ac
Nitrogen sources and timing: Chemical; pre-plant, sidedress
Appendix S. Tim Sieren; Keota, Iowa
“I’ll have more confidence in reducing my N rates in the future.”
The financial outcome at the reduced N rate was likely a financial savings compared to the typical N rate. A 47 lb N/ac reduction saved money this year, and, when applied to at least 27 acres, could offset the average annual GHGs of one vehicle. 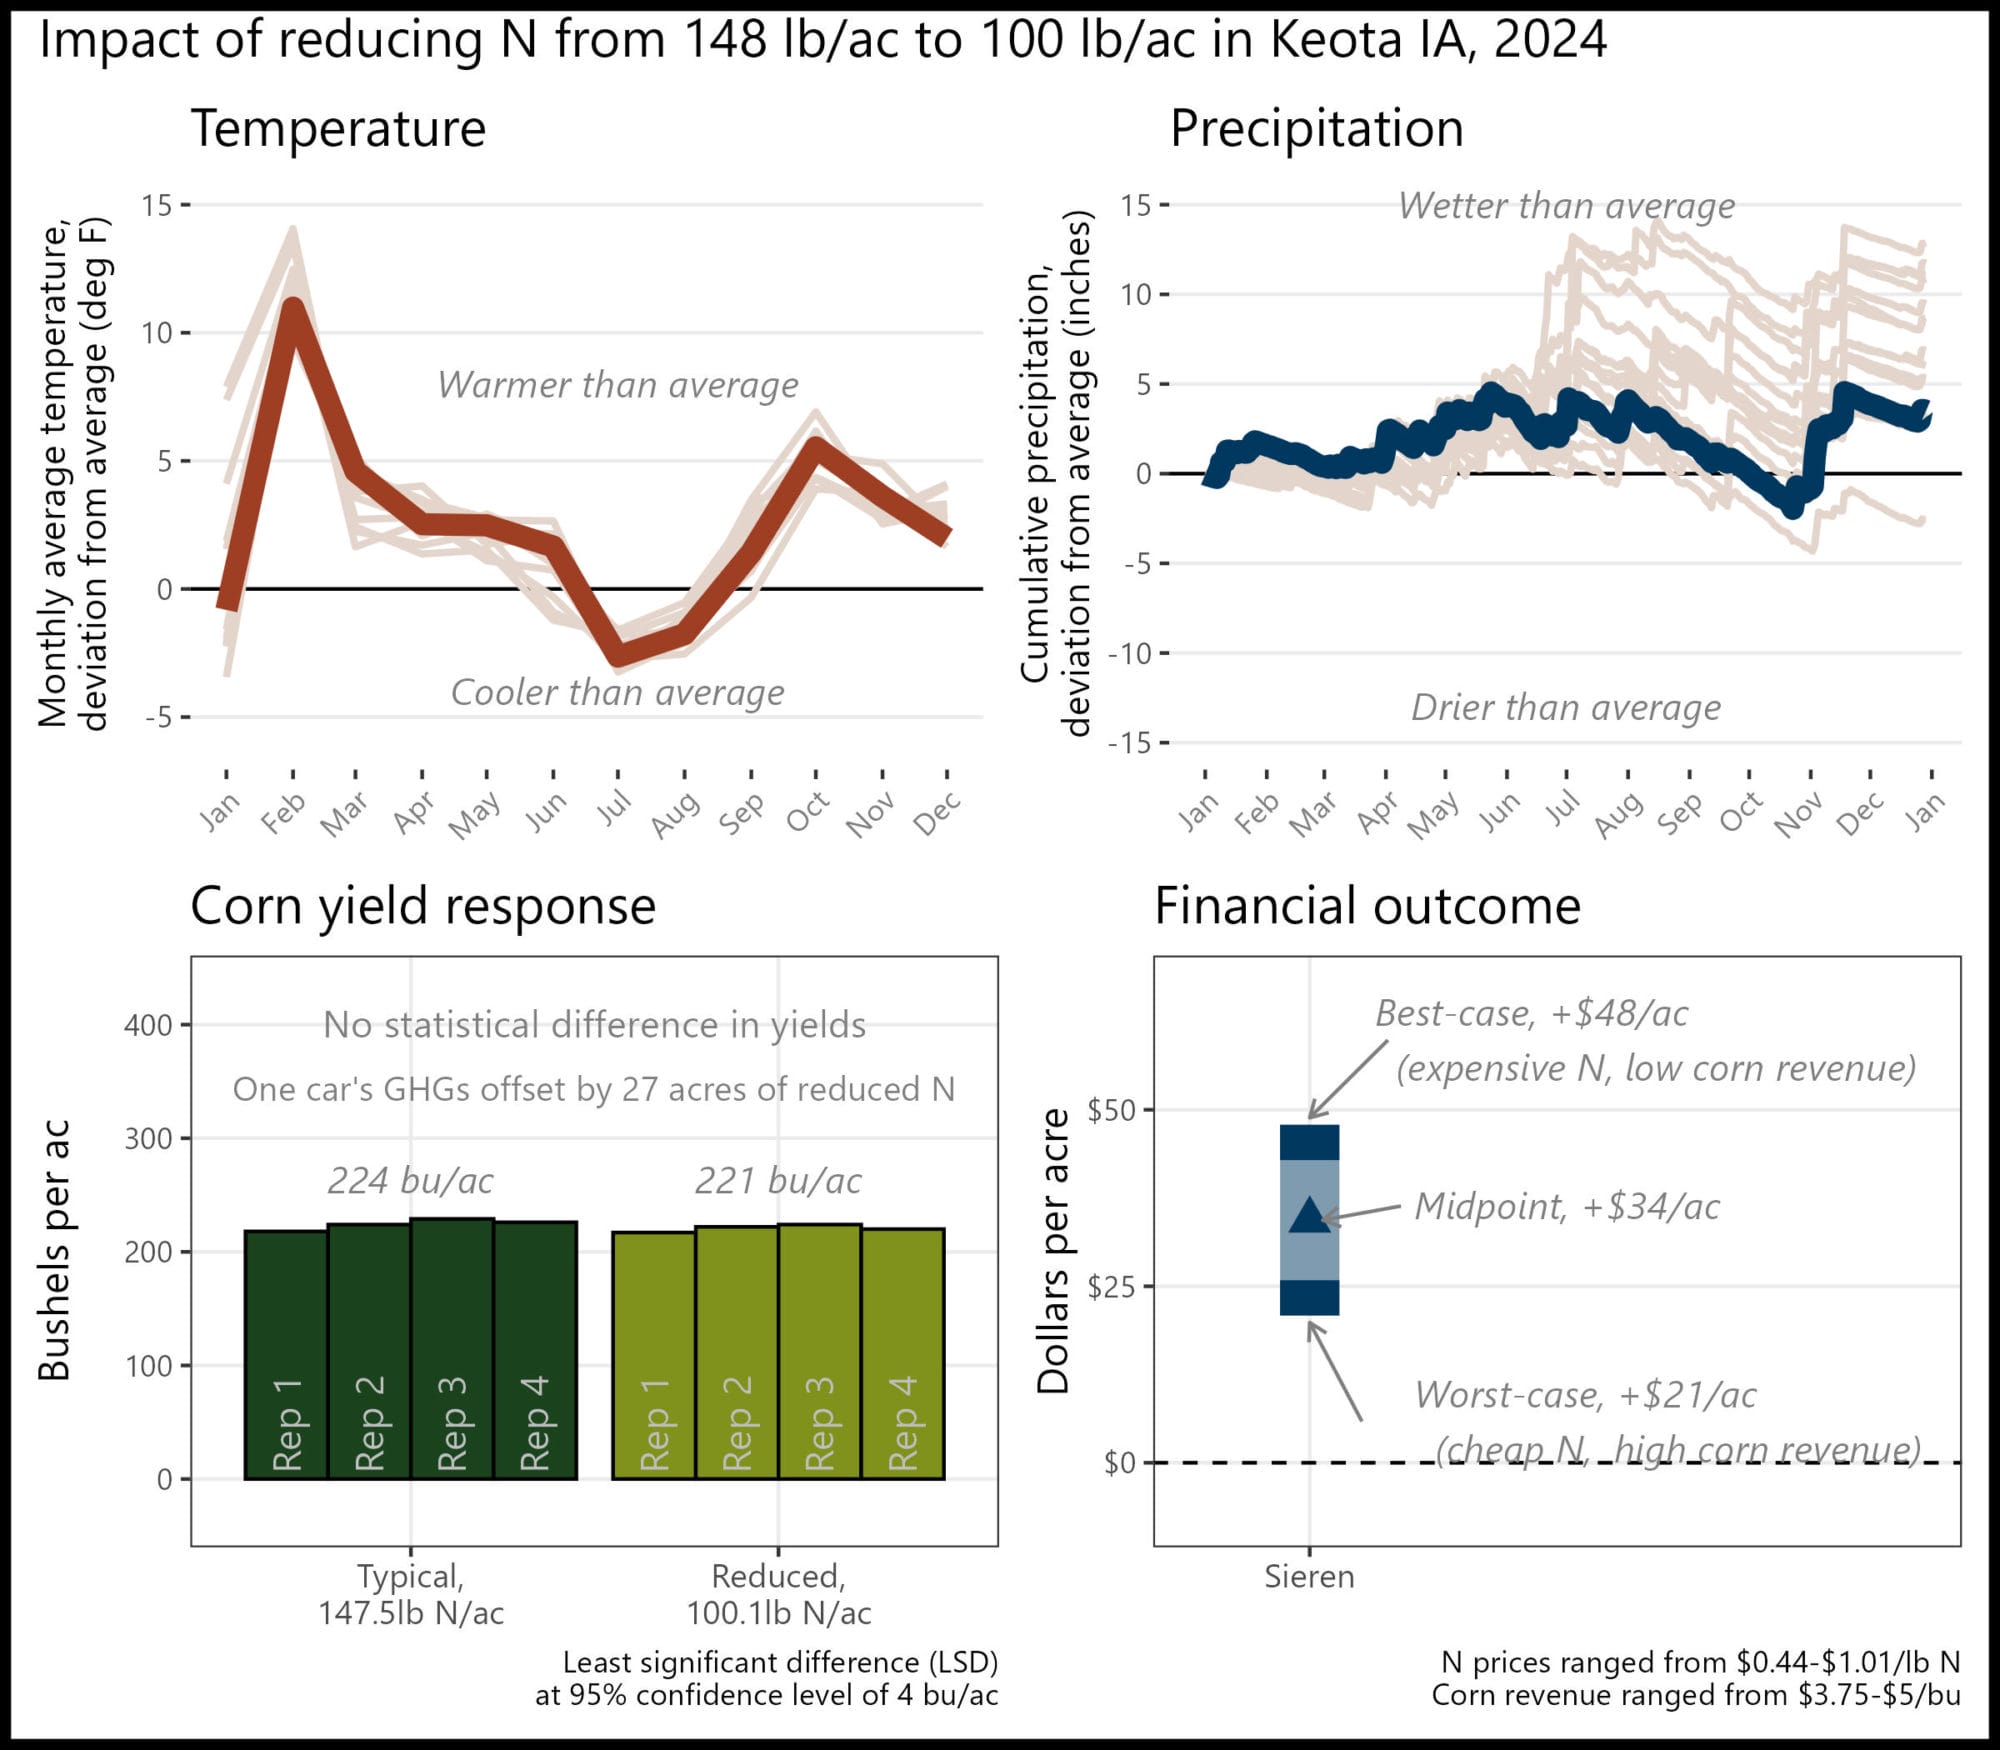
Historical cropping system (5 year): Strip/no-till corn and soybeans; cereal rye and cover crop mixes; manure application, and fall grazing
Previous crop: Soybeans and cereal rye
Strip size: 0.7 ac
Corn planting/harvest date: May 19/October 16
Corn row spacing/planting density: 30 in; 35,000 seeds/ac
Nitrogen sources and timing: Chemical; at-plant, sidedress
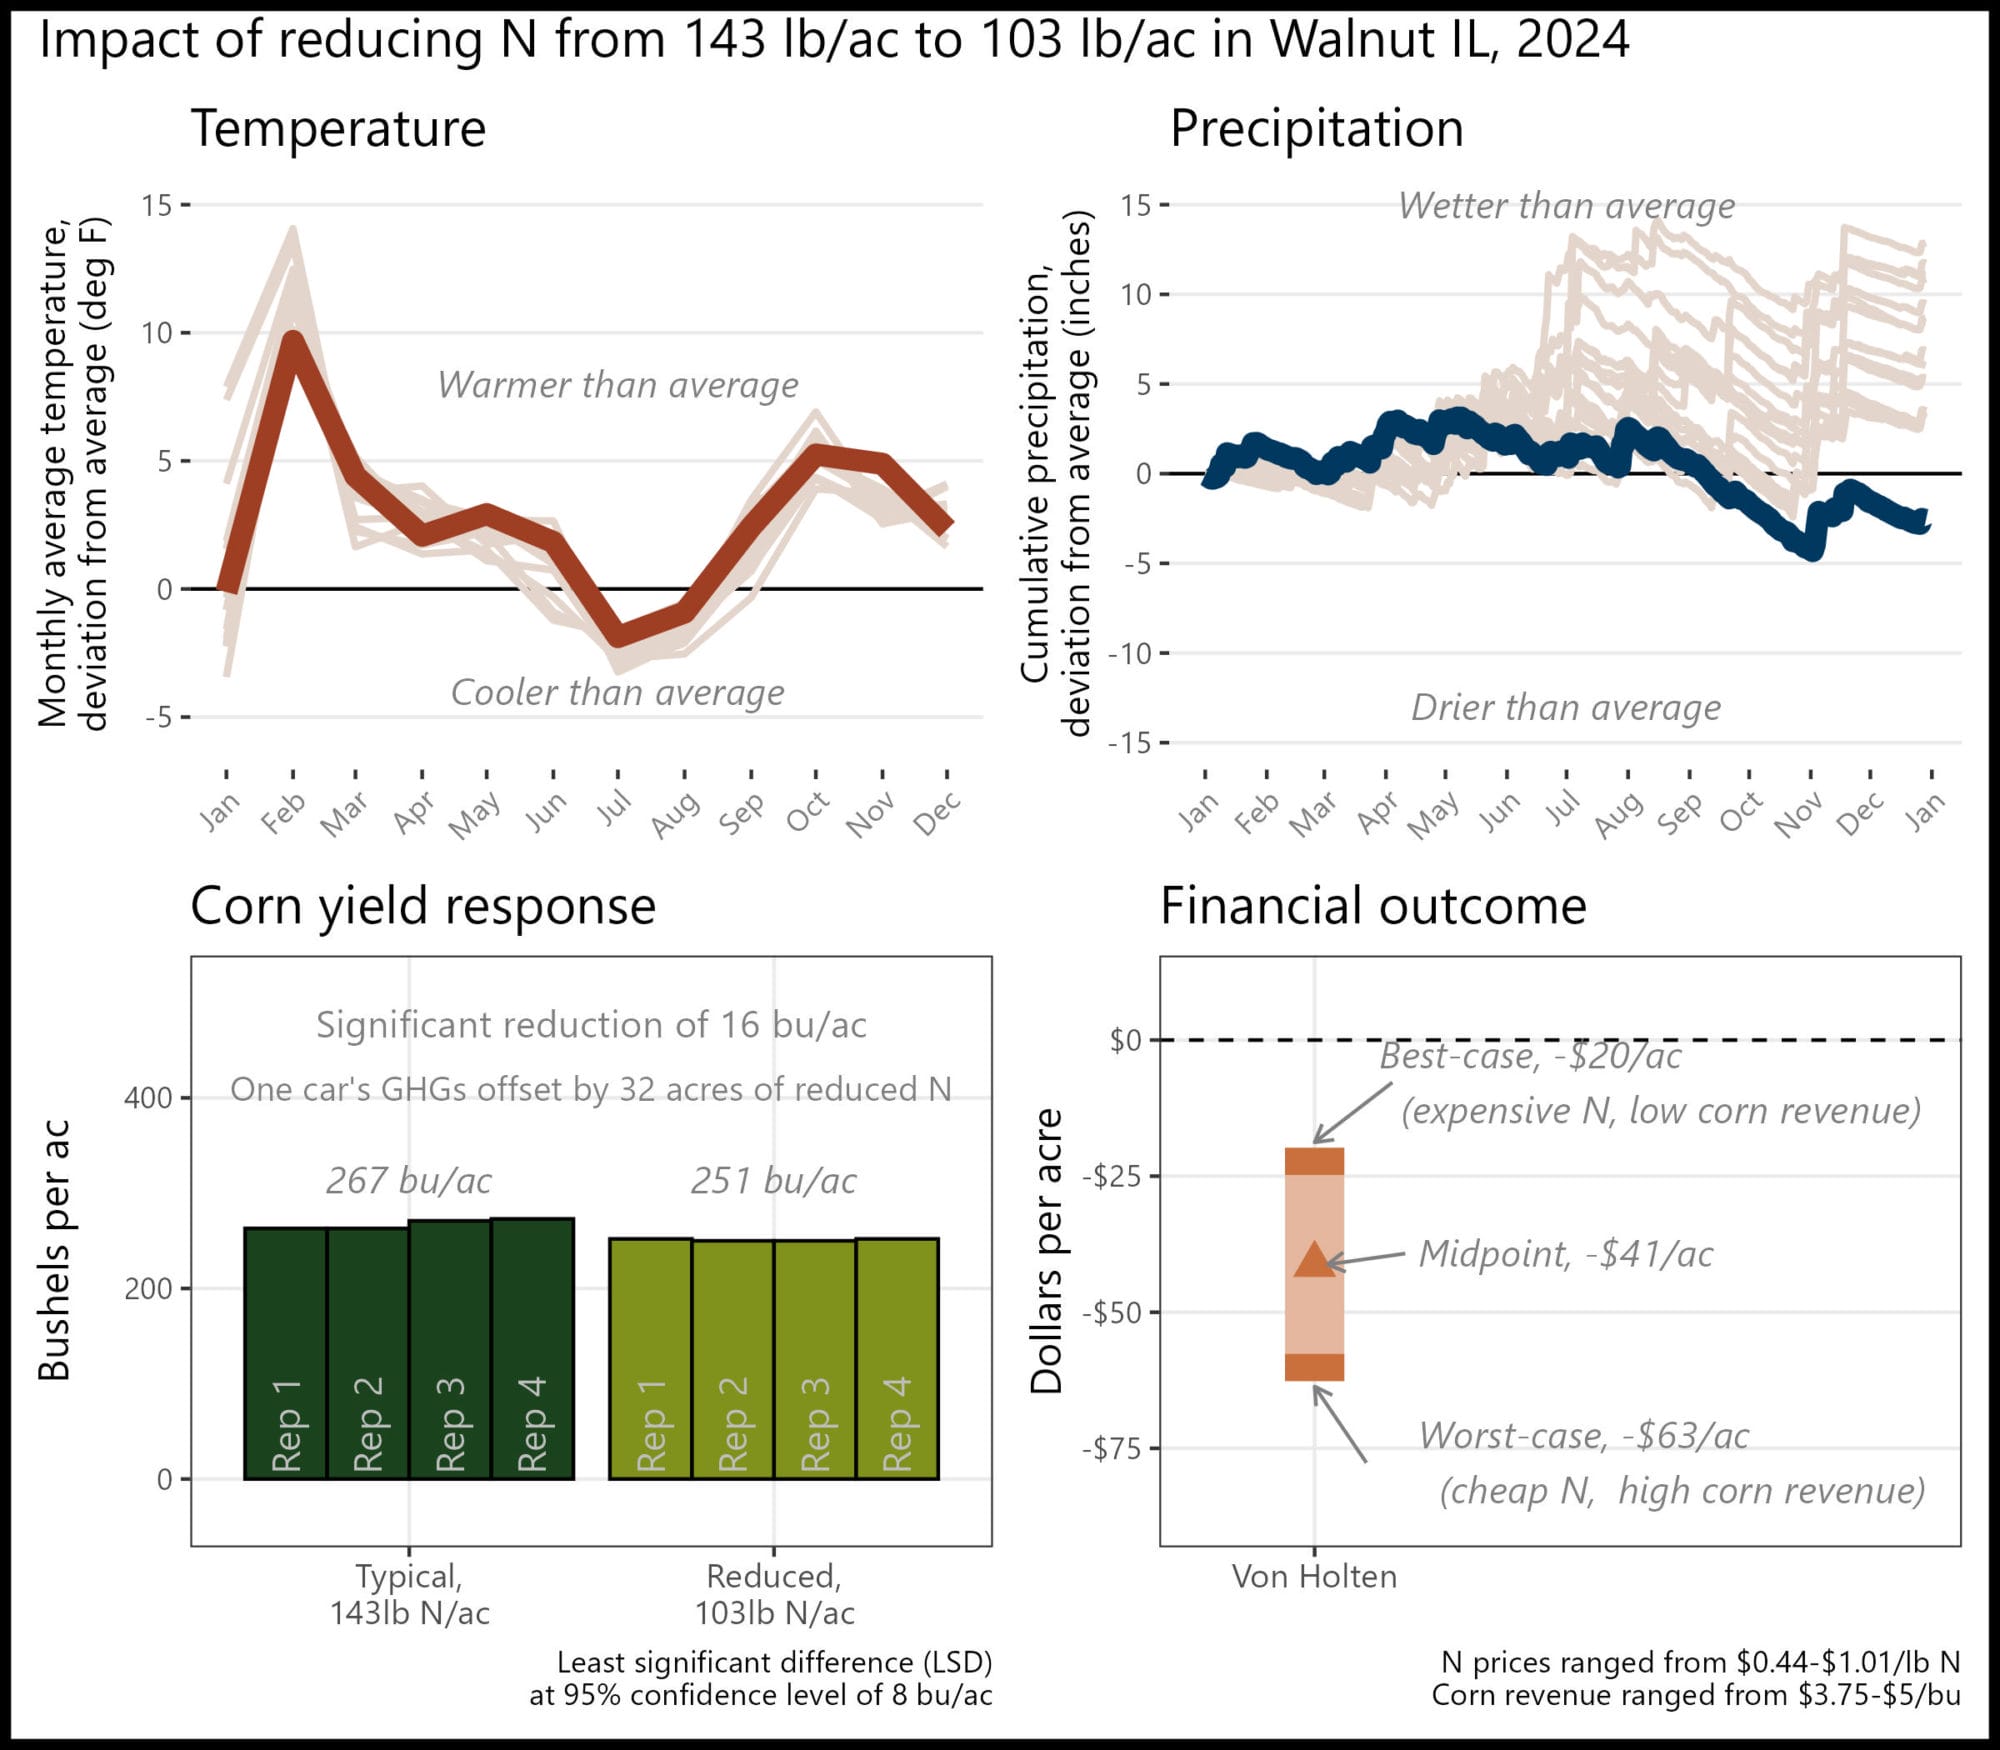
Appendix T. Chris Von Holten; Walnut, Illinois
“My typical rate N rate is working for me but there is still some room to try and reduce it further.”
The financial outcome at the reduced N rate was likely a financial loss compared to the typical N rate. A 40 lb N/ac reduction was likely too large this year, but there may be potential for financial savings with a smaller N reduction.
 Historical cropping system (5 year): No-till corn and soybeans; cereal rye and wheat cover crops
Previous crop: Wheat and soybeans
Strip size: 1 ac
Corn planting/harvest date: May 5/October 14
Corn row spacing/planting density: 30 in; 32,900 seeds/ac
Nitrogen sources and timing: Chemical; at-plant, sidedress
Appendix U. Detailed Methods
Weather data
Each cooperator chose a US Census-recognized town with which to associate their trial. The latitude and longitude of the chosen town were used to retrieve weather data from the National Aeronautics and Space Administration (NASA) Prediction of Worldwide Energy Resources (POWER) project using the nasapower package [9] for R software [10]. Data was downloaded for the period spanning January 1, 1994 through December 31, 2024. Two weather variables were used: (1) cumulative daily precipitation values and (2) the average daily air temperature at two meters above ground level. The weather data was separated into two data sets: one comprising the entire 30 years of data (historical weather data), and one containing only data from January 1 – December 31, 2024 (trial year data).
To provide context for each trial’s temperatures, the historical mean temperature for month at a given site was calculated using the historical weather dataset. The historical value was subtracted from the trial year average temperature for that month to provide an estimate of the deviation from average conditions.
GHG Emissions
Both direct and indirect (volatilization, leaching) N2O emissions were considered in these calculations. Additionally, although N2O emissions do vary by the form of N fertilizer used, in this trial farmers only adjusted chemical forms of N fertilizer, and the variation between chemical fertilizer types was small compared to the absolute estimates (~1%), so an average of the fertilizer types was used.
Funding Acknowledgement
This material is based upon work supported by the U.S. Department of Agriculture, under agreement number NR216114XXXXG003, and by The Foundation for Food & Agriculture Research (FFAR). Any opinions, findings, conclusions, or recommendations expressed in this publication are those of the author(s) and do not necessarily reflect the views of the U.S. Department of Agriculture or FFAR. In addition, any reference to specific brands or types of products or services does not constitute or imply an endorsement by the U.S. Department of Agriculture or FFAR for those products or services. USDA is an equal opportunity provider, employer, and lender.
References
[1] G. Nichols and S. Gailans, “Can We Reduce N Rates to Corn and Improve ROI?,” Practical Farmers of Iowa, 2024. Accessed: Mar. 18, 2025. [Online]. Available: https://practicalfarmers.b-cdn.net/wp-content/uploads/2024/06/23.FC_.canwereduceNratestocorn.pdf
[2] G. Nichols and S. Gailans, “Can We Reduce N Rates and Improve ROI?,” Practical Farmers of Iowa, 2023. Accessed: Mar. 28, 2024. [Online]. Available: https://practicalfarmers.b-cdn.net/wp-content/uploads/2023/07/22.FC_.Can-WeReduceN.pdf
[3] T. F. Morris et al., “Strengths and Limitations of Nitrogen Rate Recommendations for Corn and Opportunities for Improvement,” Agron. J., vol. 110, no. 1, pp. 1–37, 2018, doi: 10.2134/agronj2017.02.0112.
[4] “IPCC Fourth Assessment Report: Climate Change 2007.” Intergovernmental Panel on Climate Change, 2007. Accessed: Mar. 28, 2024. [Online]. Available: https://archive.ipcc.ch/publications_and_data/ar4/wg1/en/ch2s2-10-2.html
[5] “GREET.” U.S. Department of Energy, 2022. Accessed: Mar. 28, 2024. [Online]. Available: https://www.energy.gov/eere/greet
[6] “Greenhouse Gases Equivalencies Calculator – Calculations and References.” U.S. Environmental Protection Agency, 2024. Accessed: Mar. 28, 2024. [Online]. Available: https://www.epa.gov/energy/greenhouse-gases-equivalencies-calculator-calculations-and-references
[7] “Good Practice Guidance and Uncertainty Management in National Greenhouse Gas Inventories,” Intergovernmental Panel on Climate Change, 2000. Accessed: Mar. 28, 2024. [Online]. Available: https://www.ipcc-nggip.iges.or.jp/public/gp/english/
[8] “Greenhouse Gas Emissions from a Typical Passenger Vehicle.” U.S. Environmental Protection Agency, 2024. Accessed: Mar. 28, 2024. [Online]. Available: https://www.epa.gov/greenvehicles/greenhouse-gas-emissions-typical-passenger-vehicle
[9] A. H. Sparks, “nasapower: A NASA POWER Global Meteorology, Surface Solar Energy and Climatology Data Client for R,” J. Open Source Softw., vol. 3, no. 30, p. 1035, Oct. 2018, doi: 10.21105/joss.01035.
[10] R Core Team, “R: A language and environment for statistical computing.” R Foundation for Statistical Computing, Vienna, Austria, 2022. Accessed: Mar. 28, 2024. [Online]. Available: https://www.r-project.org/