In a Nutshell:
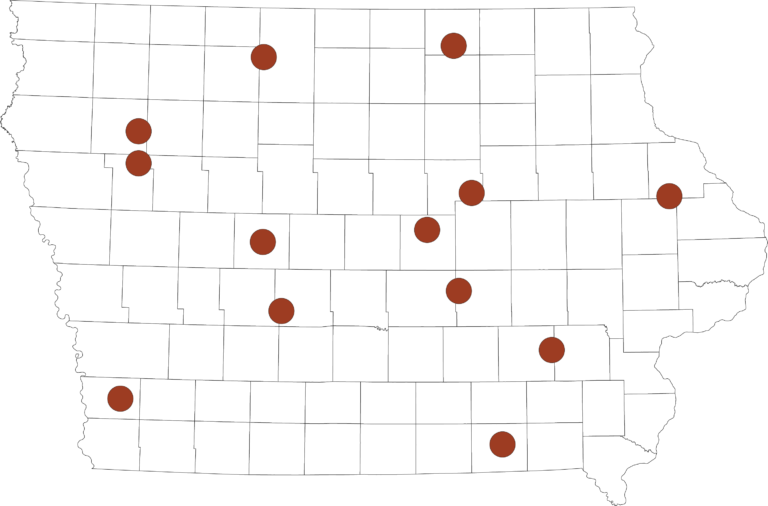
- Sixteen corn farmers performed 17 replicated strip trials testing their typical nitrogen (N) rate against that rate reduced by 15-45%.
- Most farms routinely used cover crops in the past five years (14), while some used a diversified crop rotation (4), applied manure (7) or incorporated grazing (6). Farms were predominantly in no-till with some occasionally including strip-till.
Key Findings:
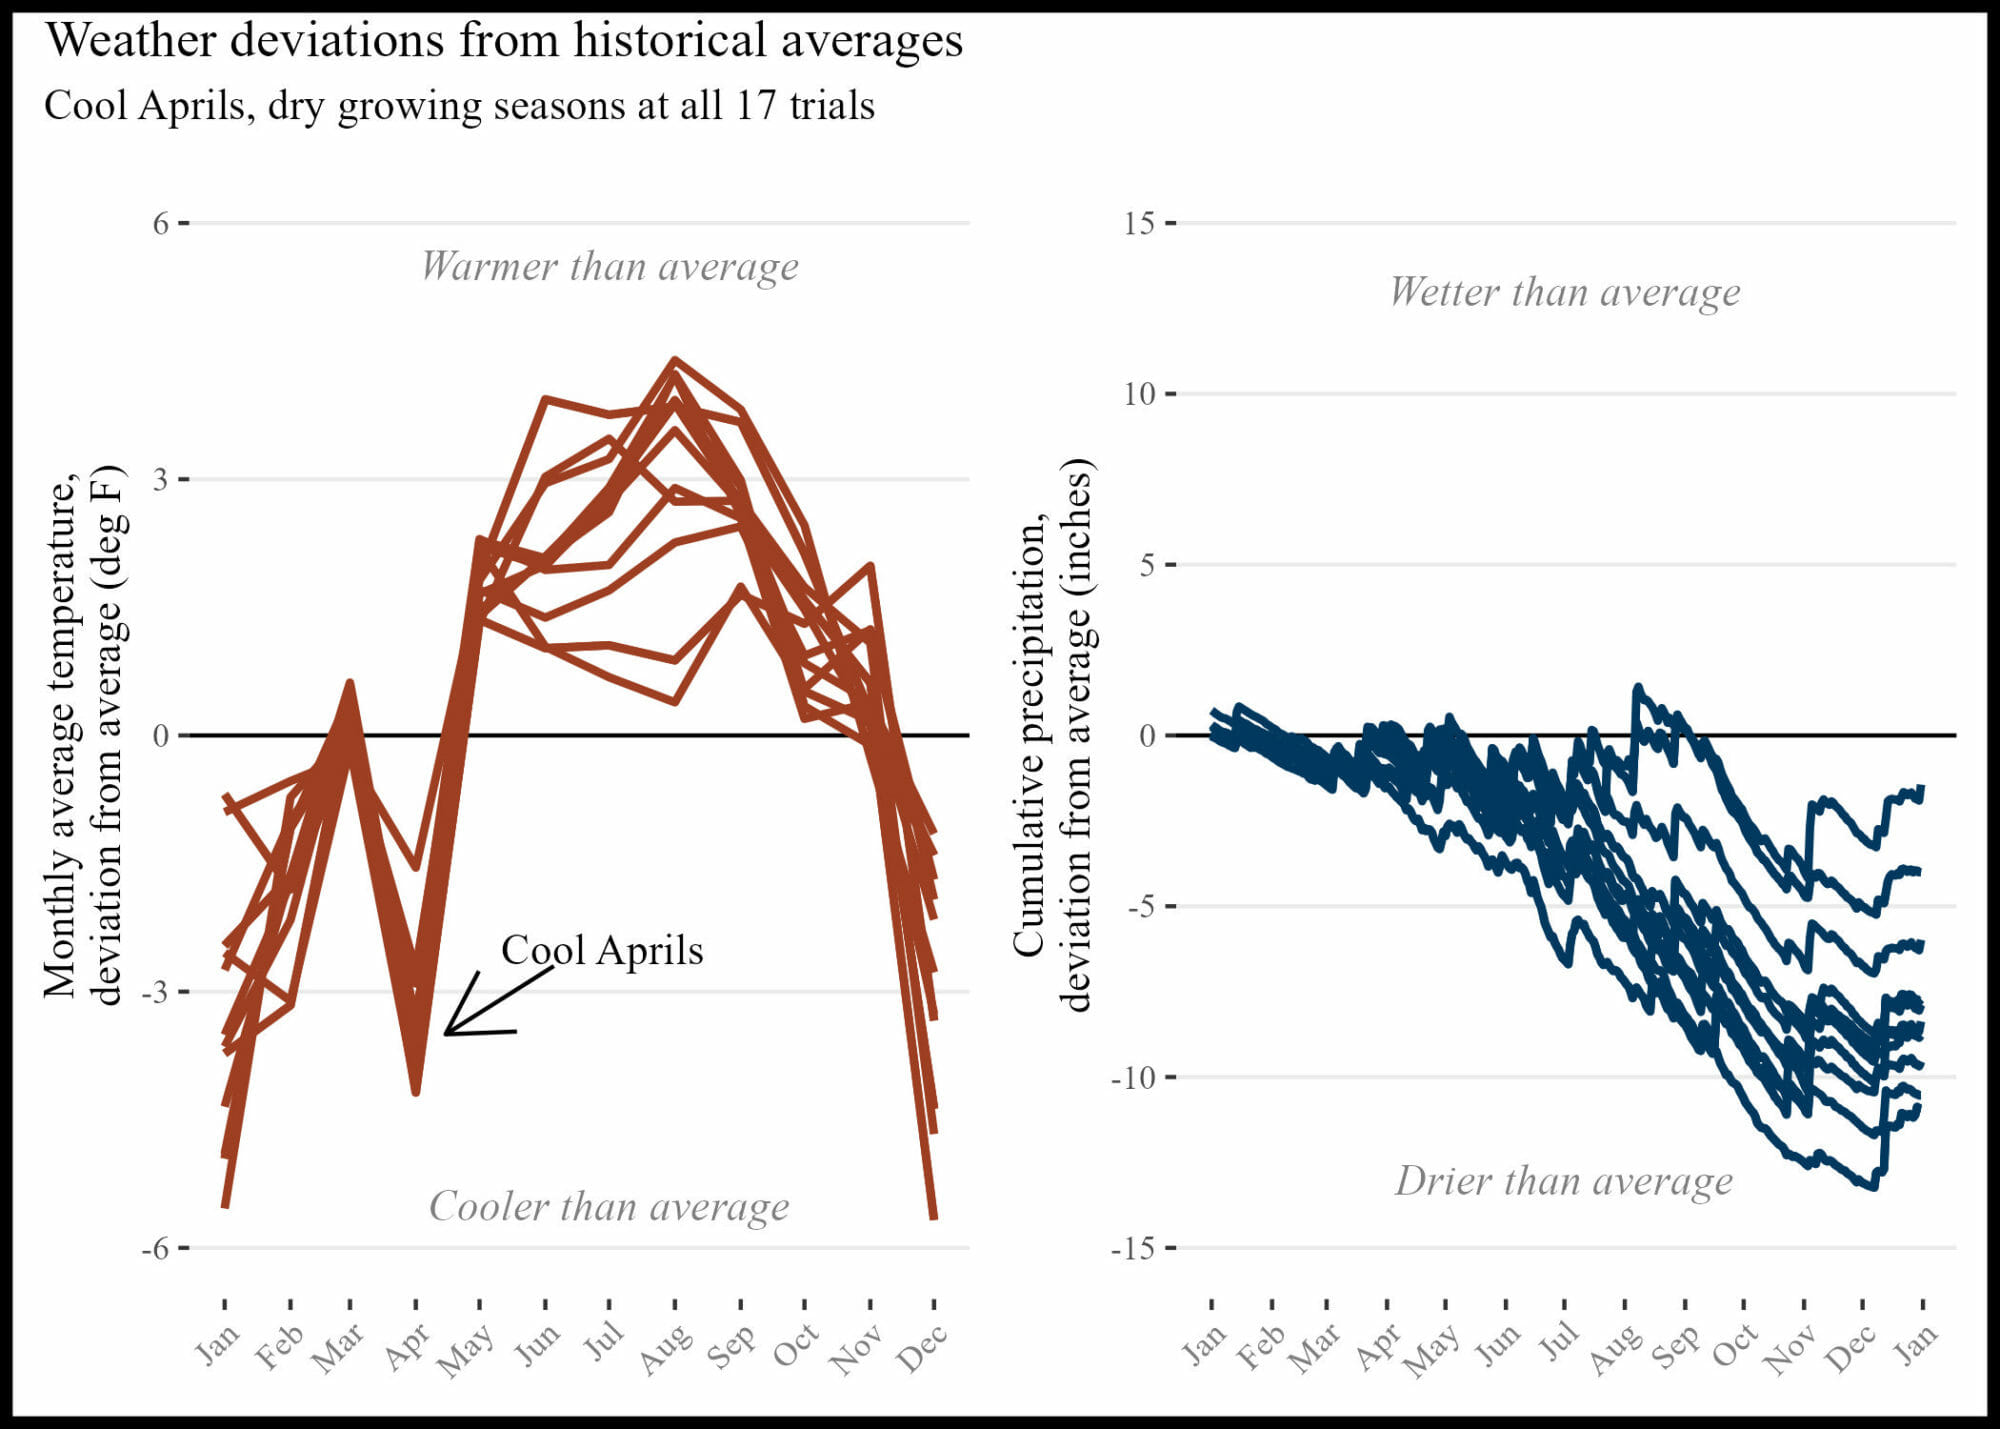
- All sites experienced drier-than-average growing seasons.
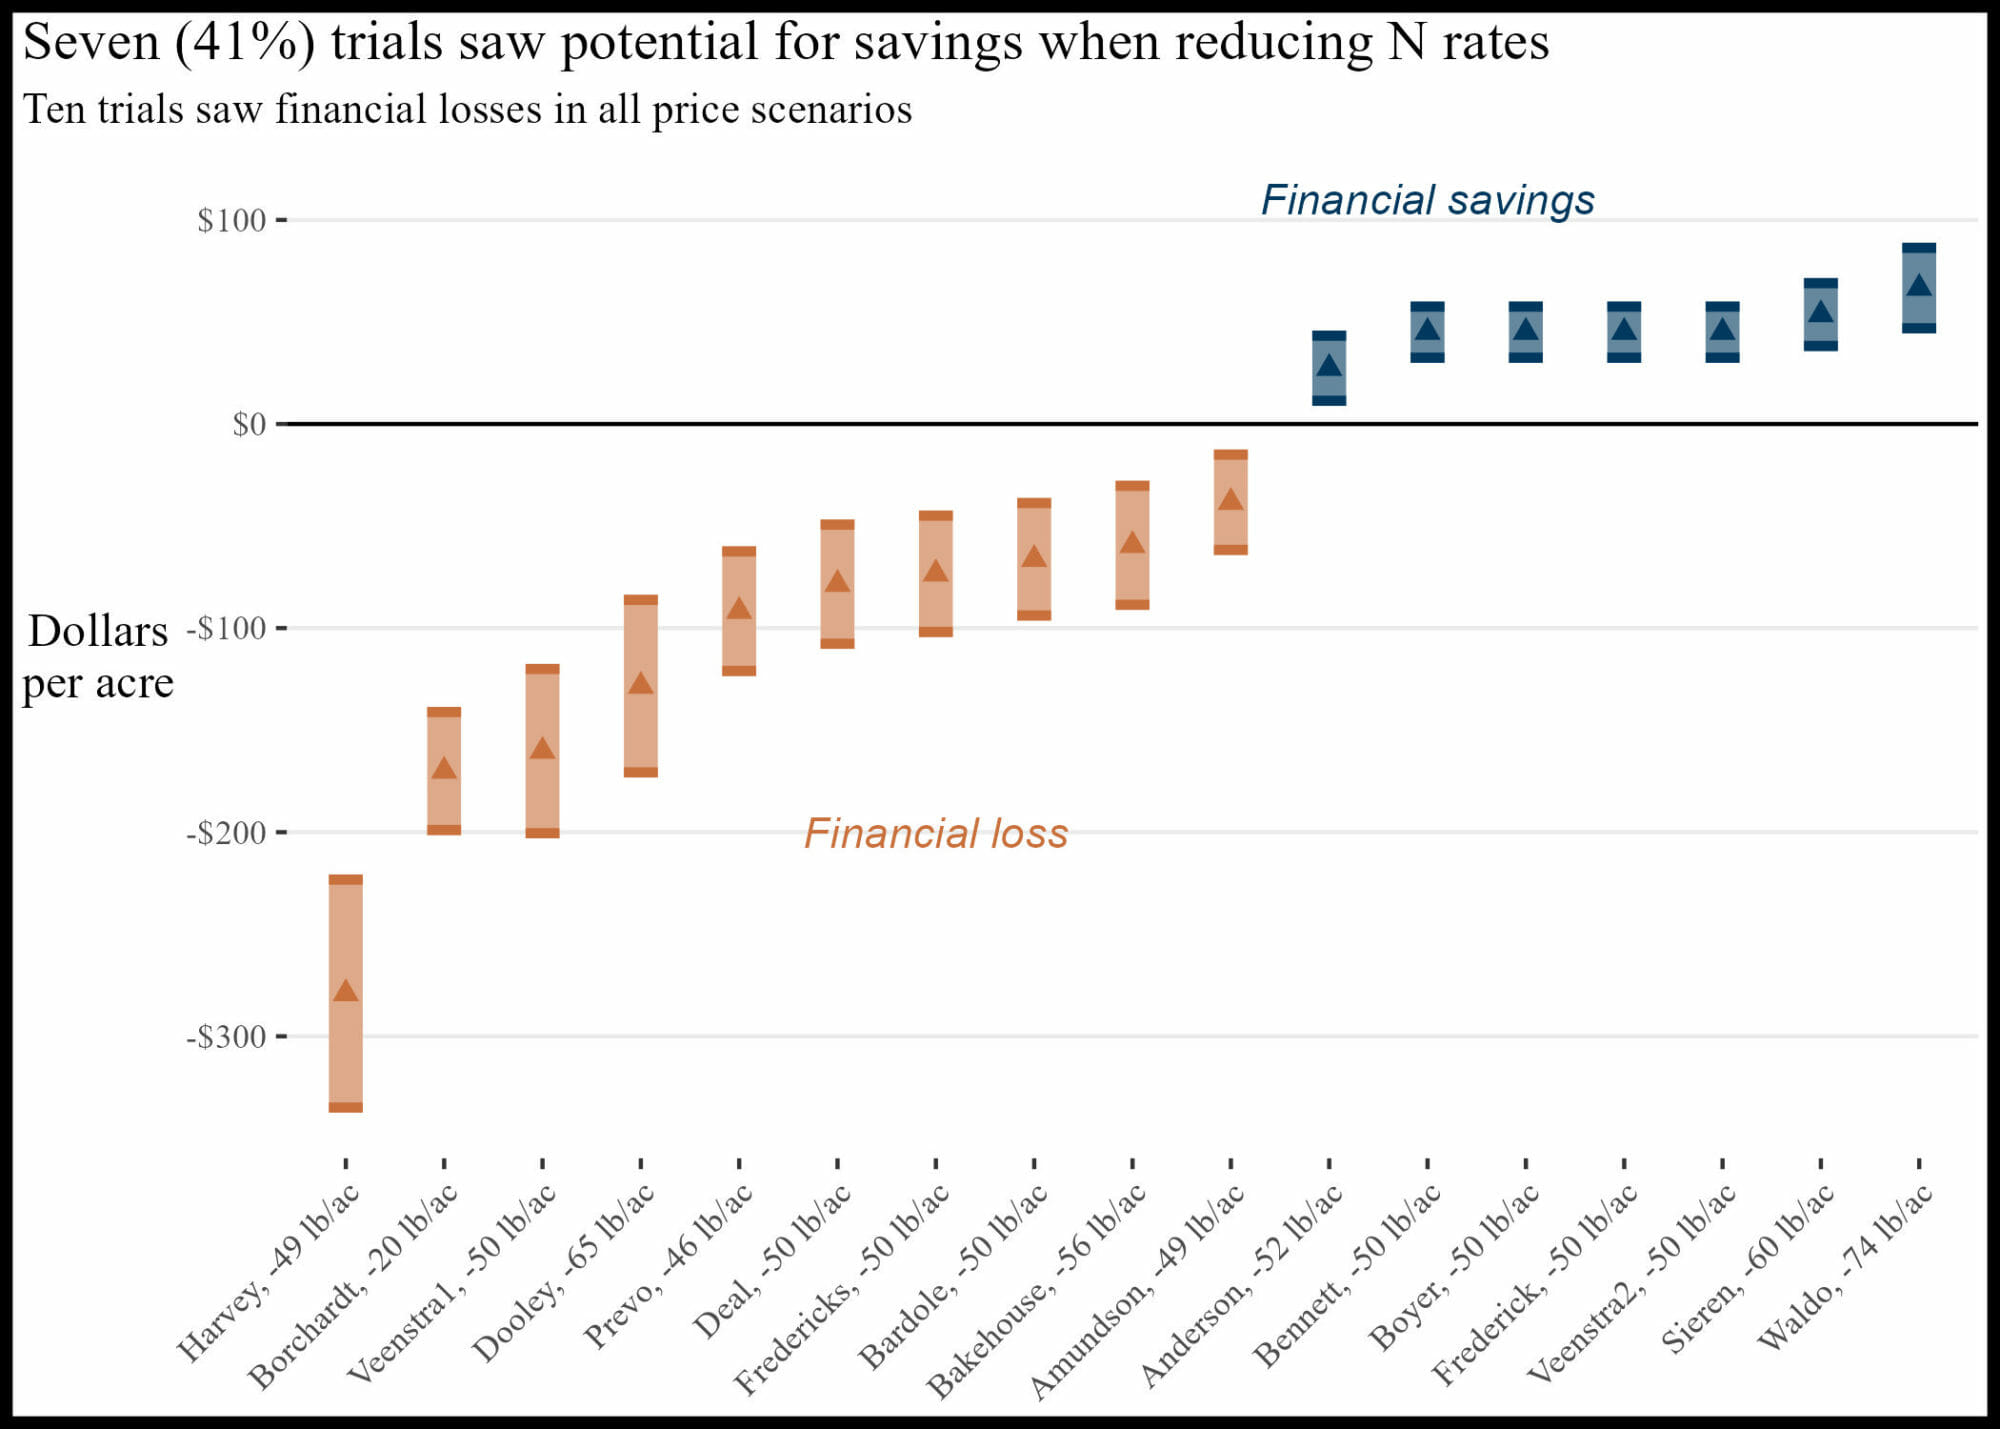
- Seven of the 17 trials saw potential for financial savings when reducing their N rates.

Background
Thirty years after some of the first trials in PFI’s Cooperators’ Program investigated fertilizer inputs, farmers are again interrogating their N rates. In this round, farmers are wondering if the soil health-building practices they have implemented (reduced tillage, cover crops, diversified rotations, etc.) will allow them to reduce their typical N rates. While many farmers wonder if they can leverage healthier soils to reduce their N rates, few have had the opportunity to test lower N rates in a structured setting. “One of my biggest questions for several years has been whether I was being too aggressive with the amount of nitrogen I was using. This trial will allow me to explore that important question,” said Chris Deal at the beginning of this project. This newest round of N trials began in fall 2021 in preparation for the 2022 growing season. The first year included farmers recruited by PFI staff who self-identified as using soil health-promoting practices for at least five years. Using a replicated strip-trial design, farmers compared yields and finances at their typical N rate with those observed at a reduced rate. Based on the trials conducted 30 years ago, PFI staff suggested farmers try reducing their N application by 50 pounds of N per acre. While this is an aggressive reduction in many systems, one goal of the trial was to push farmers to explore N rates outside of their comfort zone. If farmers can maintain corn yields and/or save money at the reduced N rate, results might spark confidence to reduce (or at least question) fertilizer rates going forward, much like what happened for the original cohort of PFI farmers who trialed fertilizer rates. If the reduced N rate lowers corn yields and loses money, farmers will still have gained valuable information: They can be more confident that their typical rate is the right rate for their farm, but maybe new long-term practices could help reduce it in the future. Additionally, while individual trials are immensely useful for farmers, aggregating many trial results can provide a more powerful dataset to help farmers evaluate their N rates. Sam Bennett put it best: “We get one shot at the best crop every year, and the logical thing to do seems to be to give the crop everything it needs (and more) to maximize yields. This trial will put together a good set of farm-scale data to give farmers the confidence to dial in their N rate to improve profitability and water quality.”
Methods
DesignCooperating farms were located across Iowa with at least one farm in each of the four largest landform regions (Des Moines Lobe [north-central]; Iowan Surface [northeast]; Northwest Iowa Plains; Southern Iowa Drift Plain). All farmers used two treatments:
- Typical - Their typical N fertilizer rate applied to a corn crop.
- Reduced - An N fertilizer rate less than the typical rate.
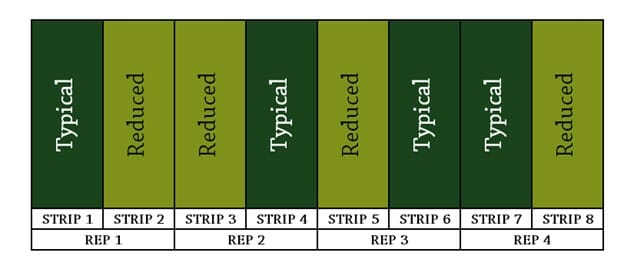
Treatments were applied in strips starting in fall 2021 to fields destined to be planted in corn for the 2022 growing season (Figure 1). All treatments were replicated at least four times, resulting in a total of at least eight plots in each farmer’s trial.
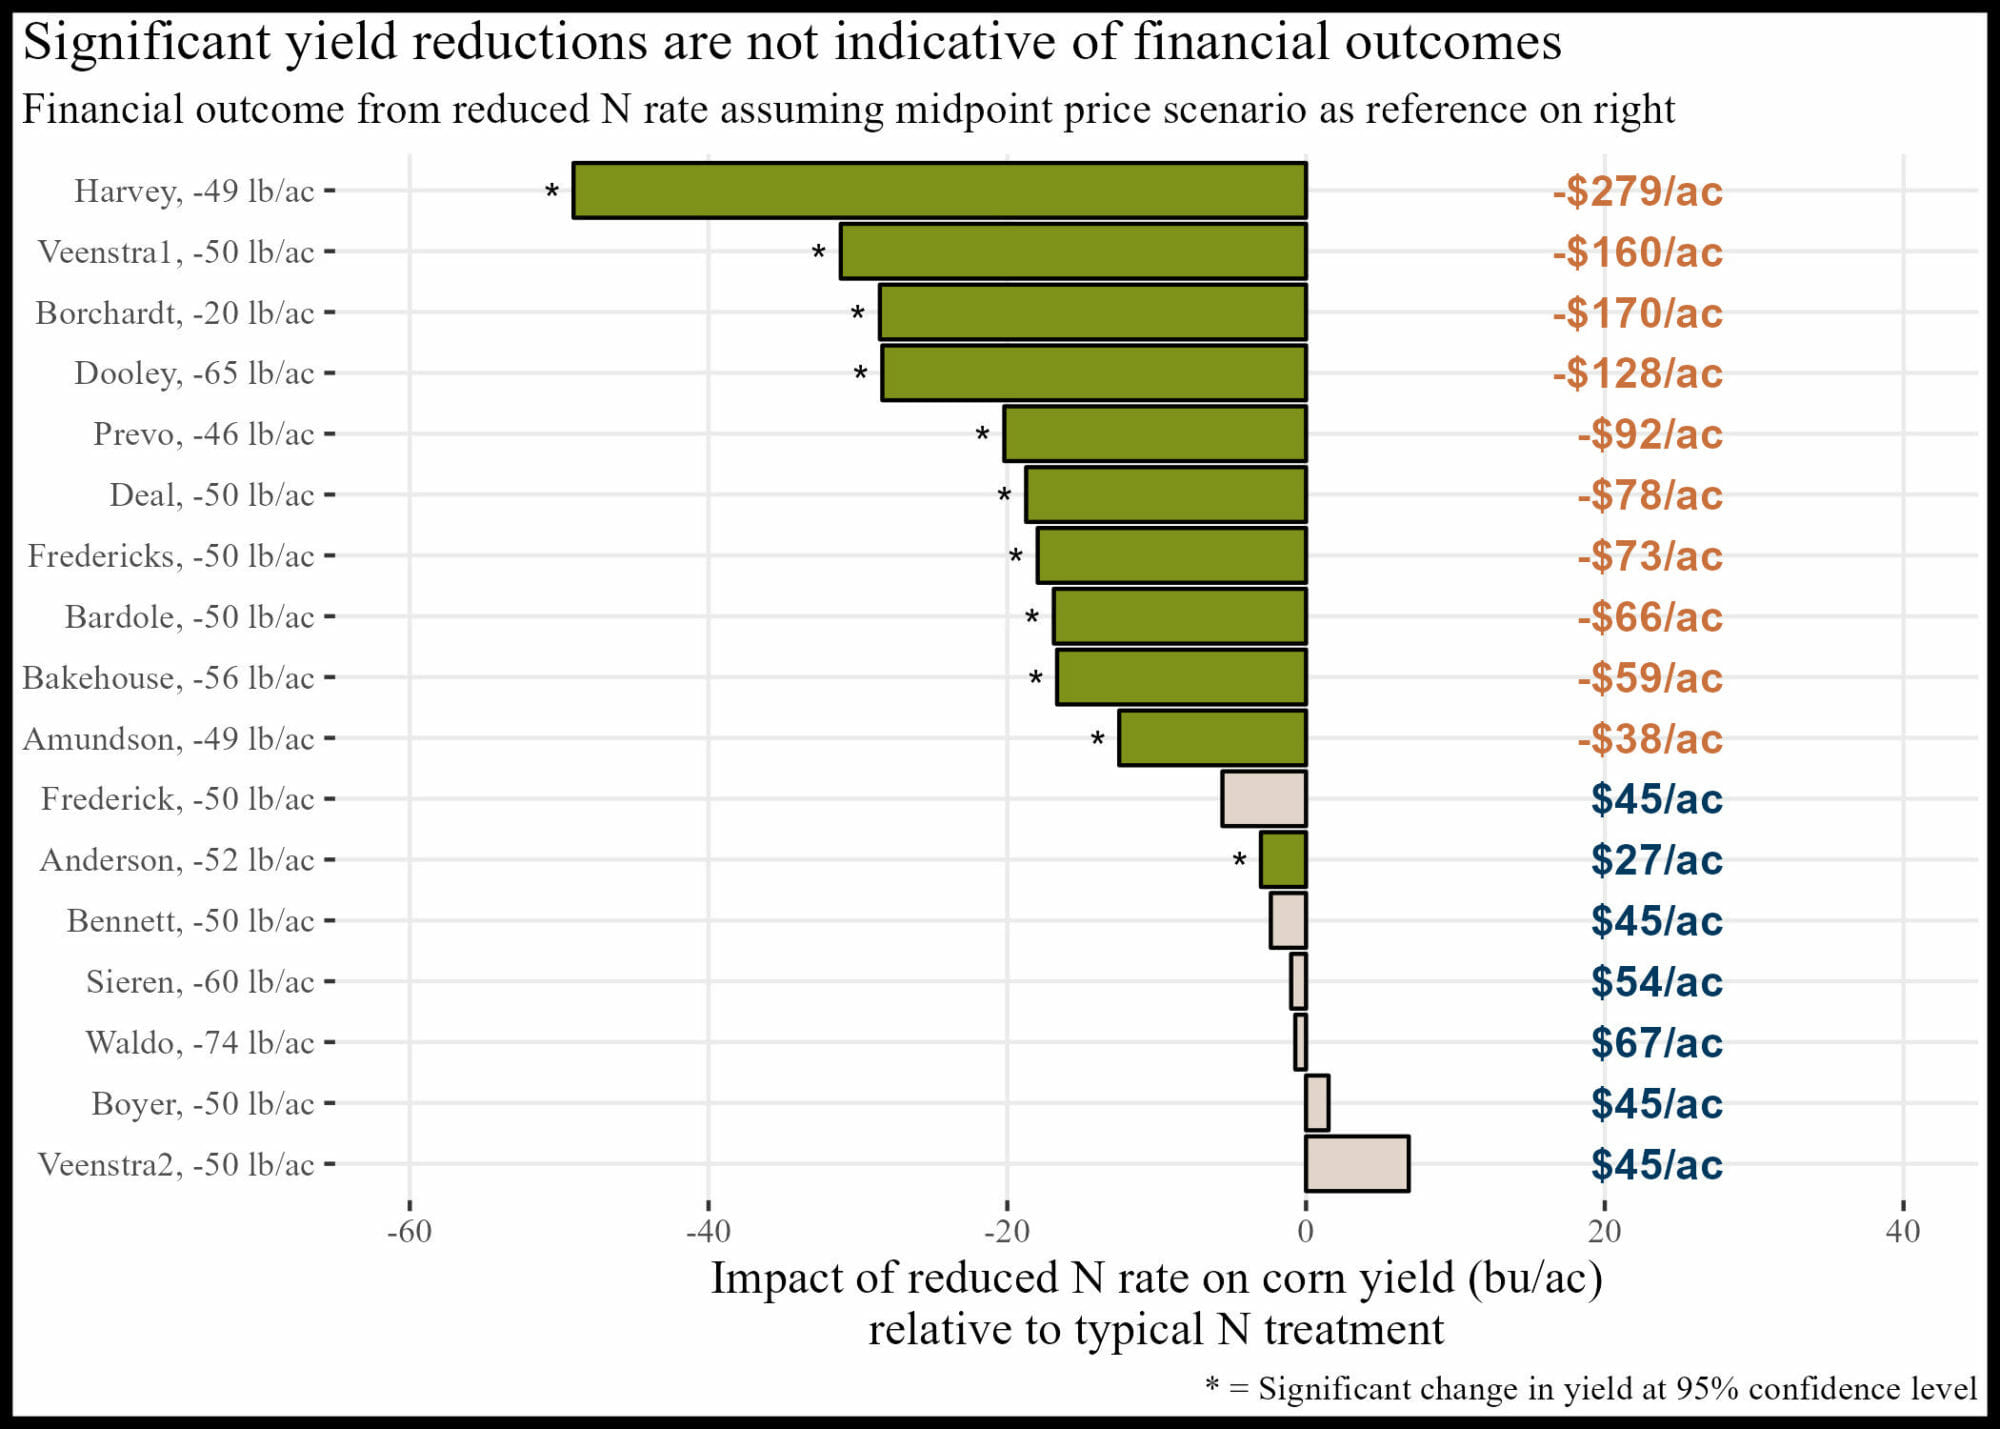
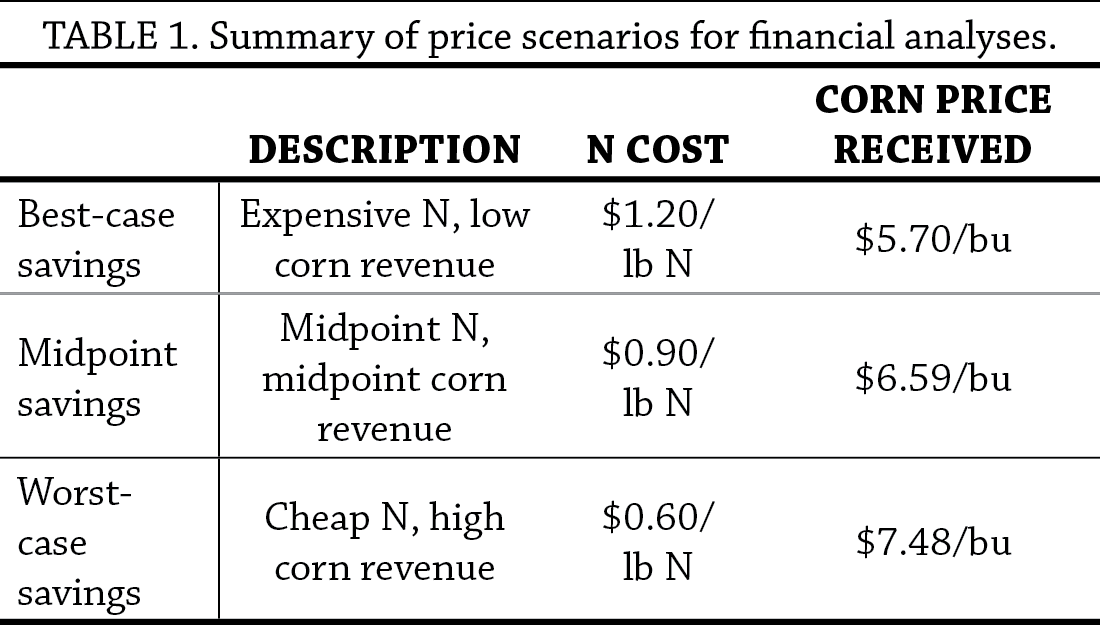 A partial budget using a given price scenario was performed for each treatment. Costs were estimated as the amount of N applied in that treatment multiplied by the assumed N cost, which depended on the scenario (Table 1). If the yields of each treatment were statistically different, each treatment’s yields were used for corn revenue calculations. If there was no statistical difference in treatment yields, the overall mean yield for the trial was used for corn revenue calculations. Partial net revenue for each treatment was calculated by subtracting the costs (N applied multiplied by N price) from the revenue (yield multiplied by corn price). The difference between partial net revenues for the ‘reduced’ and ‘typical’ treatments were calculated and reported. A positive value therefore represents a financial savings at the reduced N rate. This process was done separately for the three price scenarios.
Results and Discussion
Treatments
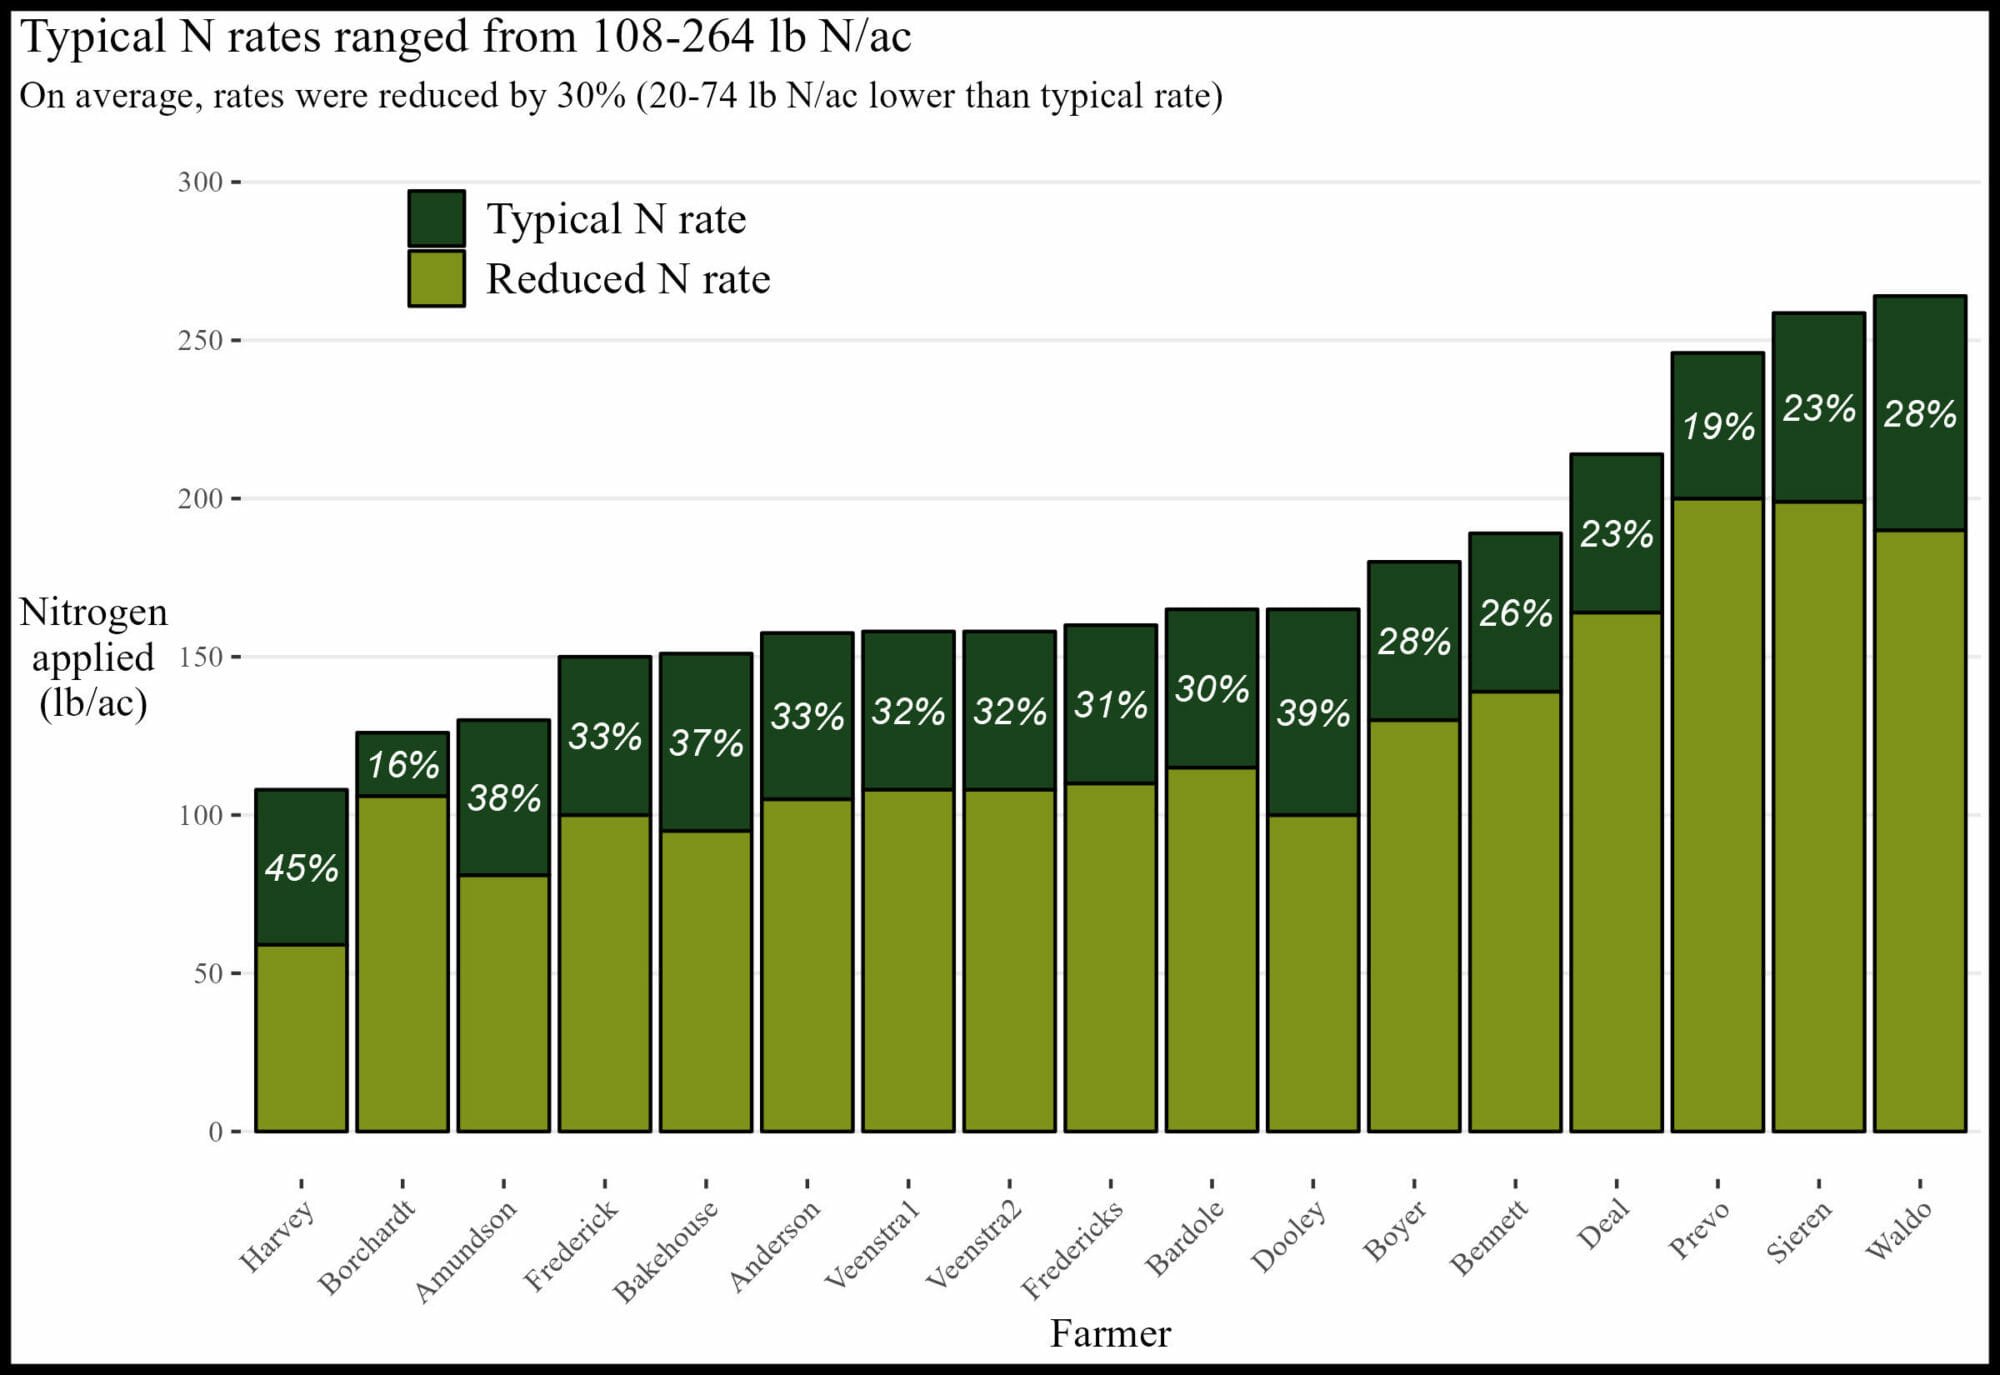
Sixteen farmers conducted a total of 17 independent N trials. The chosen treatments reflected the diversity in farming systems, with typical N rates ranging from 108-264 lb N/ac and reduced N rates ranging from 59-200 lb N/ac (Figure 2). When averaged over all trials, typical and reduced N rate treatments were 175 lb N/ac and 124 lb N/ac, respectively.
Conclusions and Next Steps
Of the 17 trials conducted, seven (41%) likely saved money in the reduced N treatment (dark blue bars in Figures 4 and 5). Ten (59%) likely lost money in the reduced N treatment, and those farmers may want to gain another year of data at the aggressive reduction rate or explore a less aggressive rate. It is clear these results were valuable for the farmers. Many, like Pete Bardole, told us they expected the yield reductions to be larger. The weather certainly played a part in the results - in general dry conditions render corn less responsive to N inputs, so it is important to remember 2022 results are not necessarily predictive of future outcomes. It is clear the farmers conducting these trials fully embrace this caveat. However, all the farmers gained useful experience in exploring the impact of reducing N rates on their finances. As the first year of a multi-year project wraps up, farmers are already looking forward to increasing the number of datapoints collected under this project’s umbrella in the coming years. As more farmers contribute their data to this project, the power of the results will only continue to grow. Bill Frederick summed up the first year of this project nicely: “My search for optimum N rates isn't over yet.”
APPENDIX A. ALEC & RACHEL AMUNDSON, OSAGE IA
“[We] had some understanding of how to cut N when planting into clover, this was a great way to verify our thinking.”
The financial outcome at the reduced N rate was likely a financial loss compared to the typical N rate. A 49 lb N/ac reduction was likely too large this year, but there may be potential for financial savings with a smaller N reduction.
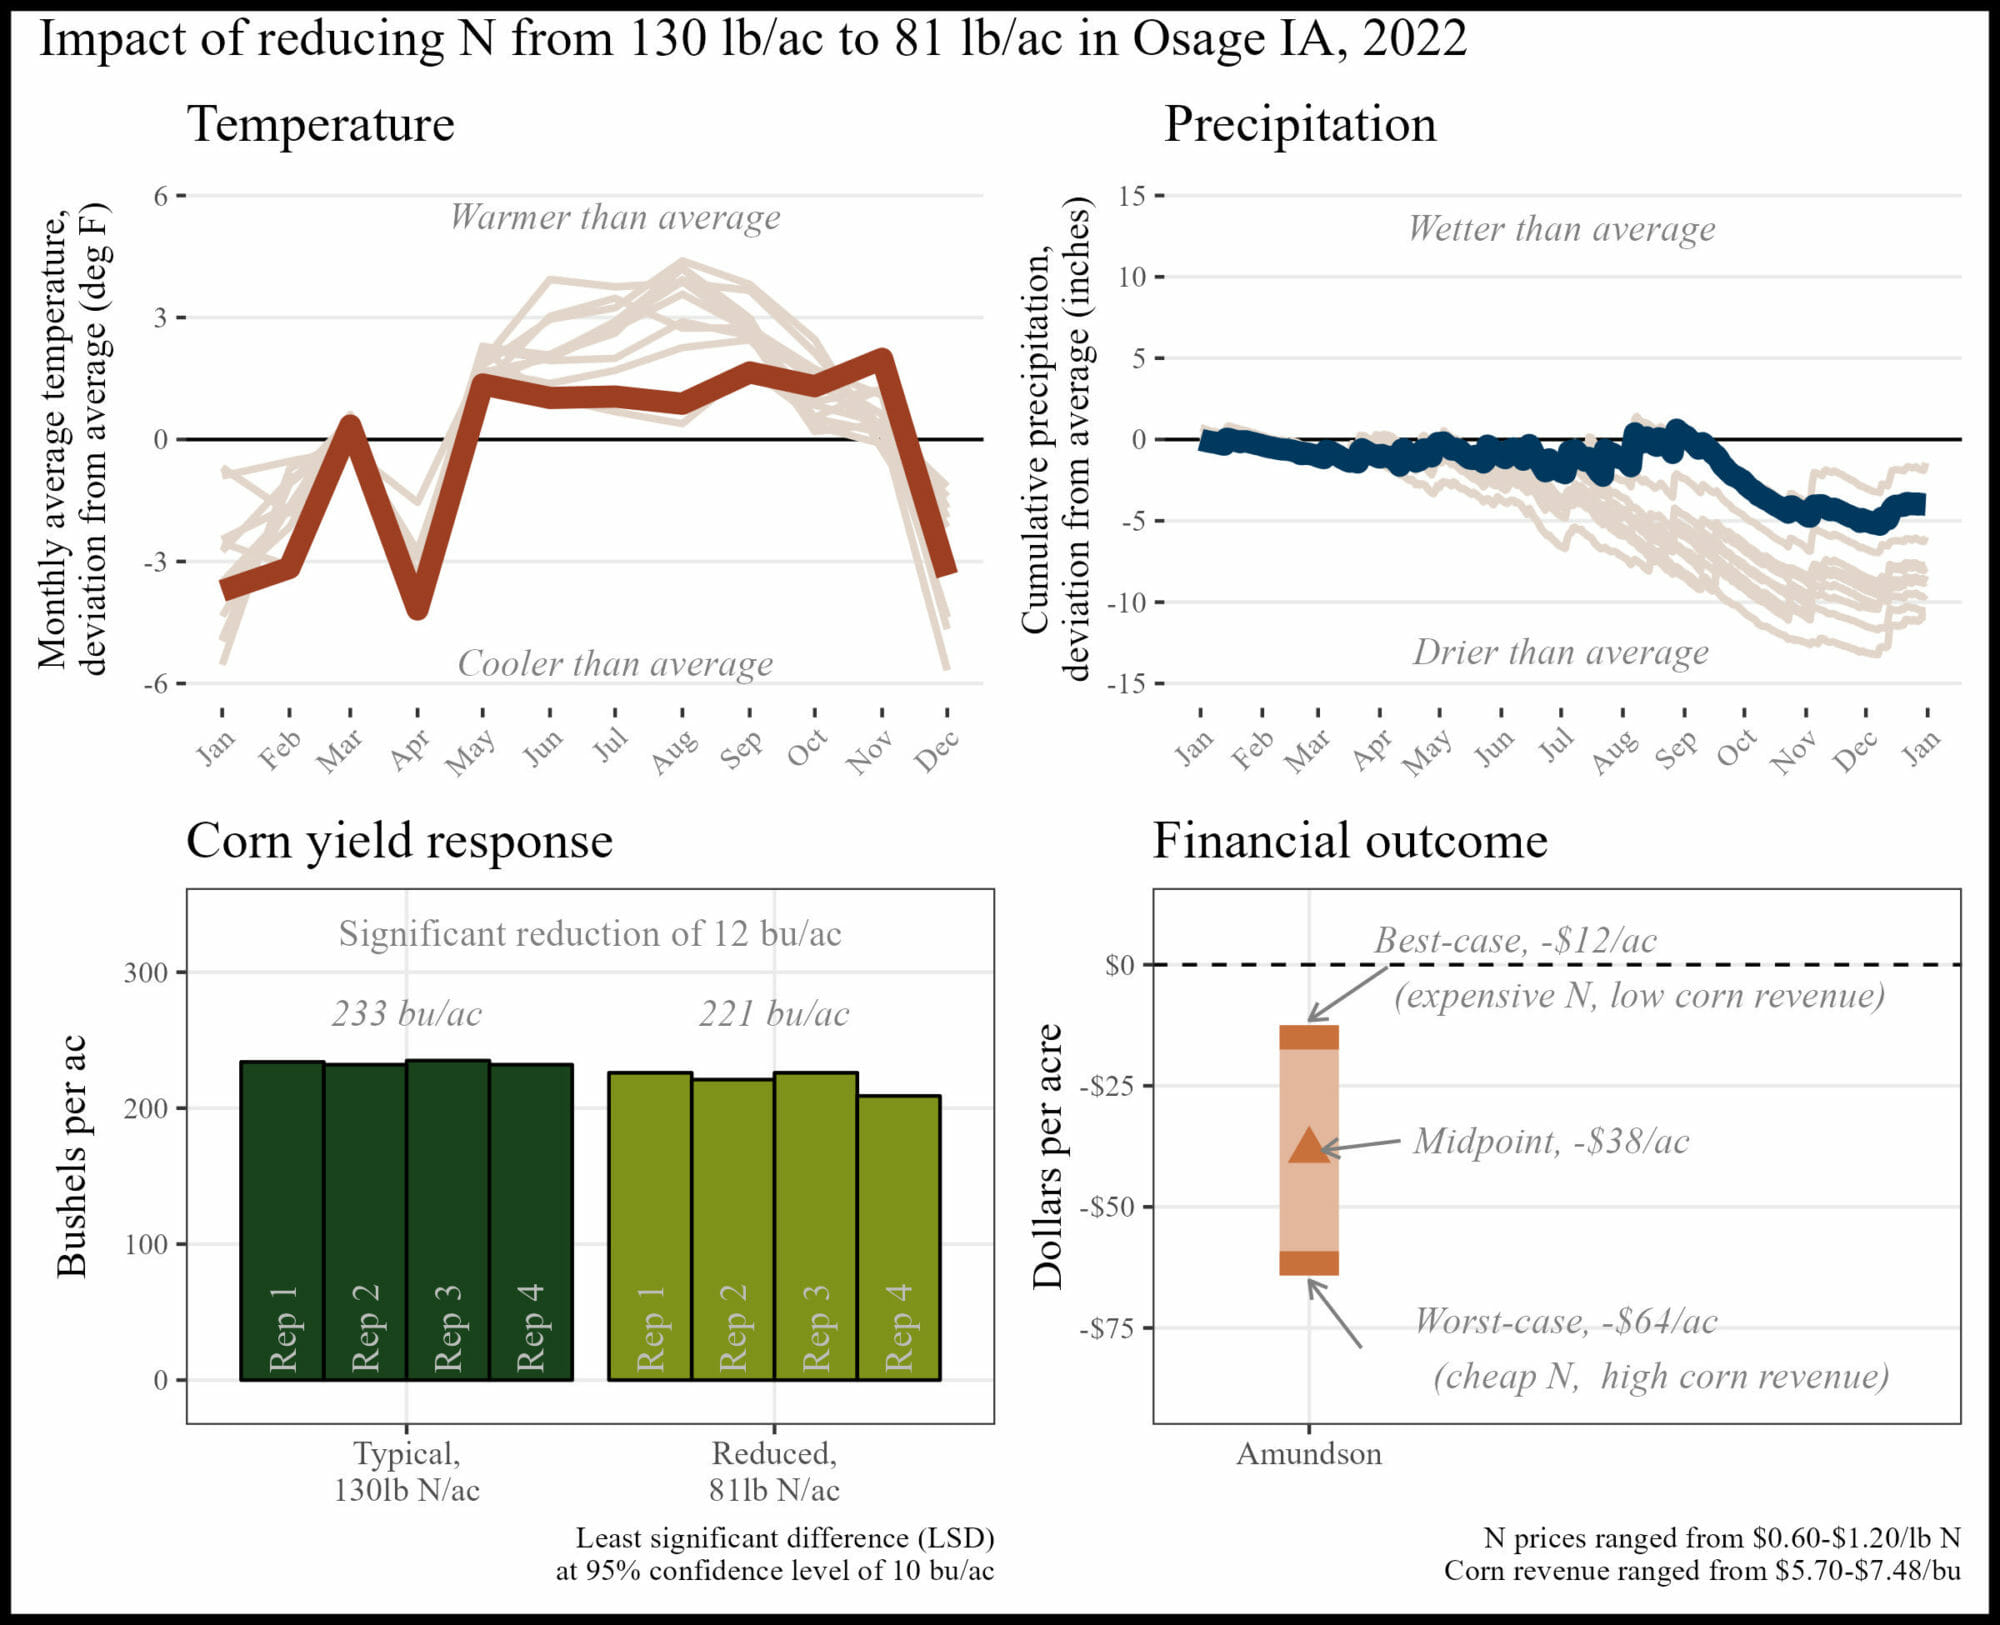
Strip-till corn, no-till soybeans, cereal rye cover crop Previous crop: Oats/red clover cover crop Replications and plot size: 4 reps, 1.7 acre strips Corn planting/harvest date: May 14, 2022/October 23, 2022 Corn row spacing/planting density: 30 inch; 33,000 seeds/ac Nitrogen sources and timing: Chemical sources; fall, spring, and side-dress
APPENDIX B. NATHAN ANDERSON, AURELIA IA
“I hope my research site, combined with other farmer-cooperator sites…can reform the narrative around nitrogen fertilization and use for the benefit of farmers and the environment.”
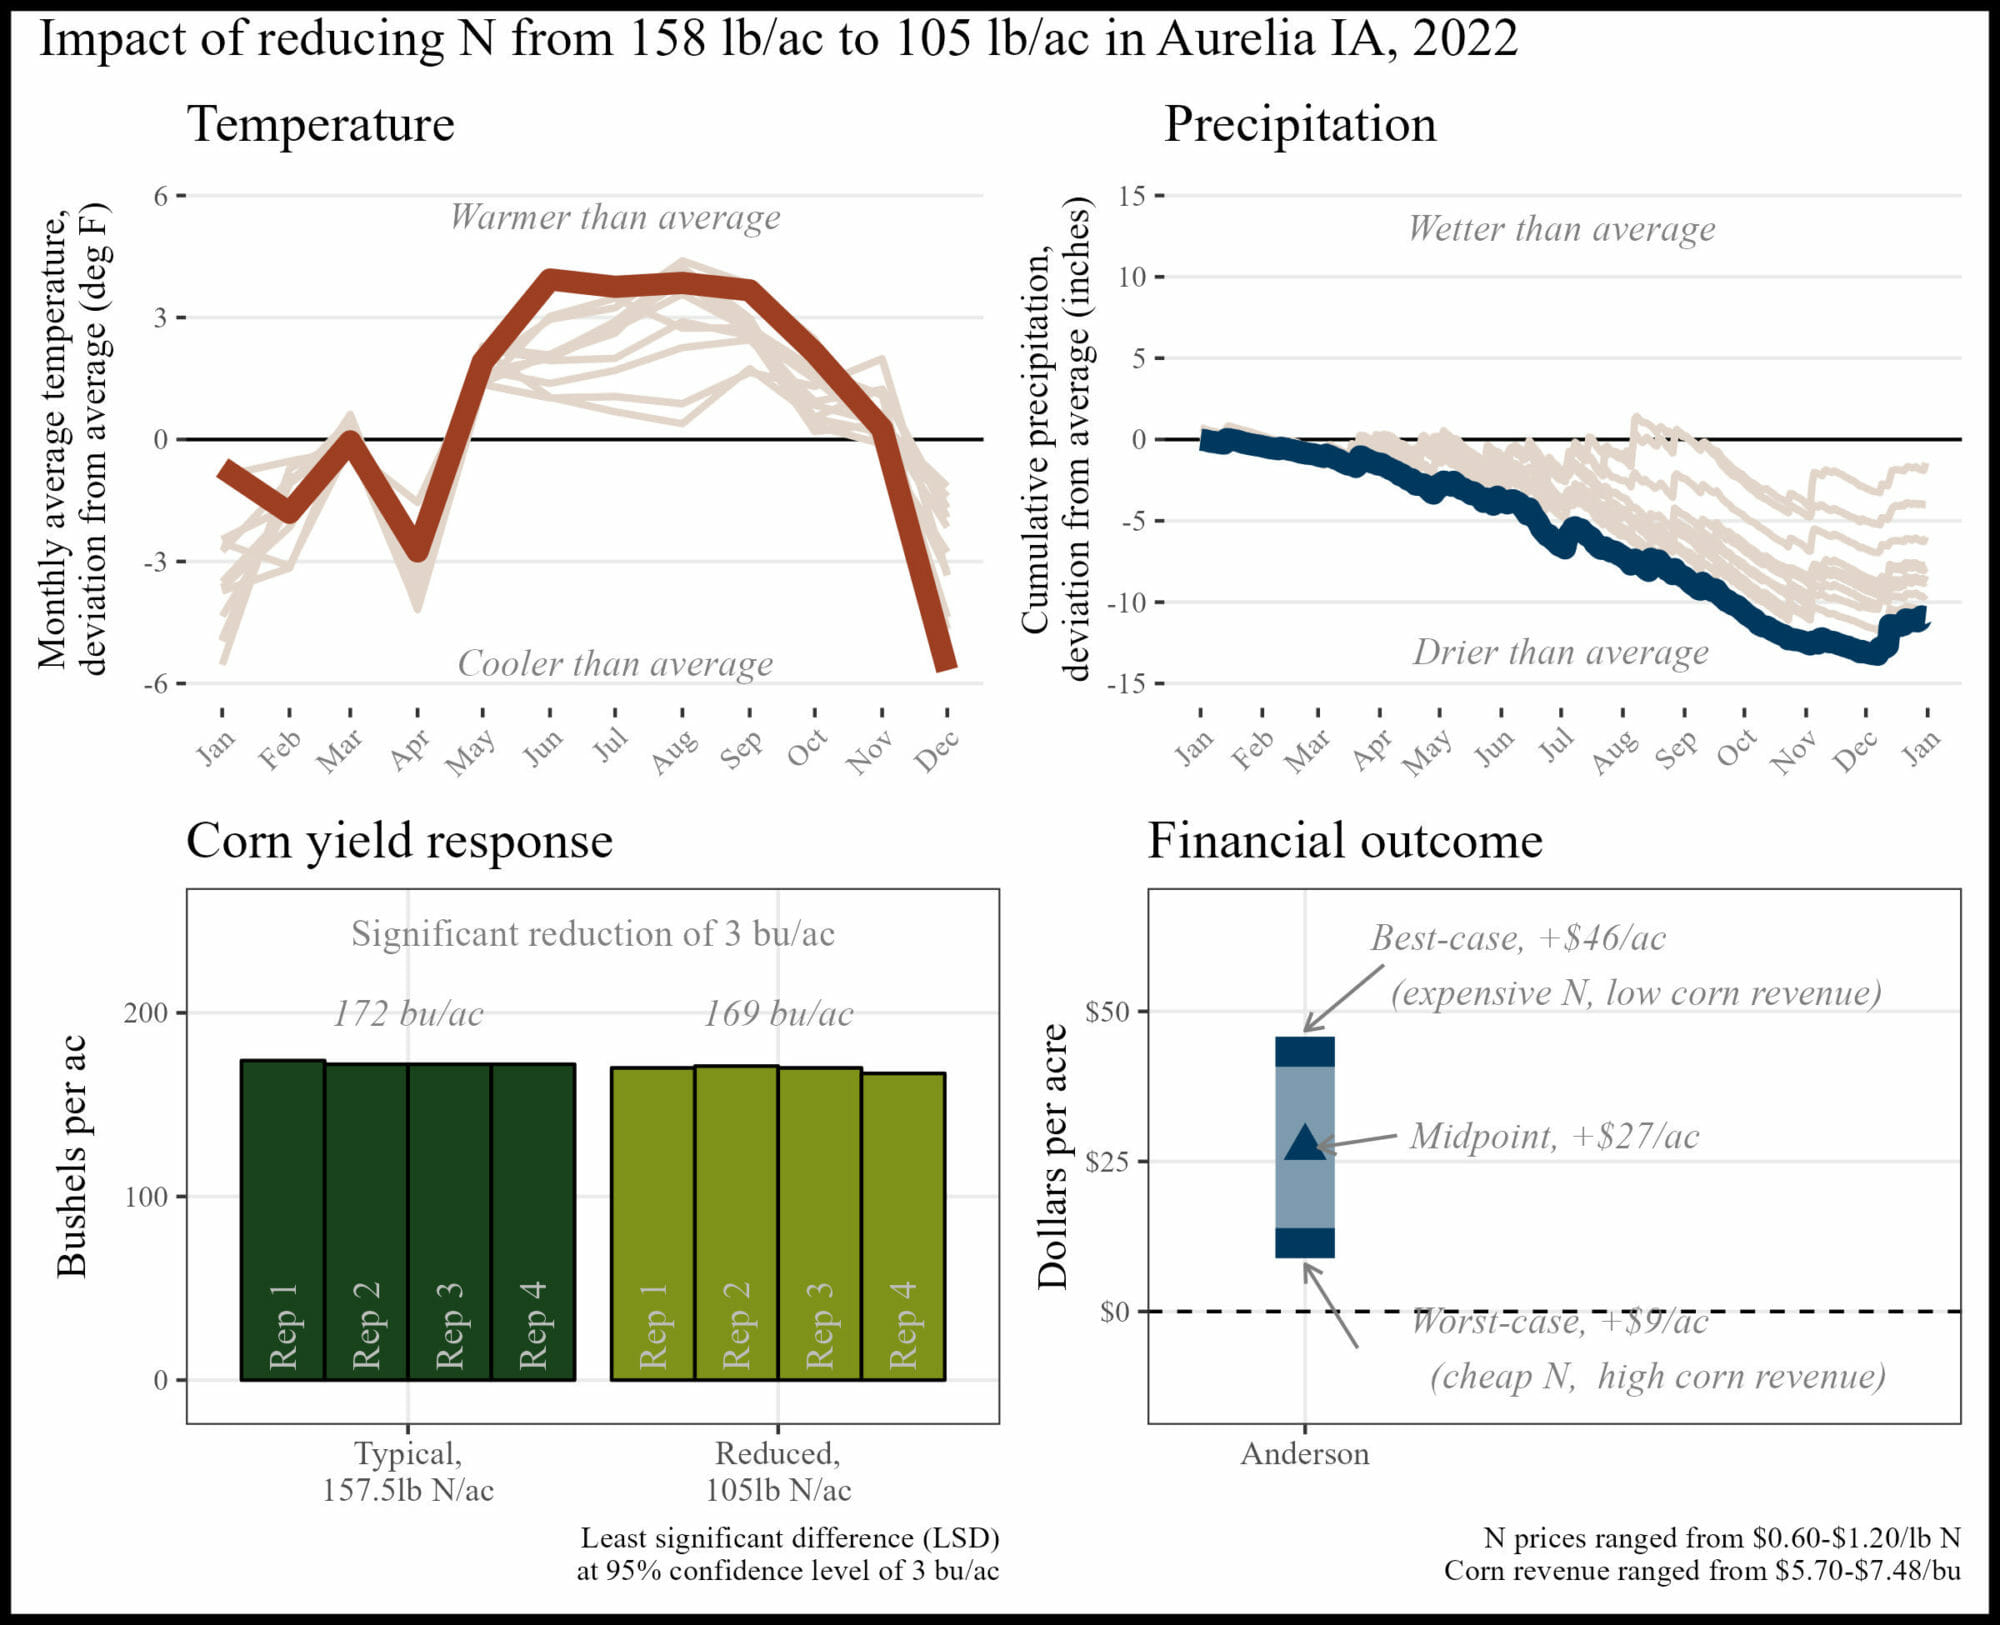
The financial outcome at the reduced N rate was likely a financial savings compared to the typical N rate. A 53 lb N/ac reduction saved money this year.
 Historical cropping system (5 year): No-till corn, no-till soybeans, cereal rye cover crops, grazing
Previous crop: Corn and cereal rye cover crop
Replications and plot size: 4 reps, 1.5 acre strips
Corn planting/harvest date: May 19, 2022/October 14, 2022
Corn row spacing/planting density: 30 inch; 35,500 seeds/ac
Nitrogen sources and timing: Organic, chemical; winter, at planting, side-dress
Historical cropping system (5 year): No-till corn, no-till soybeans, cereal rye cover crops, grazing
Previous crop: Corn and cereal rye cover crop
Replications and plot size: 4 reps, 1.5 acre strips
Corn planting/harvest date: May 19, 2022/October 14, 2022
Corn row spacing/planting density: 30 inch; 35,500 seeds/ac
Nitrogen sources and timing: Organic, chemical; winter, at planting, side-dress
APPENDIX C. JON BAKEHOUSE, HASTINGS IA
“[These trials will] give me confidence to either reduce N rates or be secure in the knowledge we aren’t over-applying nutrients.”
The financial outcome at the reduced N rate was likely a financial loss compared to the typical N rate. A 56 lb N/ac reduction was likely too large this year, but there may be potential for financial savings with a smaller N reduction.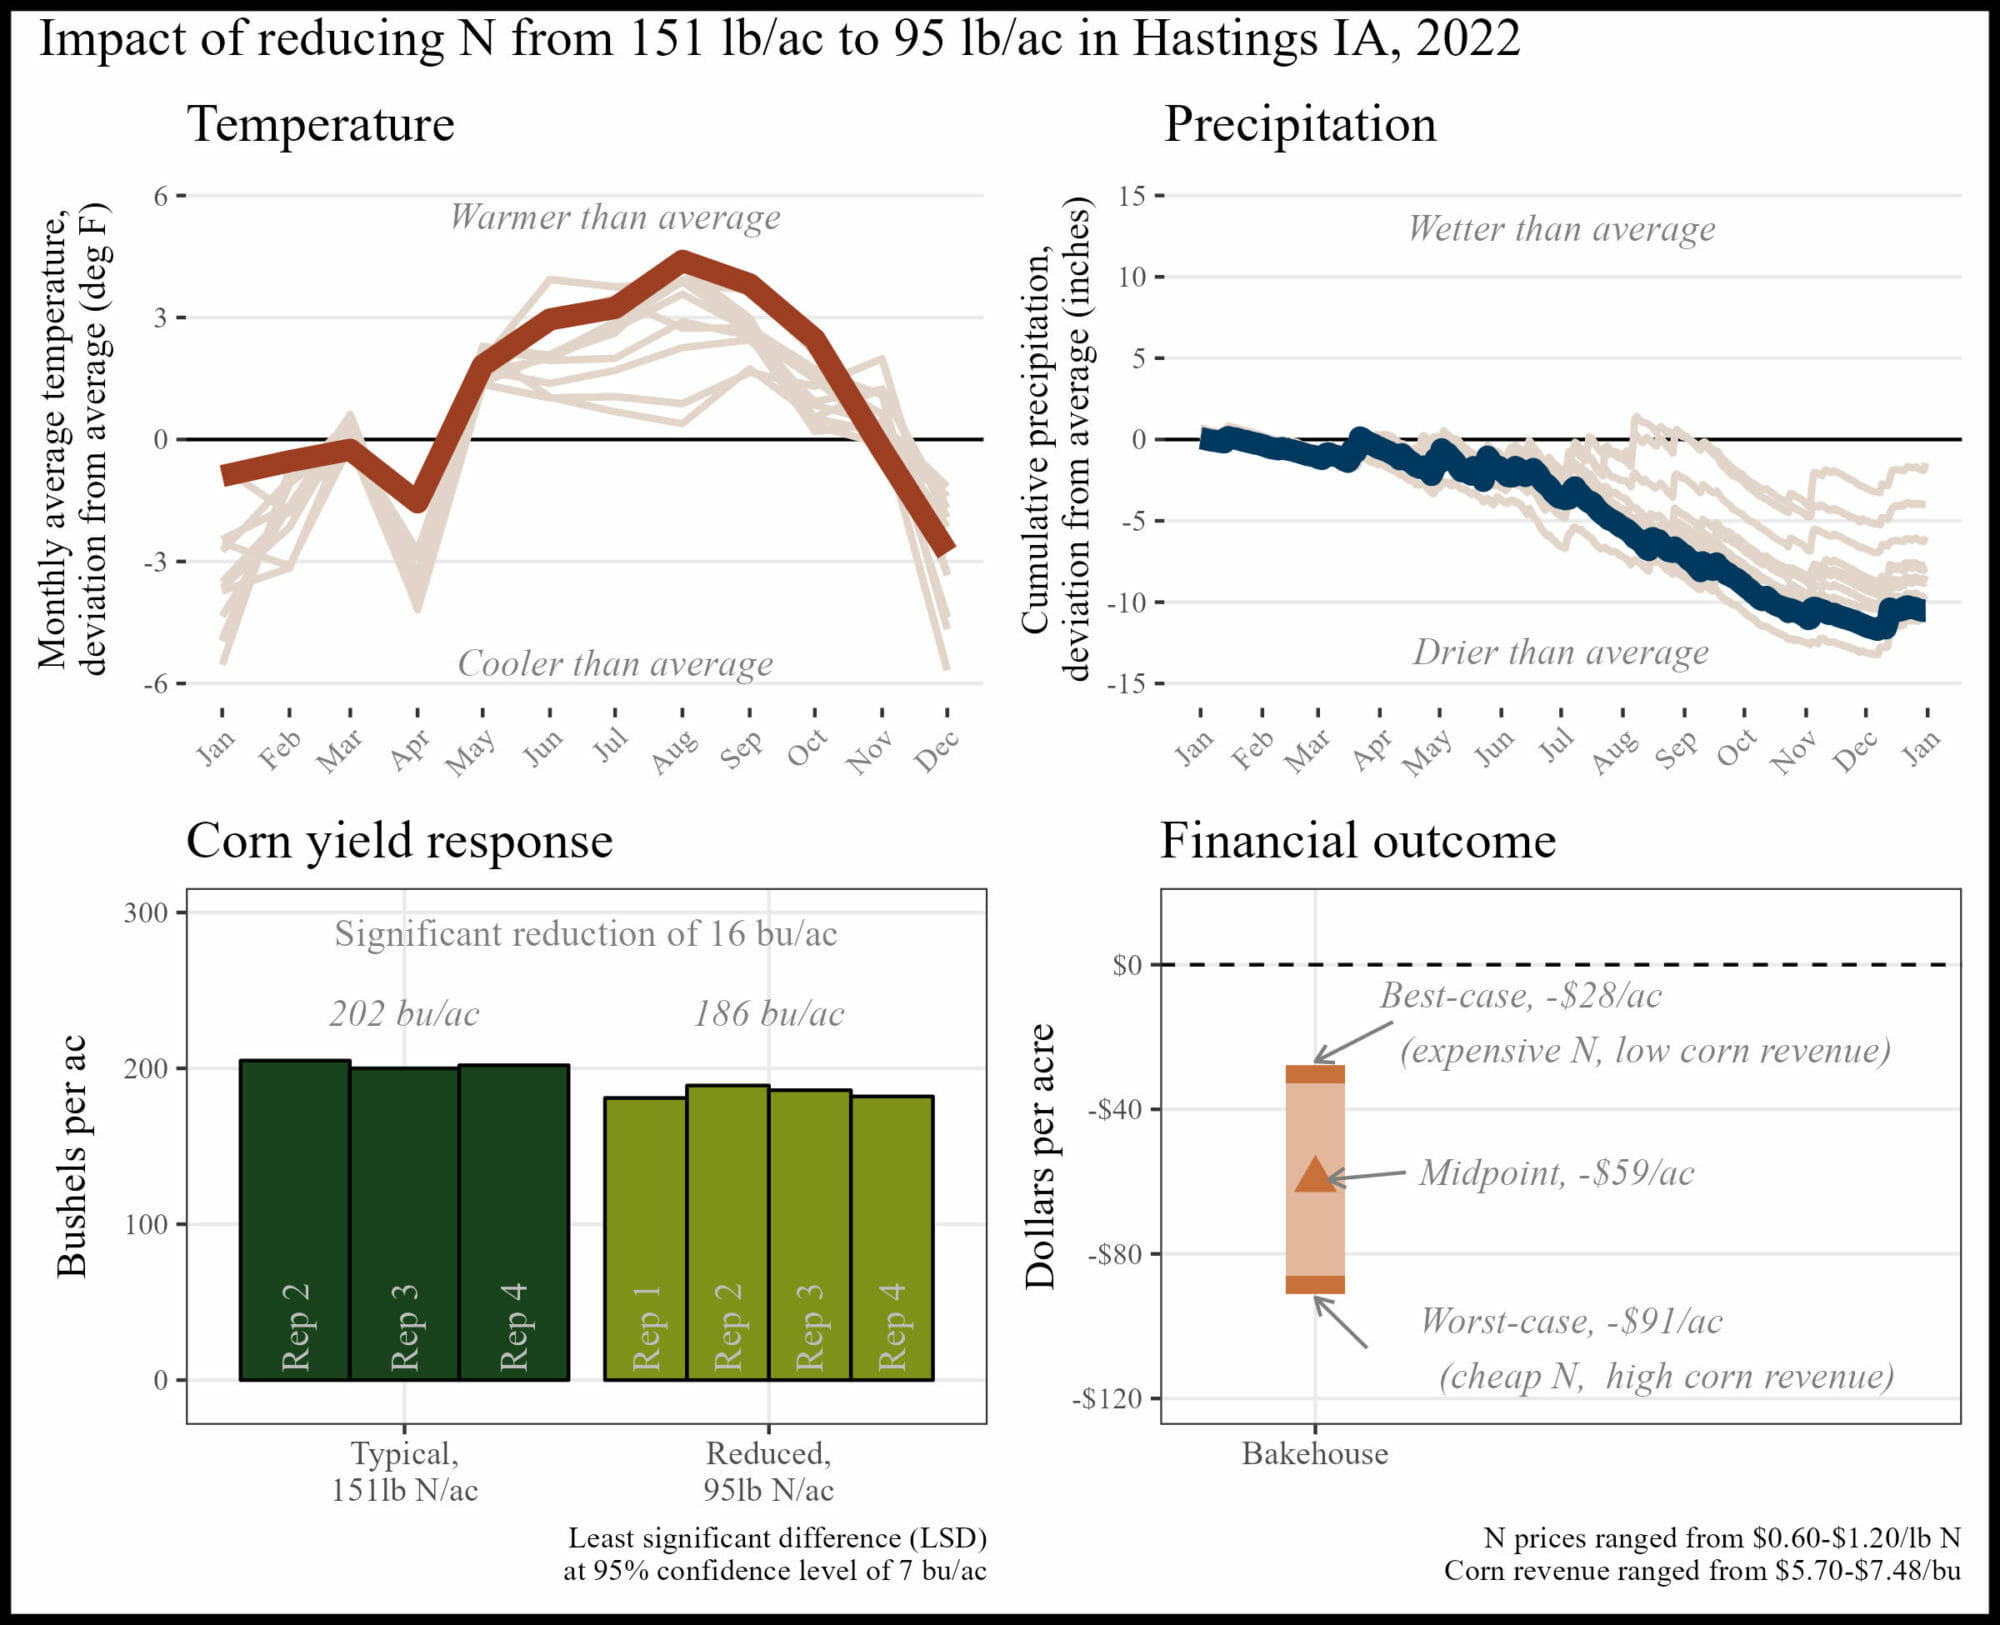 Historical cropping system (5 year): No-till corn, no-till soybeans, cereal rye cover crop, grazing
Previous crop: Soybeans
Replications and plot size: 4 reps, 0.4 acre strips
Corn planting/harvest date: May 11, 2022/September 29, 2022
Corn row spacing/planting density: 30 inch; 34,000 seeds/ac
Nitrogen sources and timing: Chemical; pre-plant, side-dress
Historical cropping system (5 year): No-till corn, no-till soybeans, cereal rye cover crop, grazing
Previous crop: Soybeans
Replications and plot size: 4 reps, 0.4 acre strips
Corn planting/harvest date: May 11, 2022/September 29, 2022
Corn row spacing/planting density: 30 inch; 34,000 seeds/ac
Nitrogen sources and timing: Chemical; pre-plant, side-dress
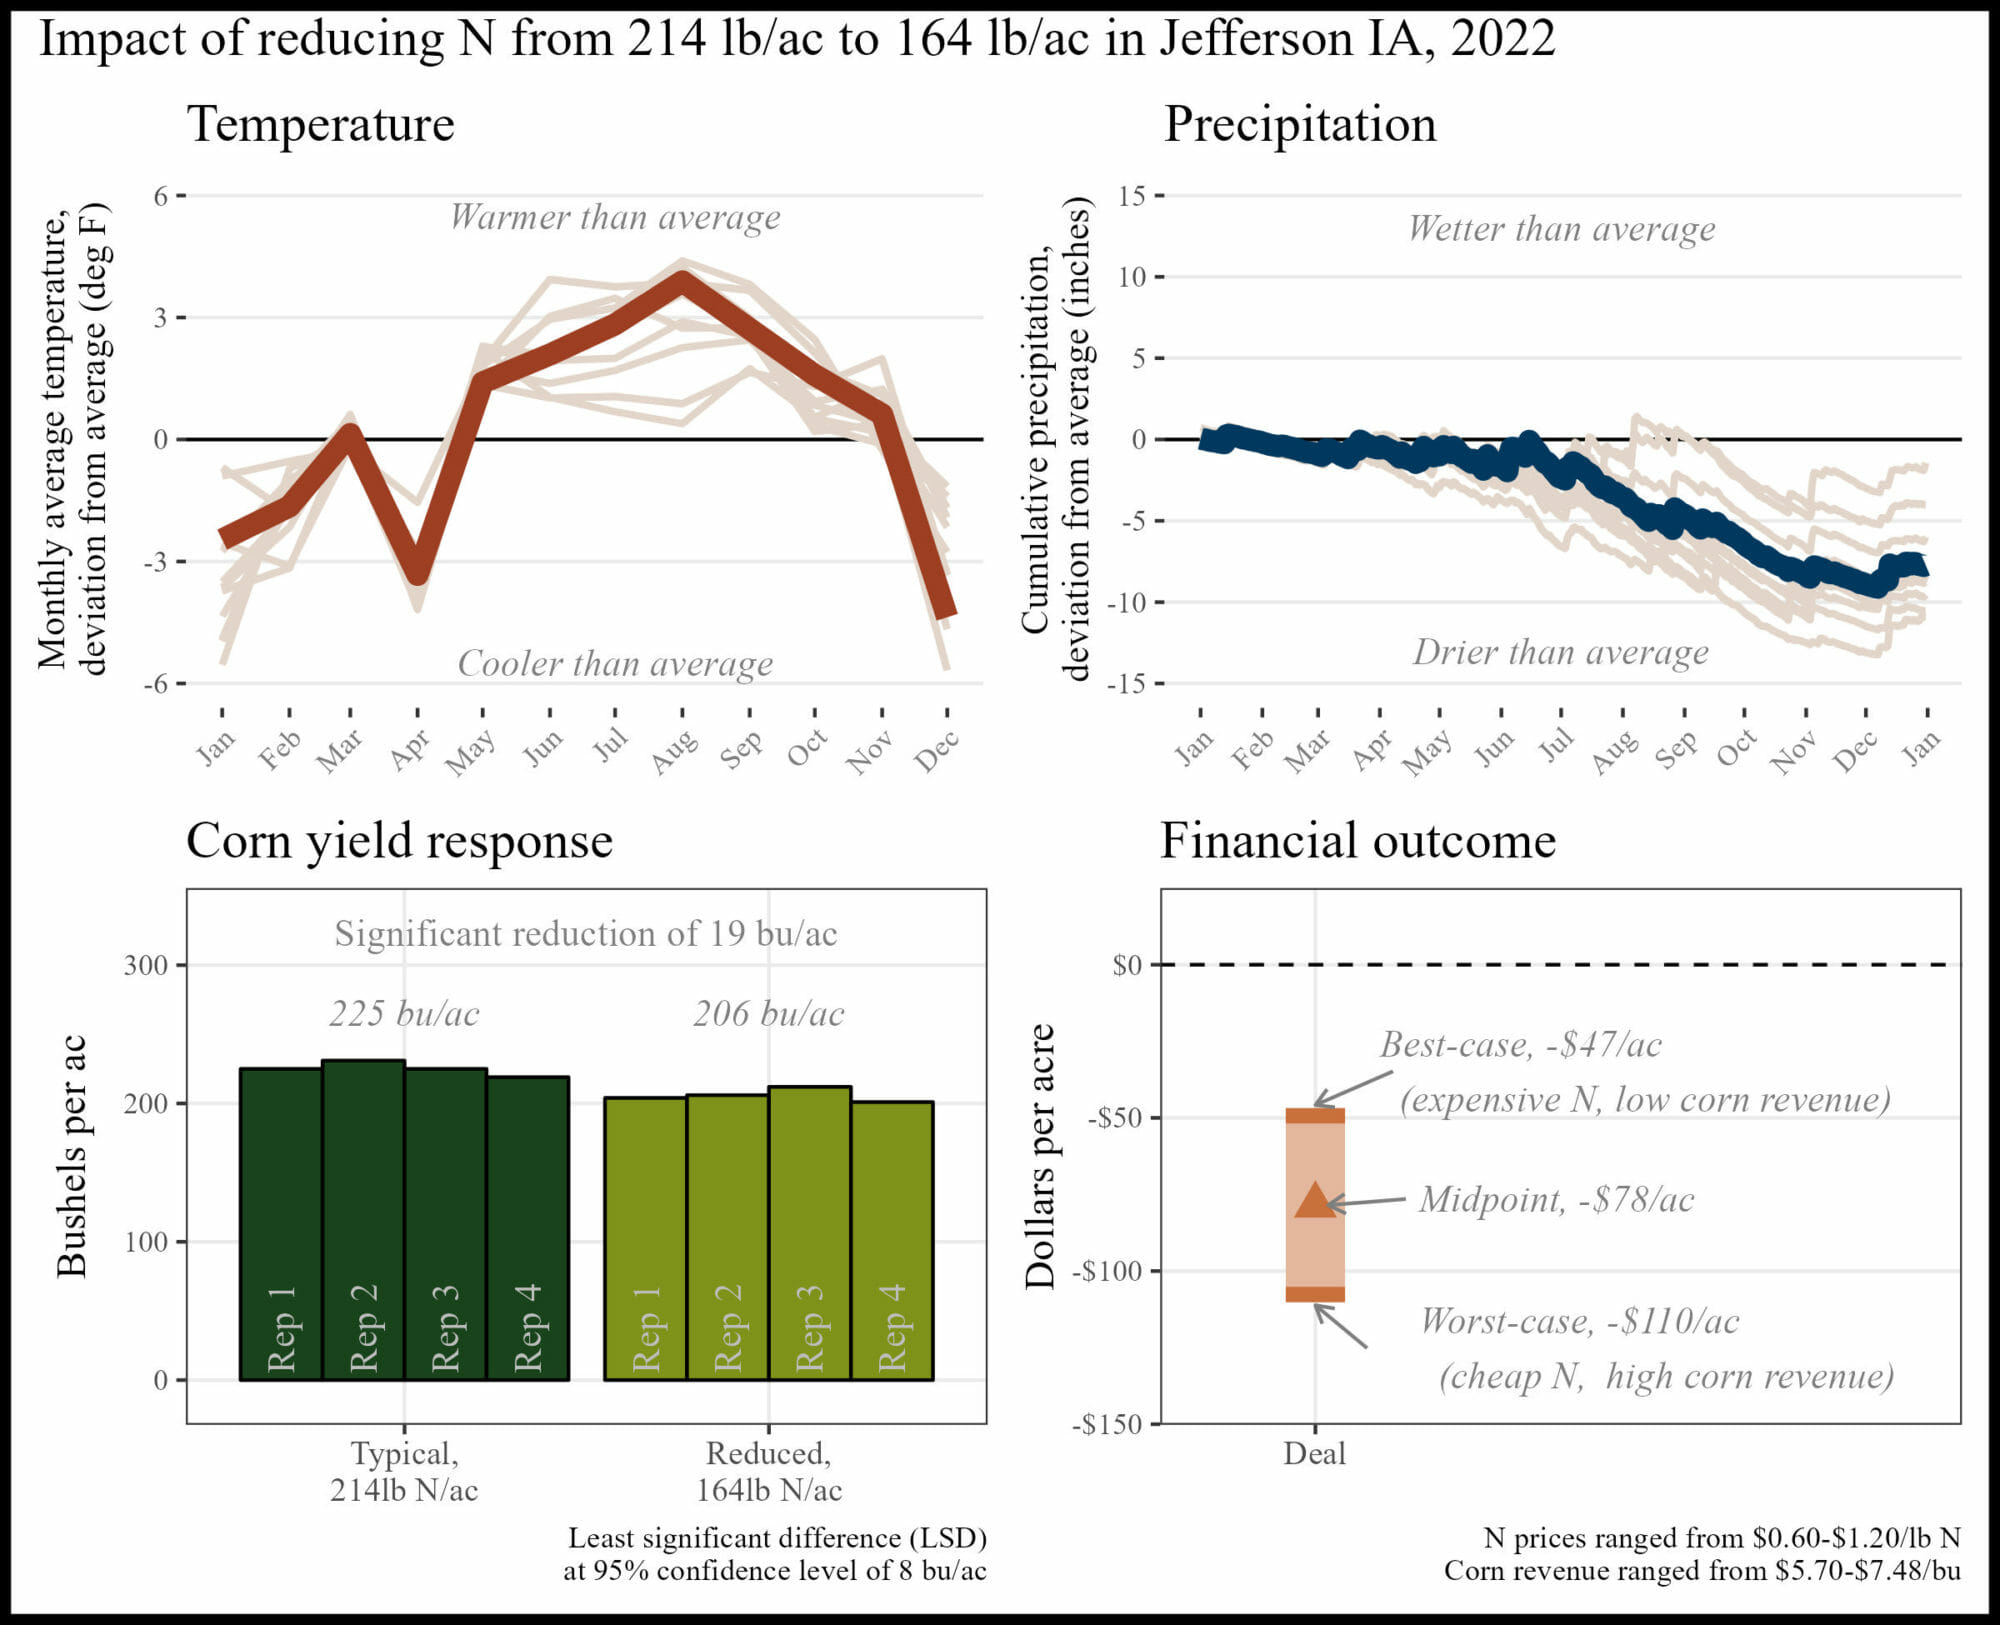
APPENDIX D. PETE BARDOLE, JEFFERSON IA
“I thought the yield reduction would be higher.”
The financial outcome at the reduced N rate was likely a financial loss compared to the typical N rate. A 50 lb N/ac reduction was likely too large this year, but there may be potential for financial savings with a smaller N reduction.
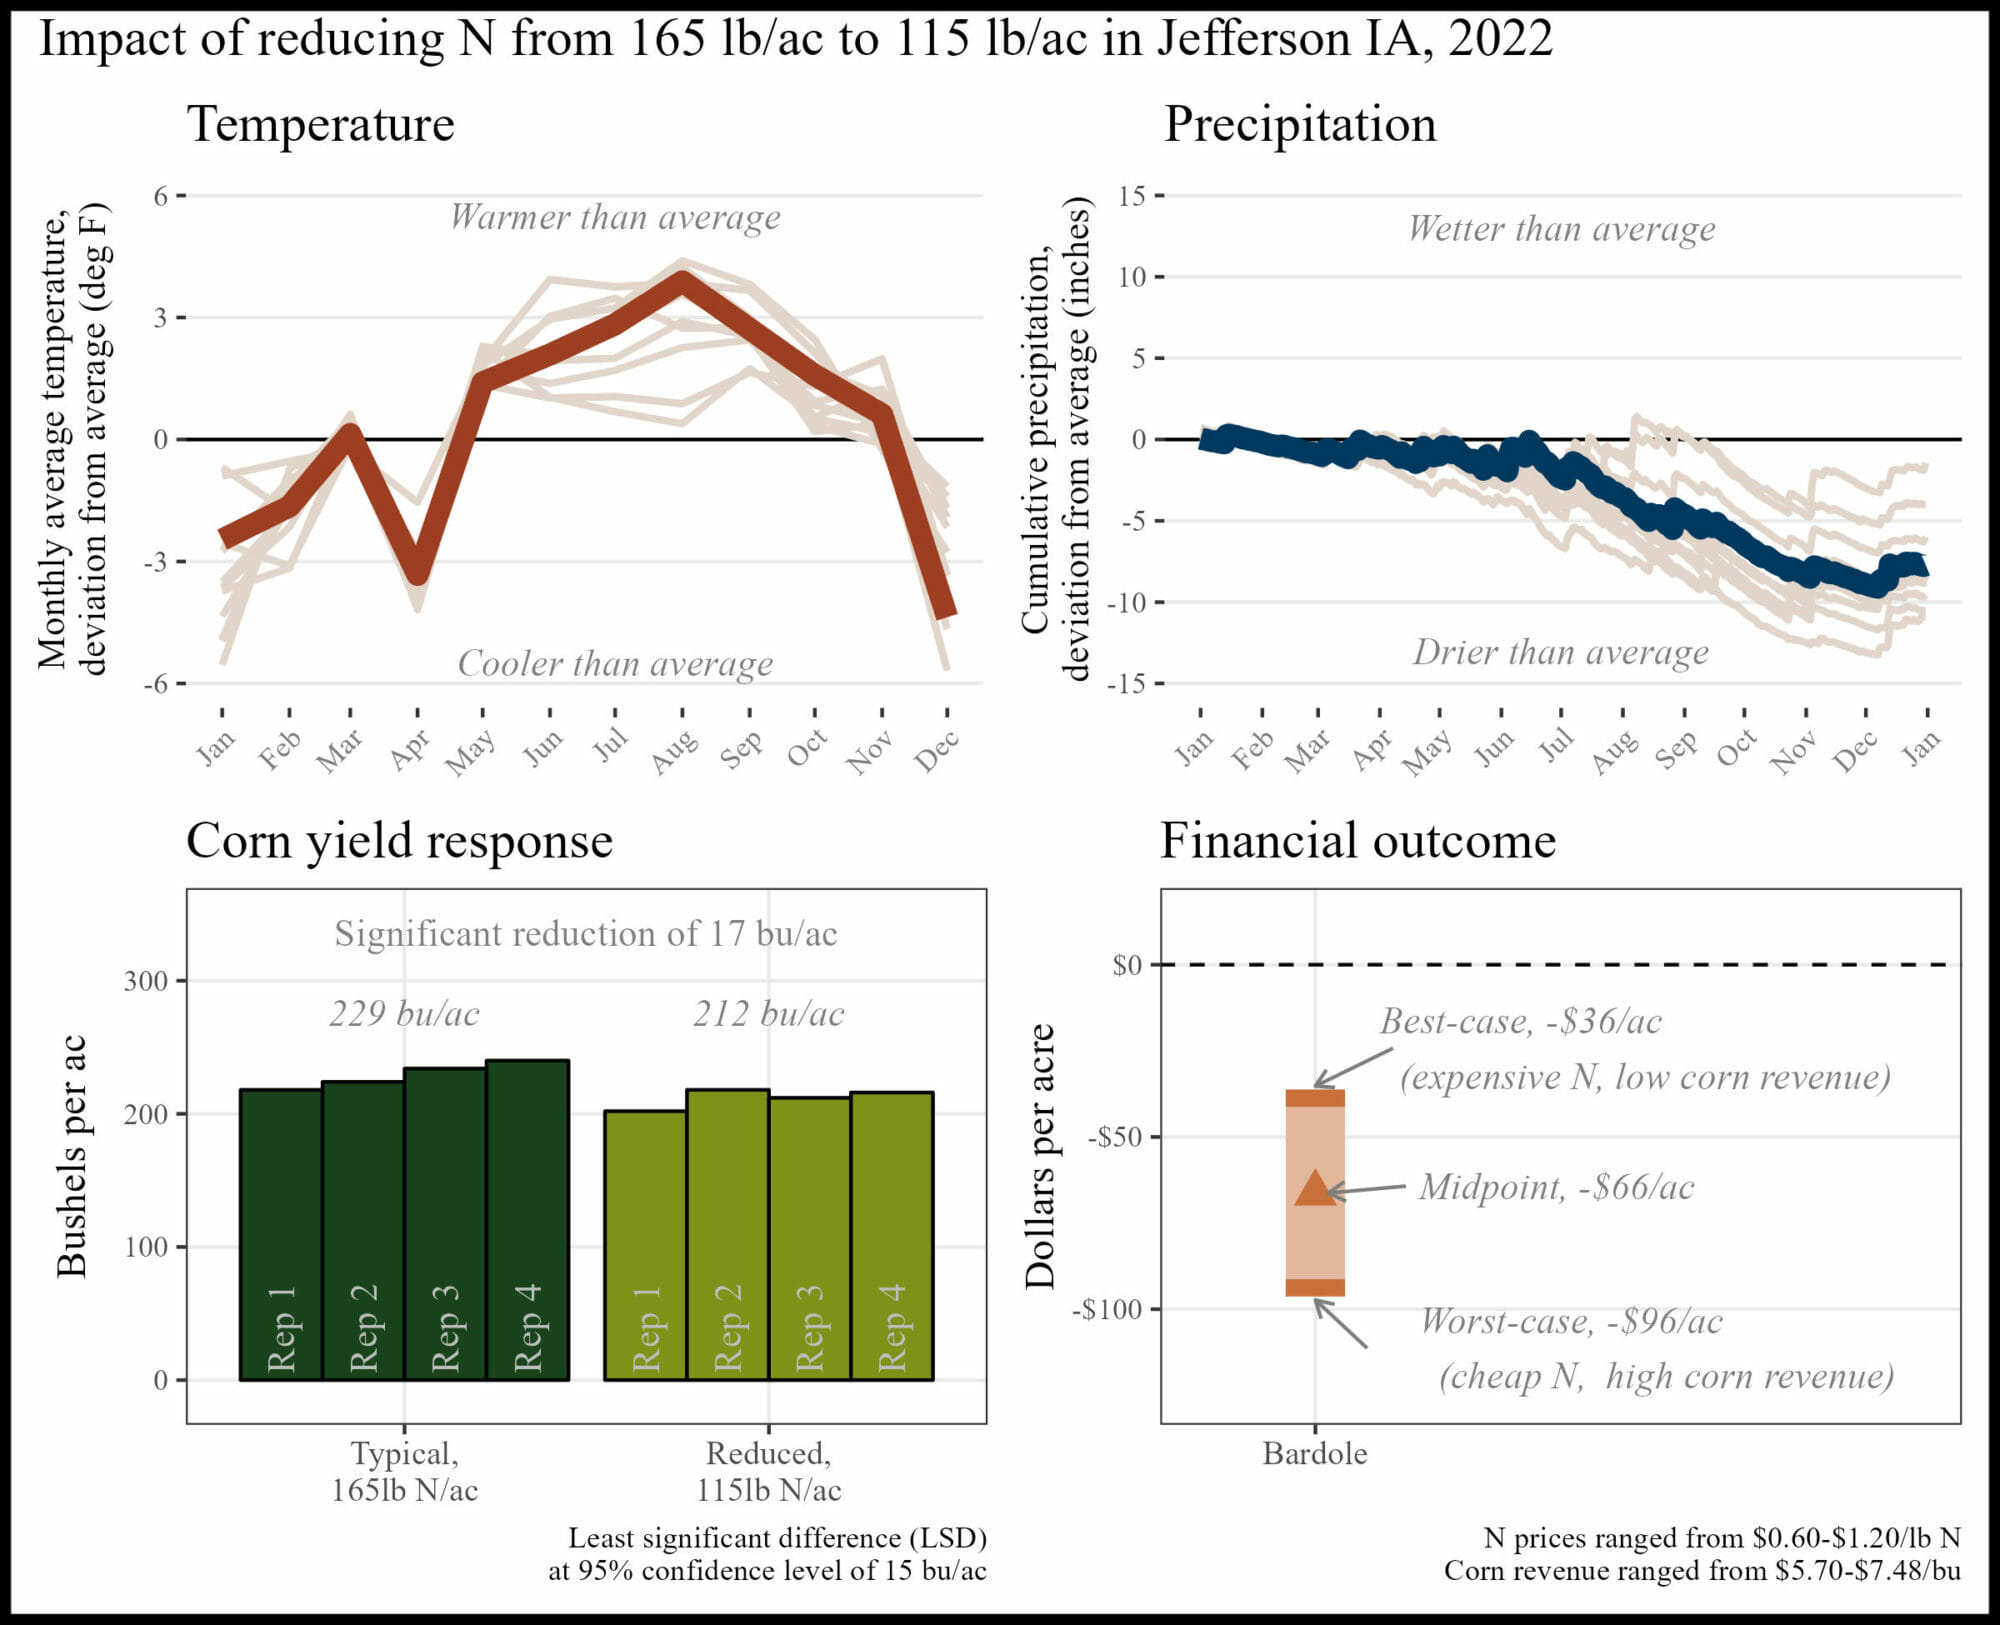 Historical cropping system (5 year): Strip-till corn, no-till soybeans, oats/turnip cover crop
Previous crop: Soybeans and oats + turnip cover crop
Replications and plot size: 4 reps, 0.4 acre strips
Corn planting/harvest date: April 23, 2022/October 3, 2022
Corn row spacing/planting density: 30 inch; 34,000 seeds/ac
Nitrogen sources and timing: Chemical; fall, side-dress
Historical cropping system (5 year): Strip-till corn, no-till soybeans, oats/turnip cover crop
Previous crop: Soybeans and oats + turnip cover crop
Replications and plot size: 4 reps, 0.4 acre strips
Corn planting/harvest date: April 23, 2022/October 3, 2022
Corn row spacing/planting density: 30 inch; 34,000 seeds/ac
Nitrogen sources and timing: Chemical; fall, side-dress
APPENDIX E. SAM BENNETT, GALVA IA
“I knew we could grow good corn with less N, but knowing what happens when corn runs out of N, I habitually over apply fertilizer. This trial helped give me the confidence to take a deeper look at what rates I'm planning to apply.”
The financial outcome at the reduced N rate was likely a financial savings compared to the typical N rate. A 50 lb N/ac reduction saved money this year.
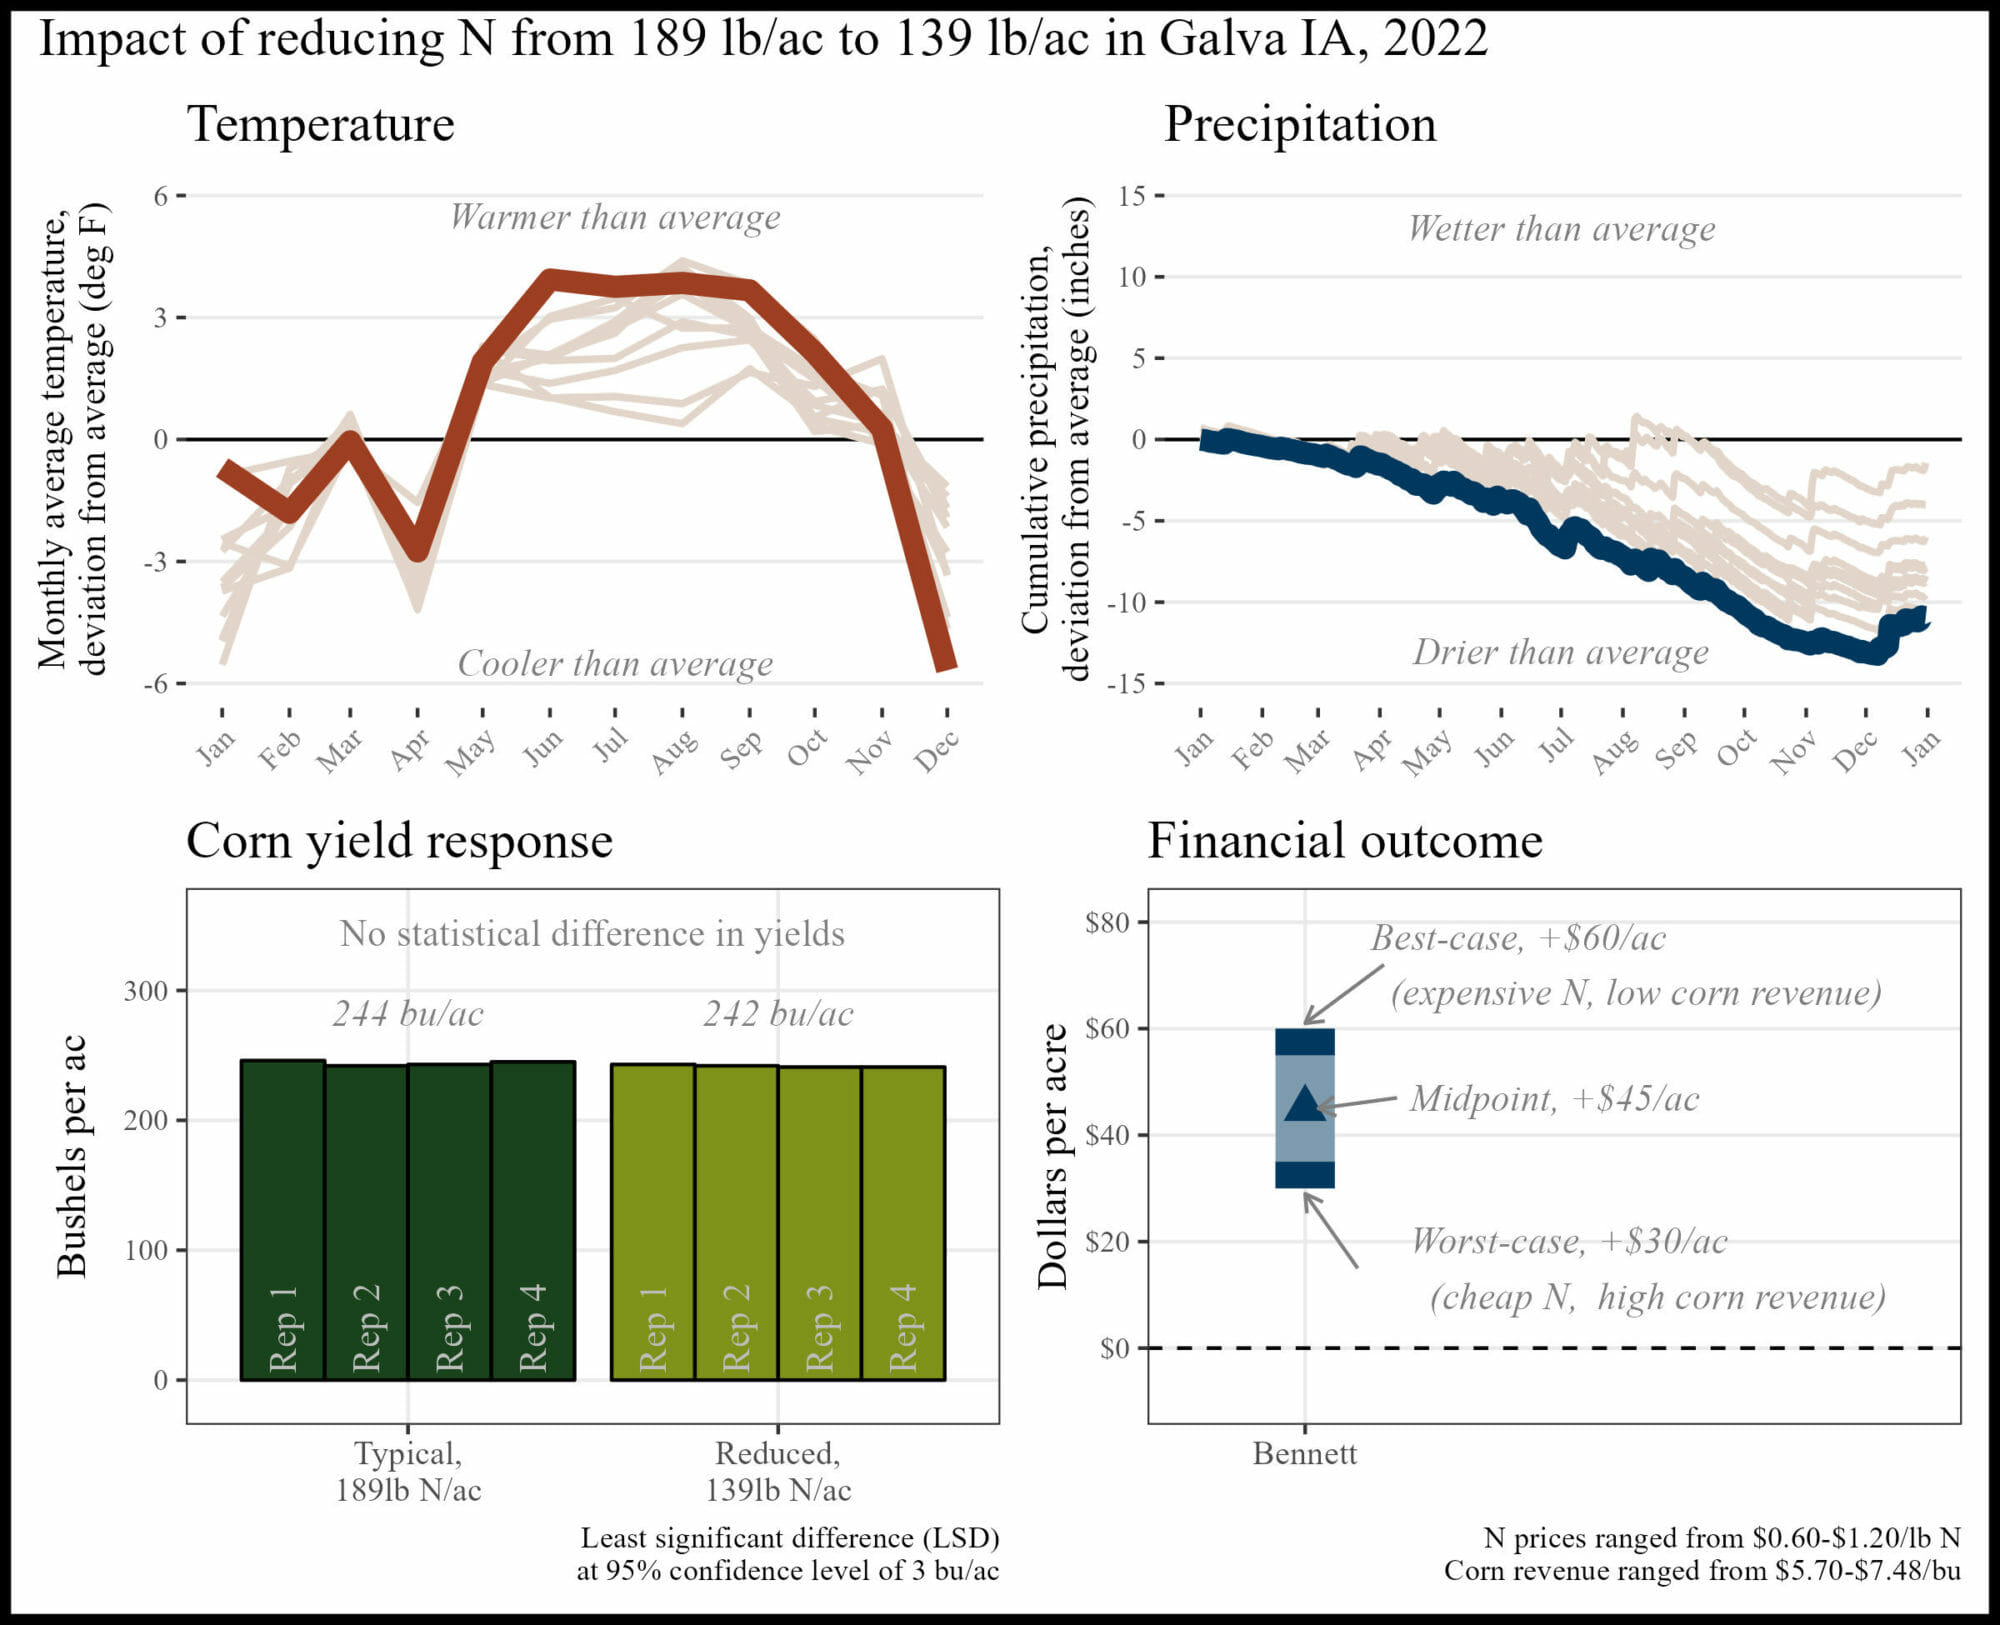 Historical cropping system (5 year): Strip-till corn, no-till soybeans, cereal rye cover crop
Previous crop: Soybeans
Replications and plot size: 4 reps, 0.4 acre strips
Corn planting/harvest date: May 8, 2022/October 18, 2022
Corn row spacing/planting density: 30 inch; 34,000 seeds/ac
Nitrogen sources and timing: Chemical; fall, side-dress
Historical cropping system (5 year): Strip-till corn, no-till soybeans, cereal rye cover crop
Previous crop: Soybeans
Replications and plot size: 4 reps, 0.4 acre strips
Corn planting/harvest date: May 8, 2022/October 18, 2022
Corn row spacing/planting density: 30 inch; 34,000 seeds/ac
Nitrogen sources and timing: Chemical; fall, side-dress
APPENDIX F. VAUGHN BORCHARDT, FENTON IA
“Probably should've had an additional 20# check.”
The financial outcome at the reduced N rate was likely a financial loss compared to the typical N rate. A 20 lb N/ac reduction was likely too large this year, but there may be potential for financial savings with a smaller N reduction.
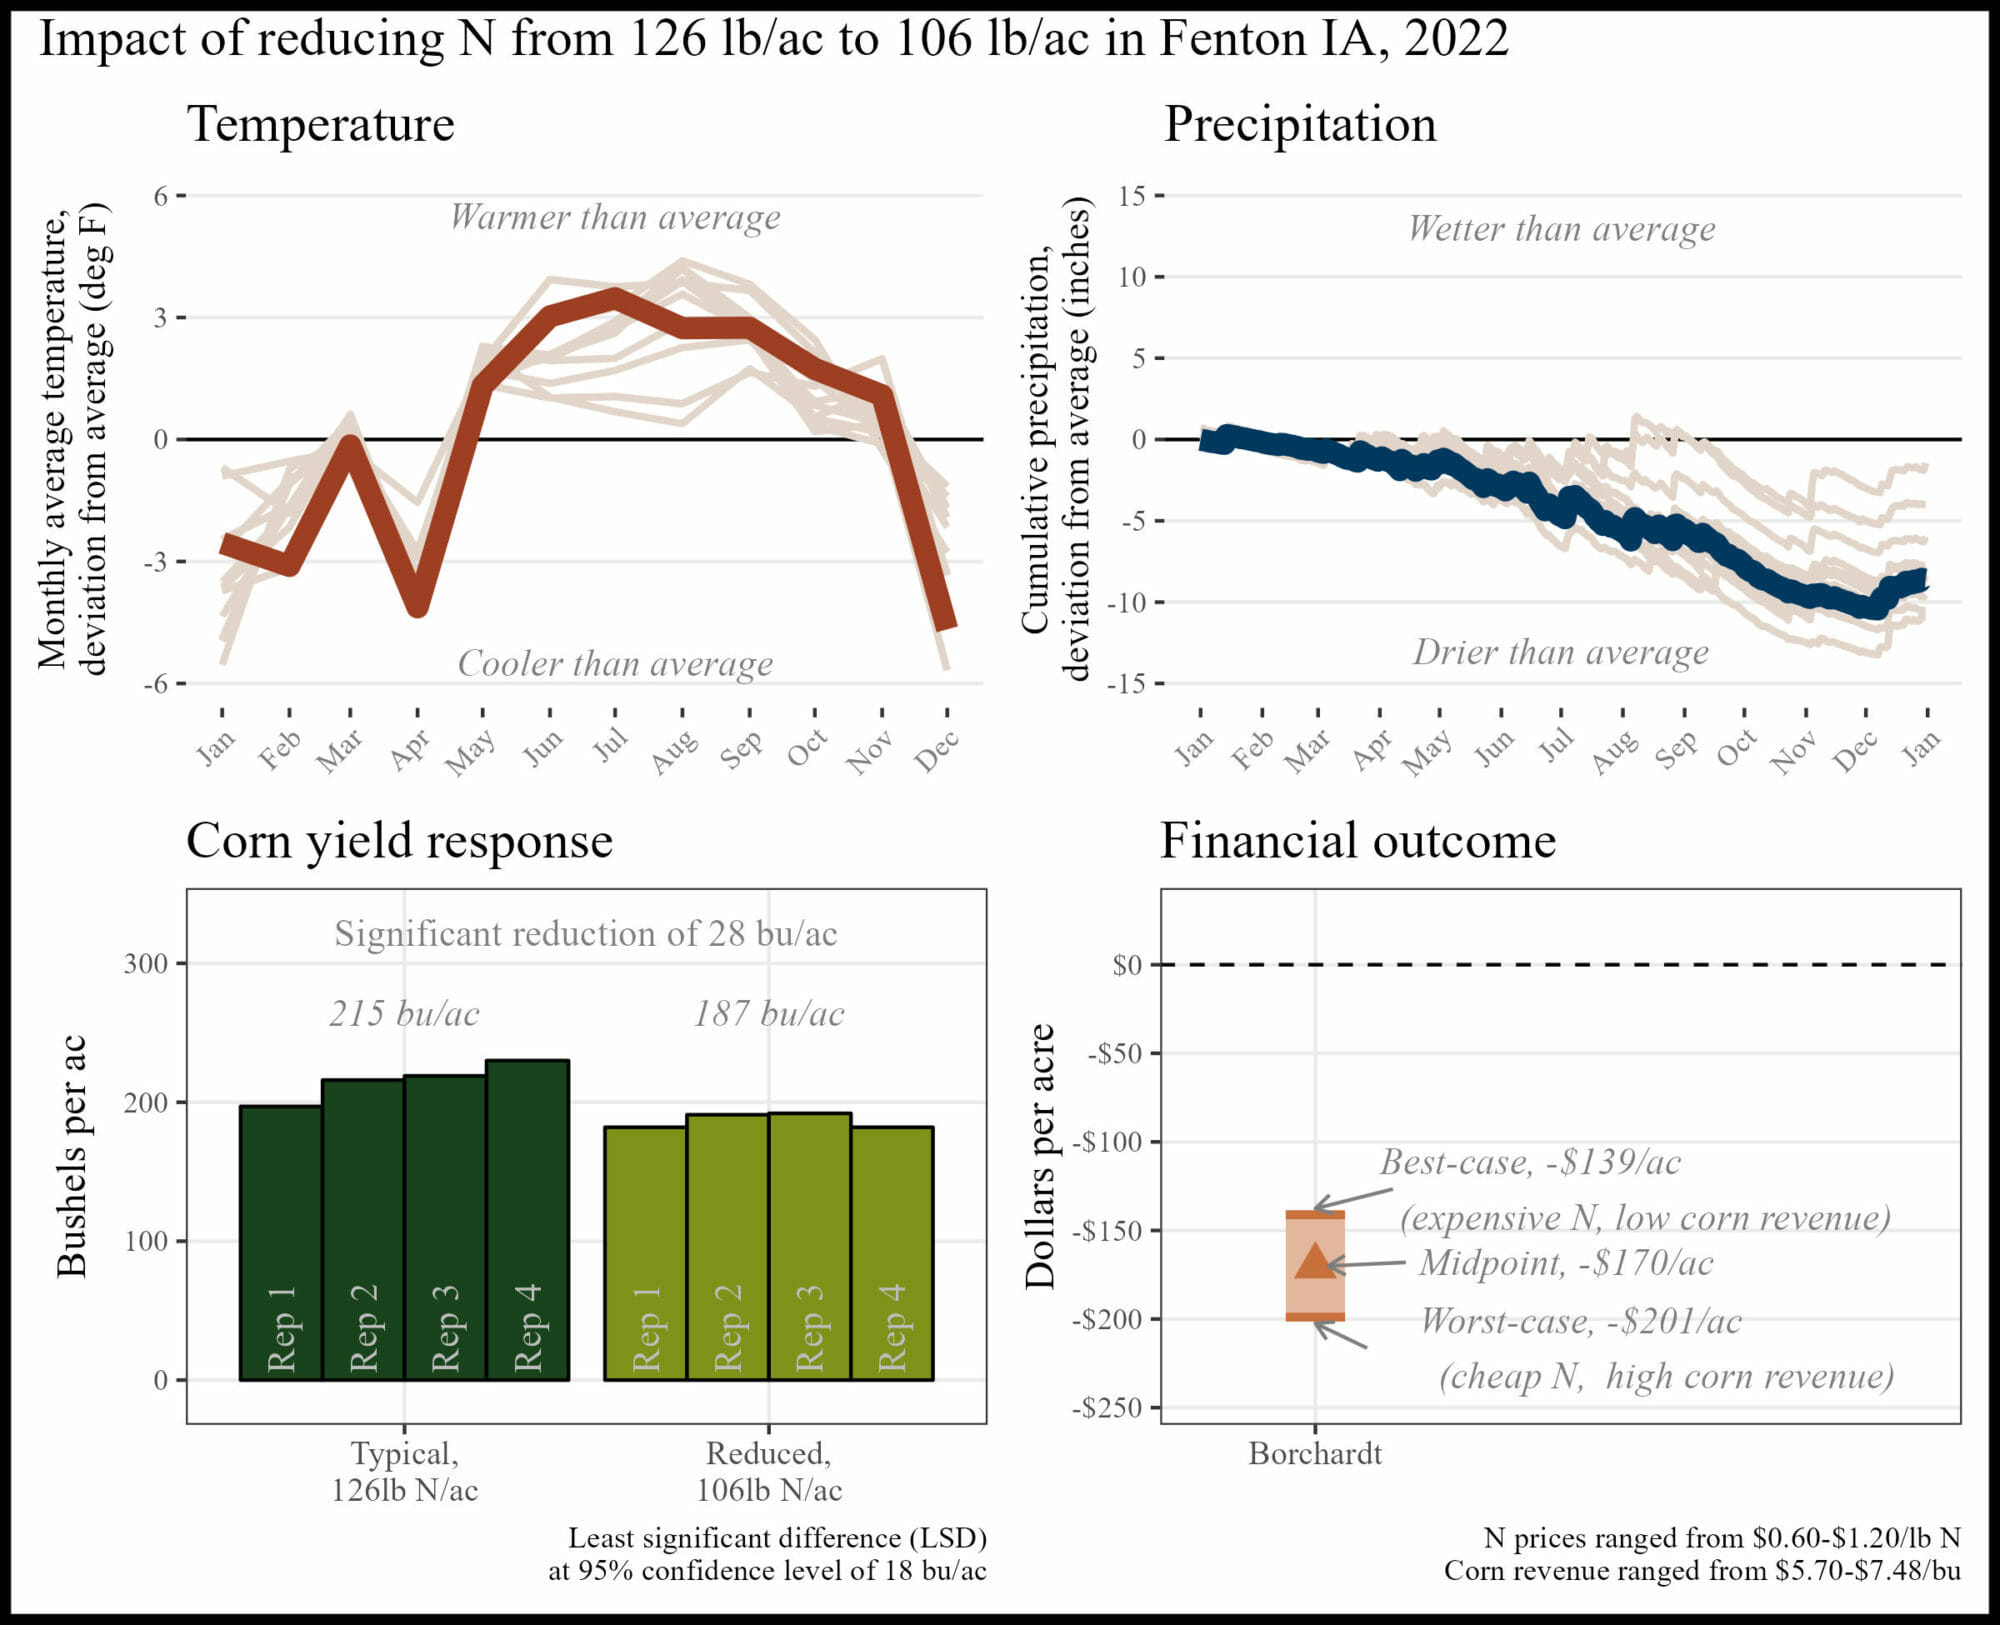 Historical cropping system (5 year): Strip-till corn, no-till/strip-till soybeans
Previous crop: Soybeans
Replications and plot size: 4 reps, 0.8 acre strips
Corn planting/harvest date: May 11, 2022/October 25, 2022
Corn row spacing/planting density: 30 inch; 33,500 seeds/ac
Nitrogen sources and timing: Chemical, organic; fall, at planting, side-dress
Historical cropping system (5 year): Strip-till corn, no-till/strip-till soybeans
Previous crop: Soybeans
Replications and plot size: 4 reps, 0.8 acre strips
Corn planting/harvest date: May 11, 2022/October 25, 2022
Corn row spacing/planting density: 30 inch; 33,500 seeds/ac
Nitrogen sources and timing: Chemical, organic; fall, at planting, side-dress
APPENDIX G. JACK BOYER, REINBECK IA
When asked what was the most valuable aspect of conducting this trial, Jack replied simply: “Cost reduction.”
The financial outcome at the reduced N rate was likely a financial savings compared to the typical N rate. A 50 lb N/ac reduction saved money this year.
 Historical cropping system (5 year): No-till rye, no-till soybeans, multispecies cover crops
Previous crop: Rye/soybean relay crop
Replications and plot size: 4 reps, 0.7 acre strips
Corn planting/harvest date: May 15, 2022/October 18, 2022
Corn row spacing/planting density: 30 inch; 34,000 seeds/ac
Nitrogen sources and timing: Chemical; fall, at planting, side-dress
Historical cropping system (5 year): No-till rye, no-till soybeans, multispecies cover crops
Previous crop: Rye/soybean relay crop
Replications and plot size: 4 reps, 0.7 acre strips
Corn planting/harvest date: May 15, 2022/October 18, 2022
Corn row spacing/planting density: 30 inch; 34,000 seeds/ac
Nitrogen sources and timing: Chemical; fall, at planting, side-dress
APPENDIX H. CHRIS DEAL, JEFFERSON IA
“One of my biggest questions for several years has been whether I was being too aggressive with the amount of N I was using. This trial allowed me to explore that important question.”
The financial outcome at the reduced N rate was likely a financial loss compared to the typical N rate. A 50 lb N/ac reduction was likely too large this year, but there may be potential for financial savings with a smaller N reduction.
 Historical cropping system (5 year): No-till soybean, no-till corn, cereal rye/wheat cover crops
Previous crop: Soybean
Replications and plot size: 4 reps, 1.6 acre strips
Corn planting/harvest date: May 17, 2022/October 26, 2022
Corn row spacing/planting density: 30 inch; 36,400 seeds/ac
Nitrogen sources and timing: Chemical; fall, at-planting, side-dress
Historical cropping system (5 year): No-till soybean, no-till corn, cereal rye/wheat cover crops
Previous crop: Soybean
Replications and plot size: 4 reps, 1.6 acre strips
Corn planting/harvest date: May 17, 2022/October 26, 2022
Corn row spacing/planting density: 30 inch; 36,400 seeds/ac
Nitrogen sources and timing: Chemical; fall, at-planting, side-dress
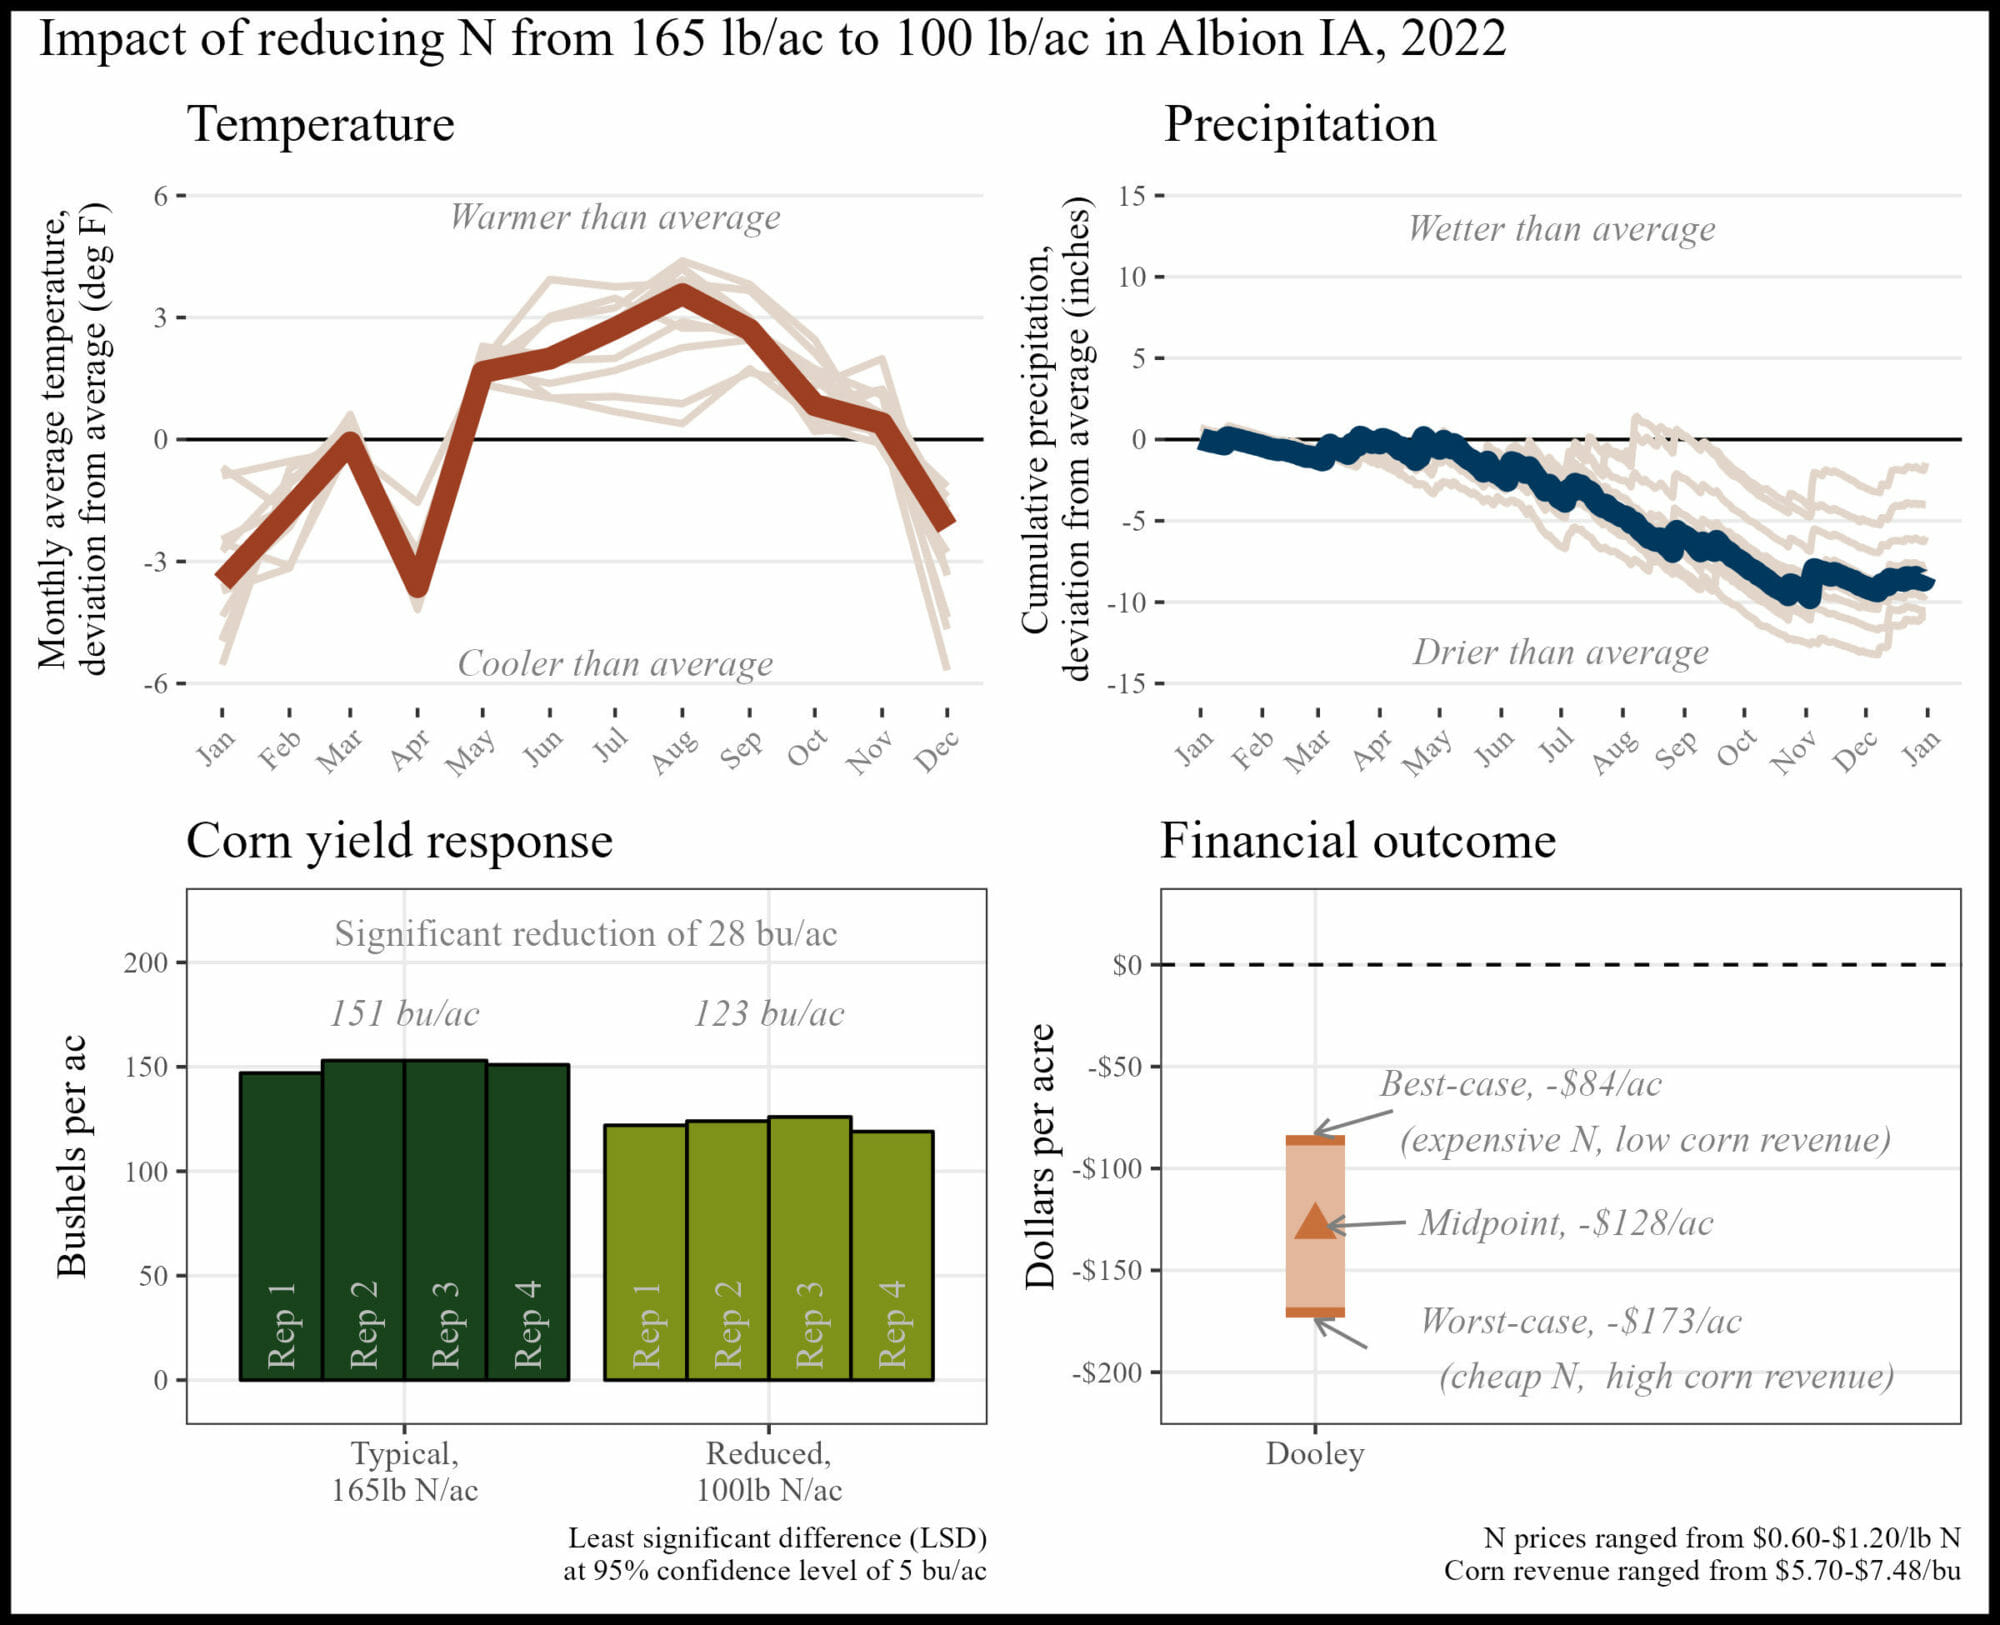
APPENDIX I. WADE DOOLEY, ALBION IA
“[I] need to continue testing the hypothesis, perhaps at lower ratios of difference.”
The financial outcome at the reduced N rate was likely a financial loss compared to the typical N rate. A 65 lb N/ac reduction was likely too large this year, but there may be potential for financial savings with a smaller N reduction.
 Historical cropping system (5 year): No-till soybeans, no-till oats, no-till corn, no-till cereal rye, clover cover crop, multi-species cover crop, grazing
Previous crop: Rye and multi-species summer-planted cover crop
Replications and plot size: 4 reps, 0.3 acre strips
Corn planting/harvest date: May 17, 2022/November 11, 2022
Corn row spacing/planting density: 30 inch; 33,000 seeds/ac
Nitrogen sources and timing: Chemical; at planting, side-dress
Historical cropping system (5 year): No-till soybeans, no-till oats, no-till corn, no-till cereal rye, clover cover crop, multi-species cover crop, grazing
Previous crop: Rye and multi-species summer-planted cover crop
Replications and plot size: 4 reps, 0.3 acre strips
Corn planting/harvest date: May 17, 2022/November 11, 2022
Corn row spacing/planting density: 30 inch; 33,000 seeds/ac
Nitrogen sources and timing: Chemical; at planting, side-dress
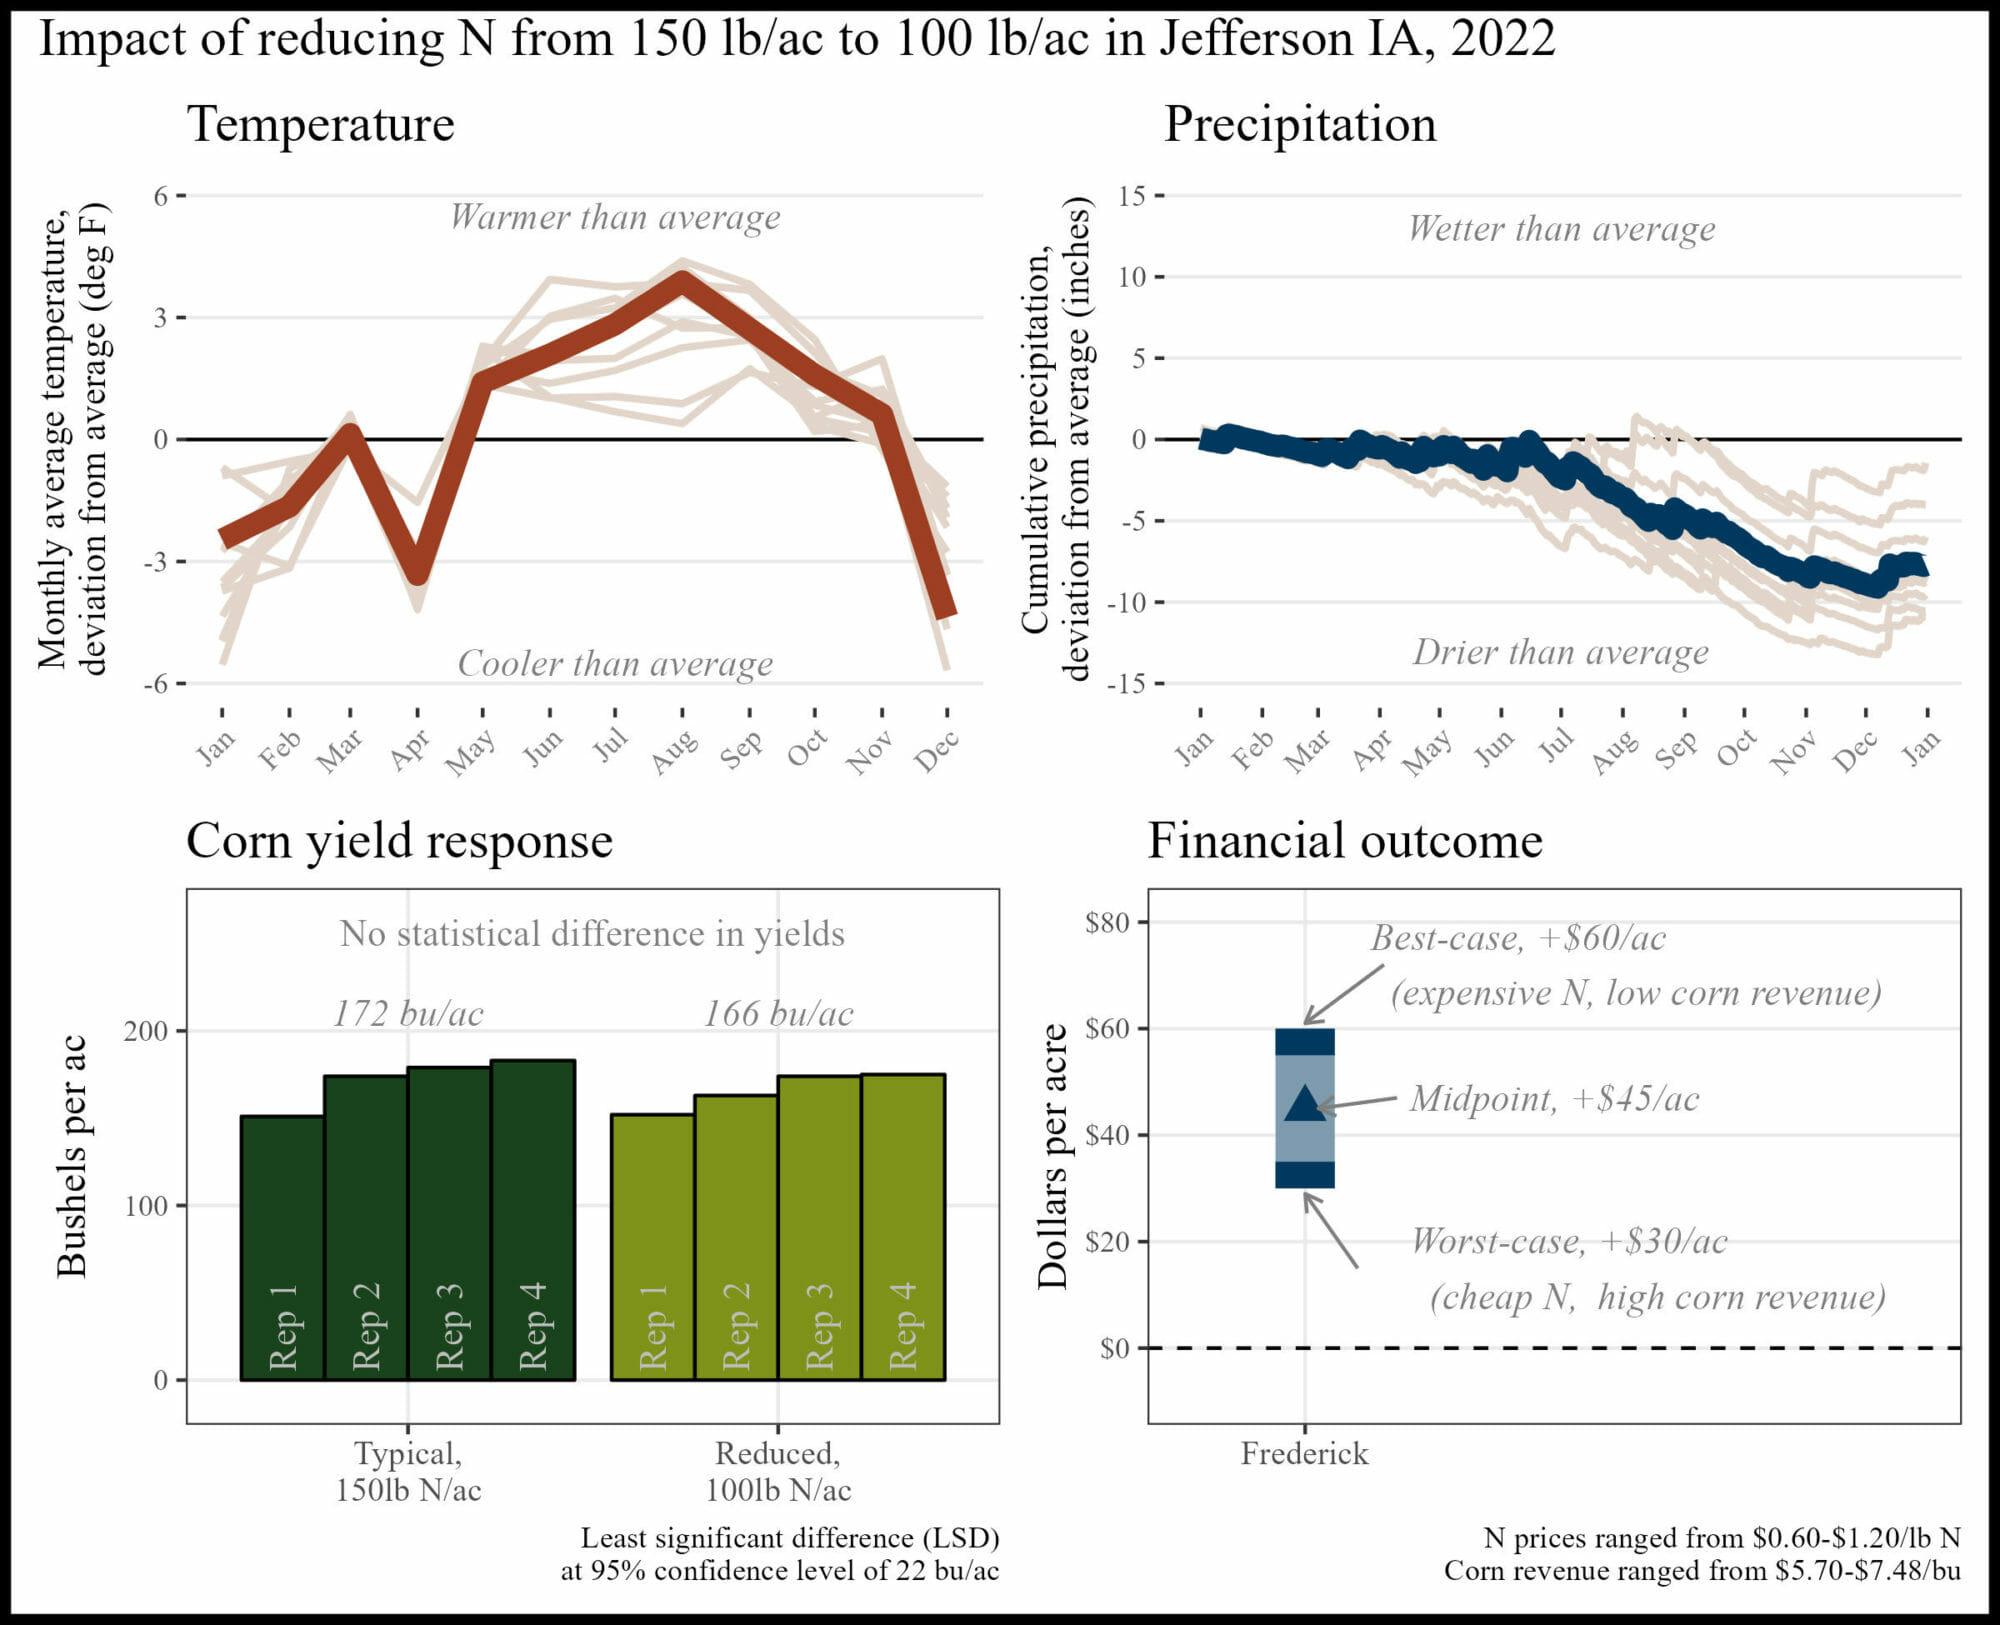
APPENDIX J. BILL FREDERICK, JEFFERSON IA
“My search for optimum N rates isn't over yet.”
The financial outcome at the reduced N rate was likely a financial savings compared to the typical N rate. A 50 lb N/ac reduction saved money this year.
 Historical cropping system (5 year): No-till corn, no-till soybeans, wheat cover crop, wheat/turnip cover crop, grazing
Previous crop: Soybeans and winter wheat cover crop (aerially applied)
Replications and plot size: 4 reps, 50 feet wide strips, length of field
Corn planting/harvest date: May 22, 2022/October 13, 2022
Corn row spacing/planting density: 20 inch; 37,000 seeds/ac
Nitrogen sources and timing: Organic, chemical; fall
Historical cropping system (5 year): No-till corn, no-till soybeans, wheat cover crop, wheat/turnip cover crop, grazing
Previous crop: Soybeans and winter wheat cover crop (aerially applied)
Replications and plot size: 4 reps, 50 feet wide strips, length of field
Corn planting/harvest date: May 22, 2022/October 13, 2022
Corn row spacing/planting density: 20 inch; 37,000 seeds/ac
Nitrogen sources and timing: Organic, chemical; fall
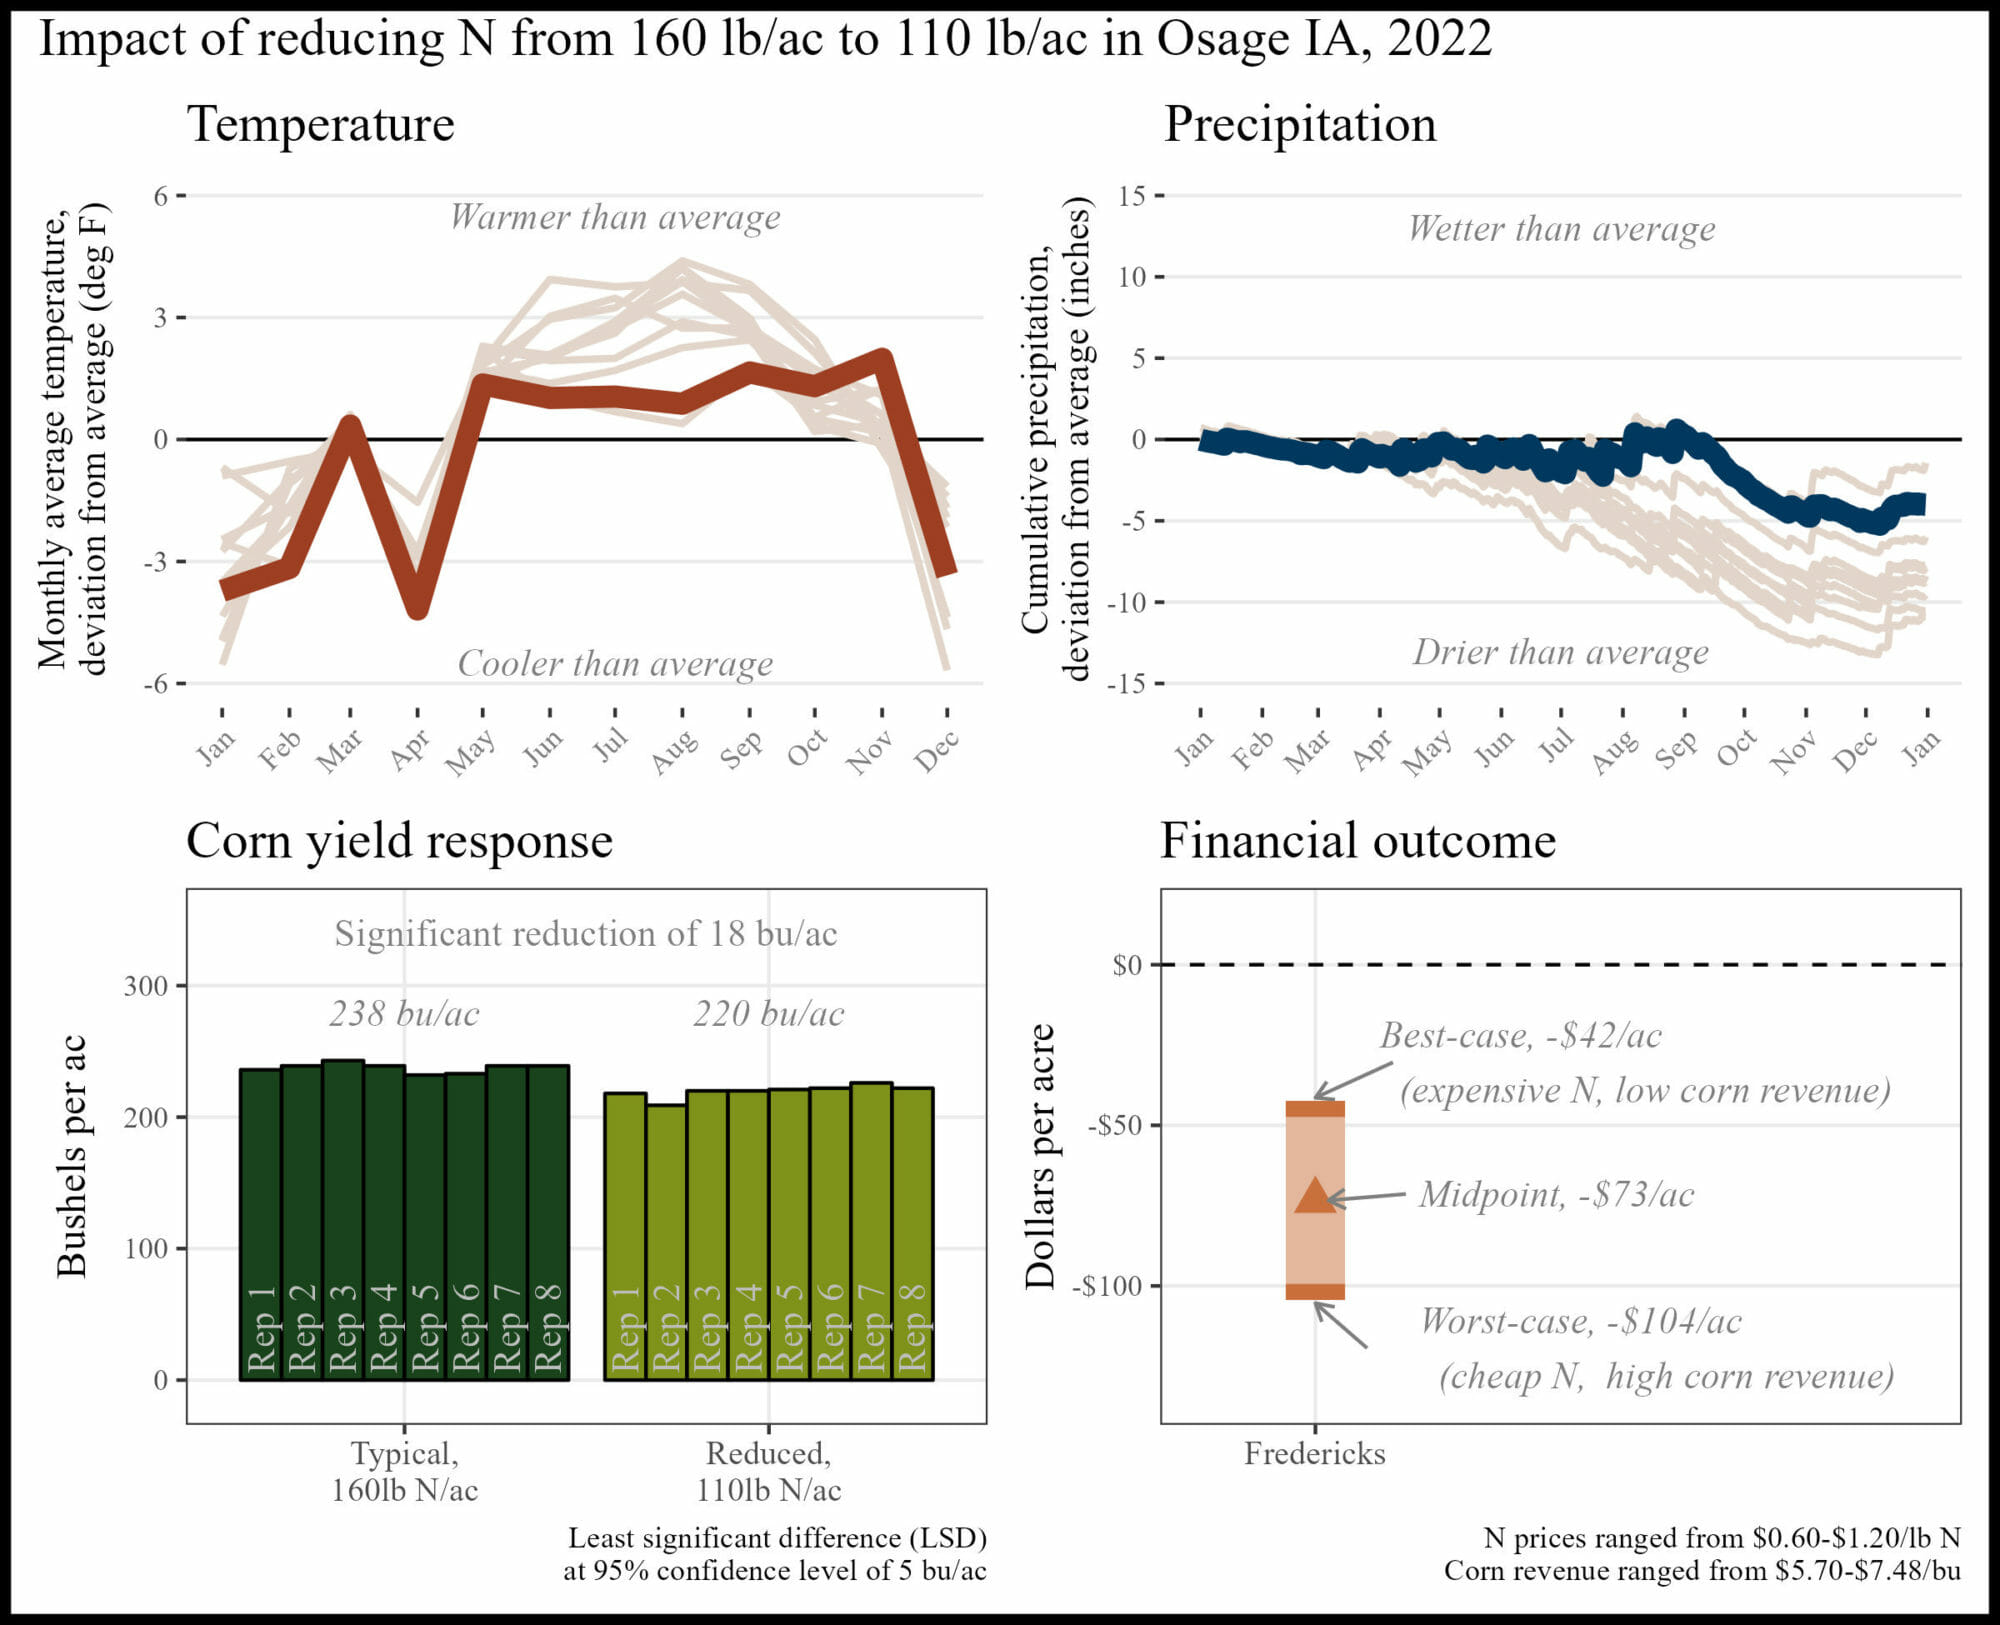
APPENDIX K. WAYNE FREDERICKS, OSAGE IA
Wayne Fredericks is ‘very likely’ to refer participating in PFI research trials to a friend or other farmers.
The financial outcome at the reduced N rate was likely a financial loss compared to the typical N rate. A 50 lb N/ac reduction was likely too large this year, but there may be potential for financial savings with a smaller N reduction.
 Historical cropping system (5 year): No-till soybeans, strip-till corn, cereal rye cover crops
Previous crop: Soybeans and cereal rye/winter camelina cover crop
Replications and plot size: 4 reps, 0.6 acre strips
Corn planting/harvest date: May 7, 2022/October 19, 2022
Corn row spacing/planting density: 30 inch; 34,680 seeds/ac
Nitrogen sources and timing: Chemical; fall, at planting, side-dress
Historical cropping system (5 year): No-till soybeans, strip-till corn, cereal rye cover crops
Previous crop: Soybeans and cereal rye/winter camelina cover crop
Replications and plot size: 4 reps, 0.6 acre strips
Corn planting/harvest date: May 7, 2022/October 19, 2022
Corn row spacing/planting density: 30 inch; 34,680 seeds/ac
Nitrogen sources and timing: Chemical; fall, at planting, side-dress
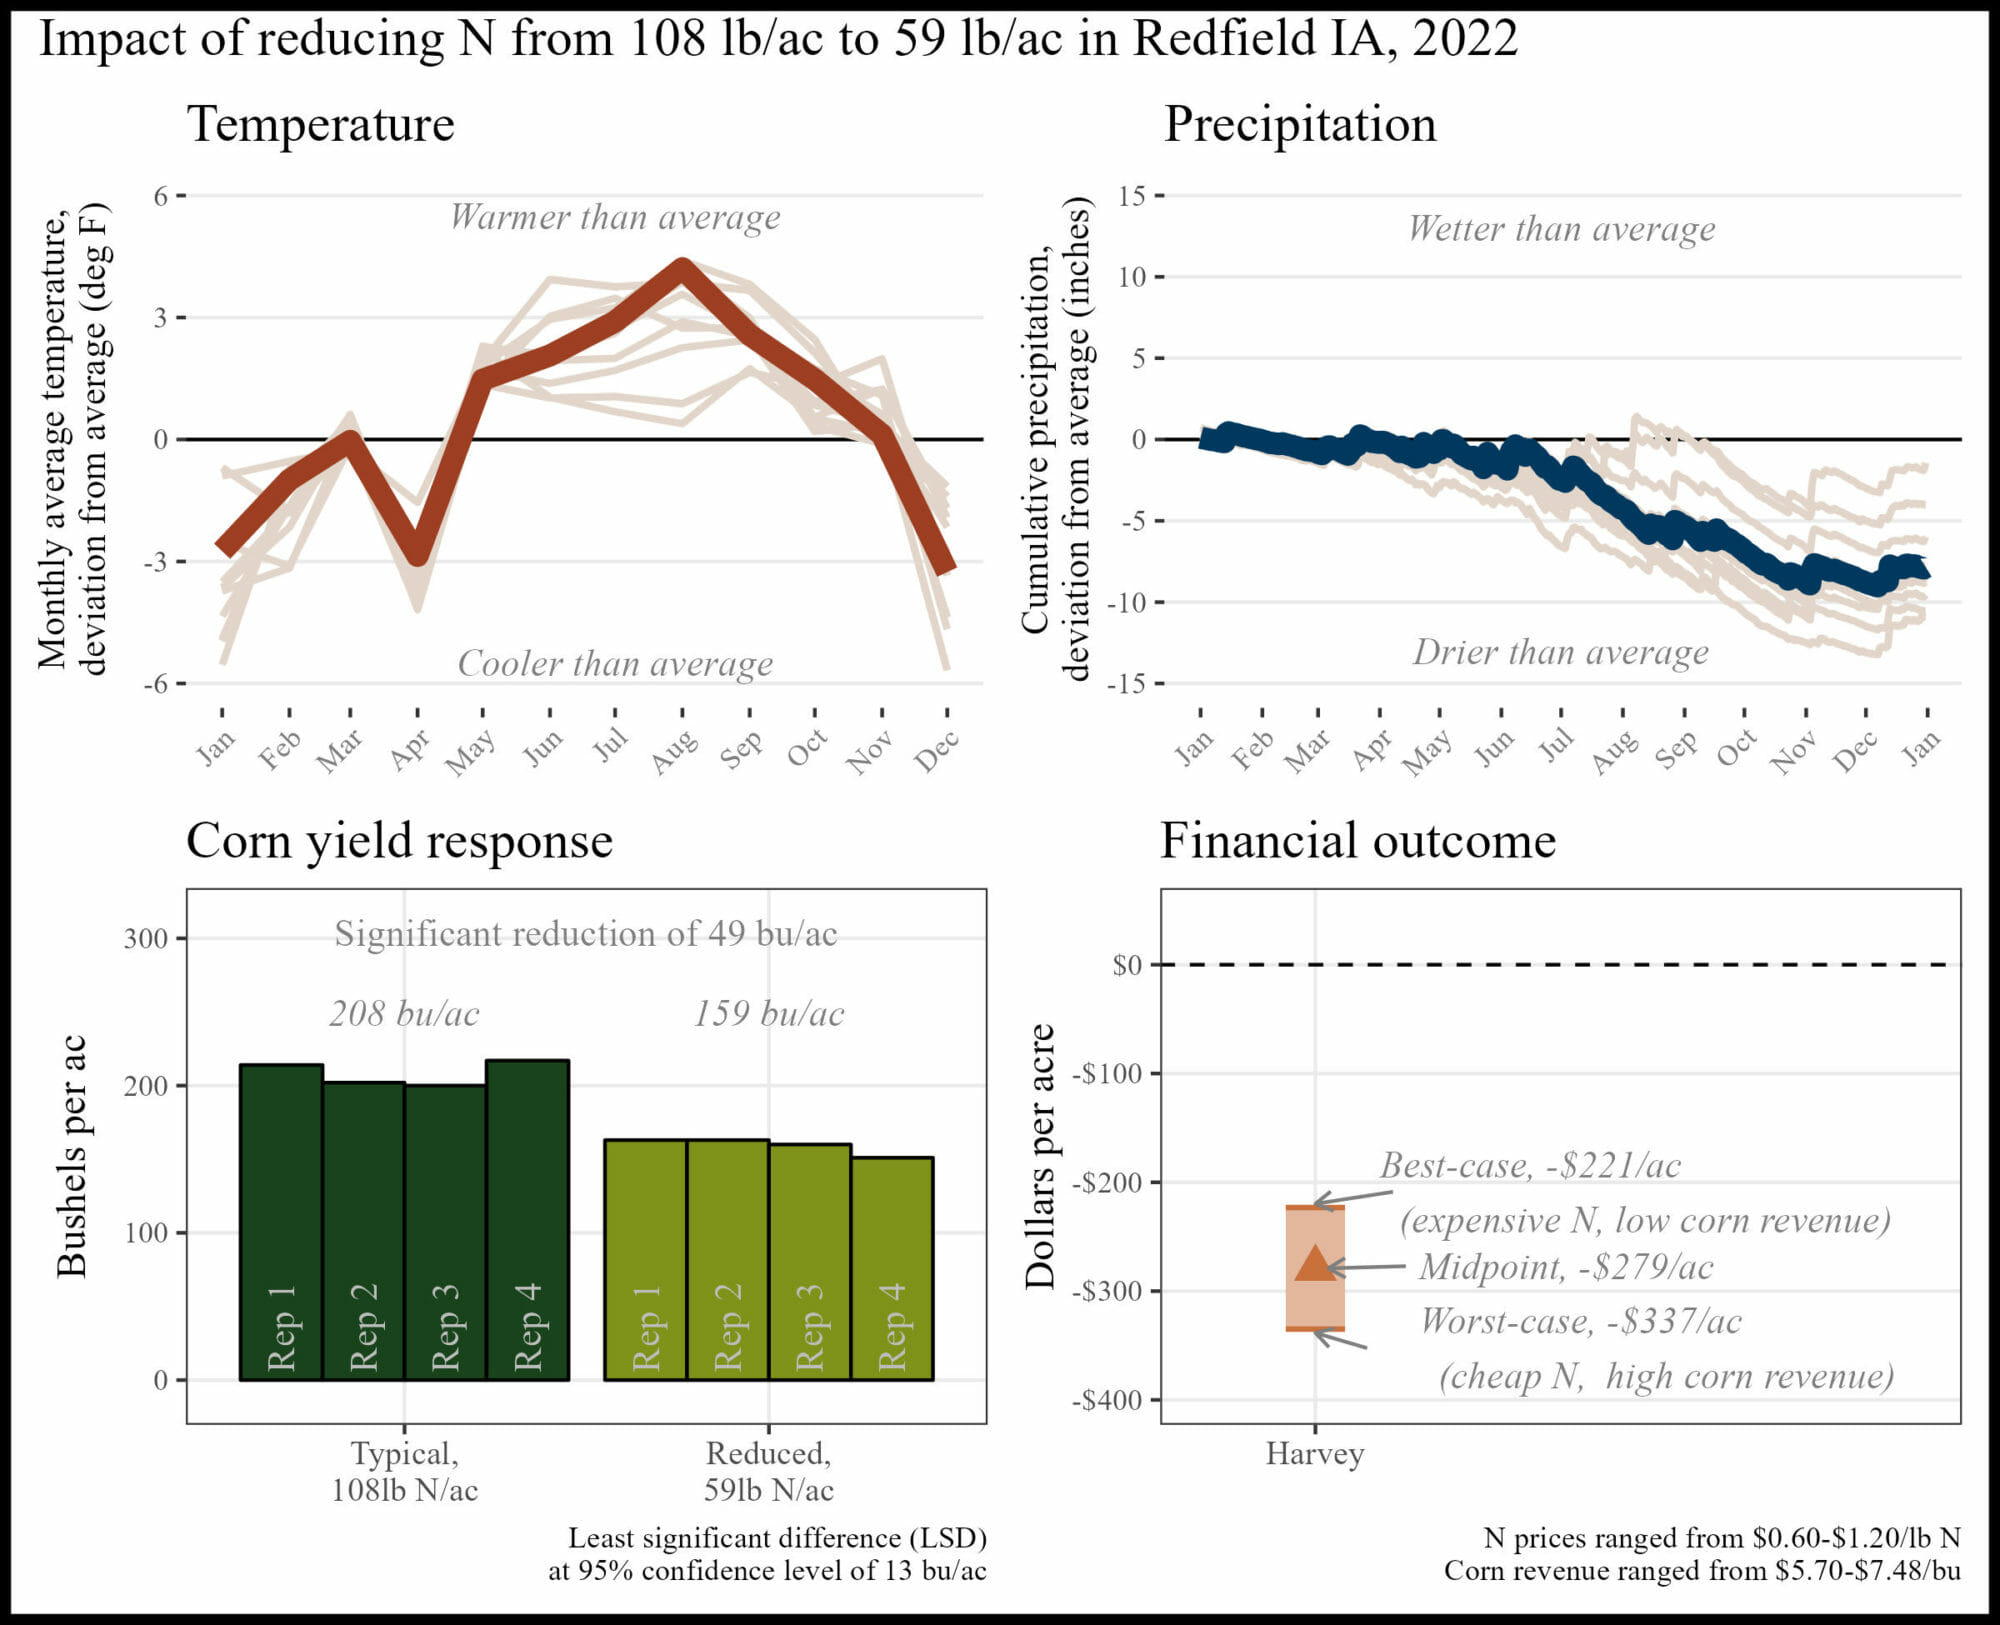
APPENDIX L. ROBERT HARVEY, REDFIELD IA
“I'm hoping to involve my daughter and use this experience as an opportunity to interest her in the farm operation.”
The financial outcome at the reduced N rate was likely a financial loss compared to the typical N rate. A 49 lb N/ac reduction was likely too large this year, but there may be potential for financial savings with a smaller N reduction.
 Historical cropping system (5 year): No-till soybeans, strip-till corn, cereal rye cover crops
Previous crop: Soybeans and cereal rye cover crop
Replications and plot size: 4 reps, 0.4 acre strips
Corn planting/harvest date: April 27, 2022/October 19, 2022
Corn row spacing/planting density: 30 inch; 32,000 seeds/ac
Nitrogen sources and timing: Chemical; winter, at planting, side-dress
Historical cropping system (5 year): No-till soybeans, strip-till corn, cereal rye cover crops
Previous crop: Soybeans and cereal rye cover crop
Replications and plot size: 4 reps, 0.4 acre strips
Corn planting/harvest date: April 27, 2022/October 19, 2022
Corn row spacing/planting density: 30 inch; 32,000 seeds/ac
Nitrogen sources and timing: Chemical; winter, at planting, side-dress
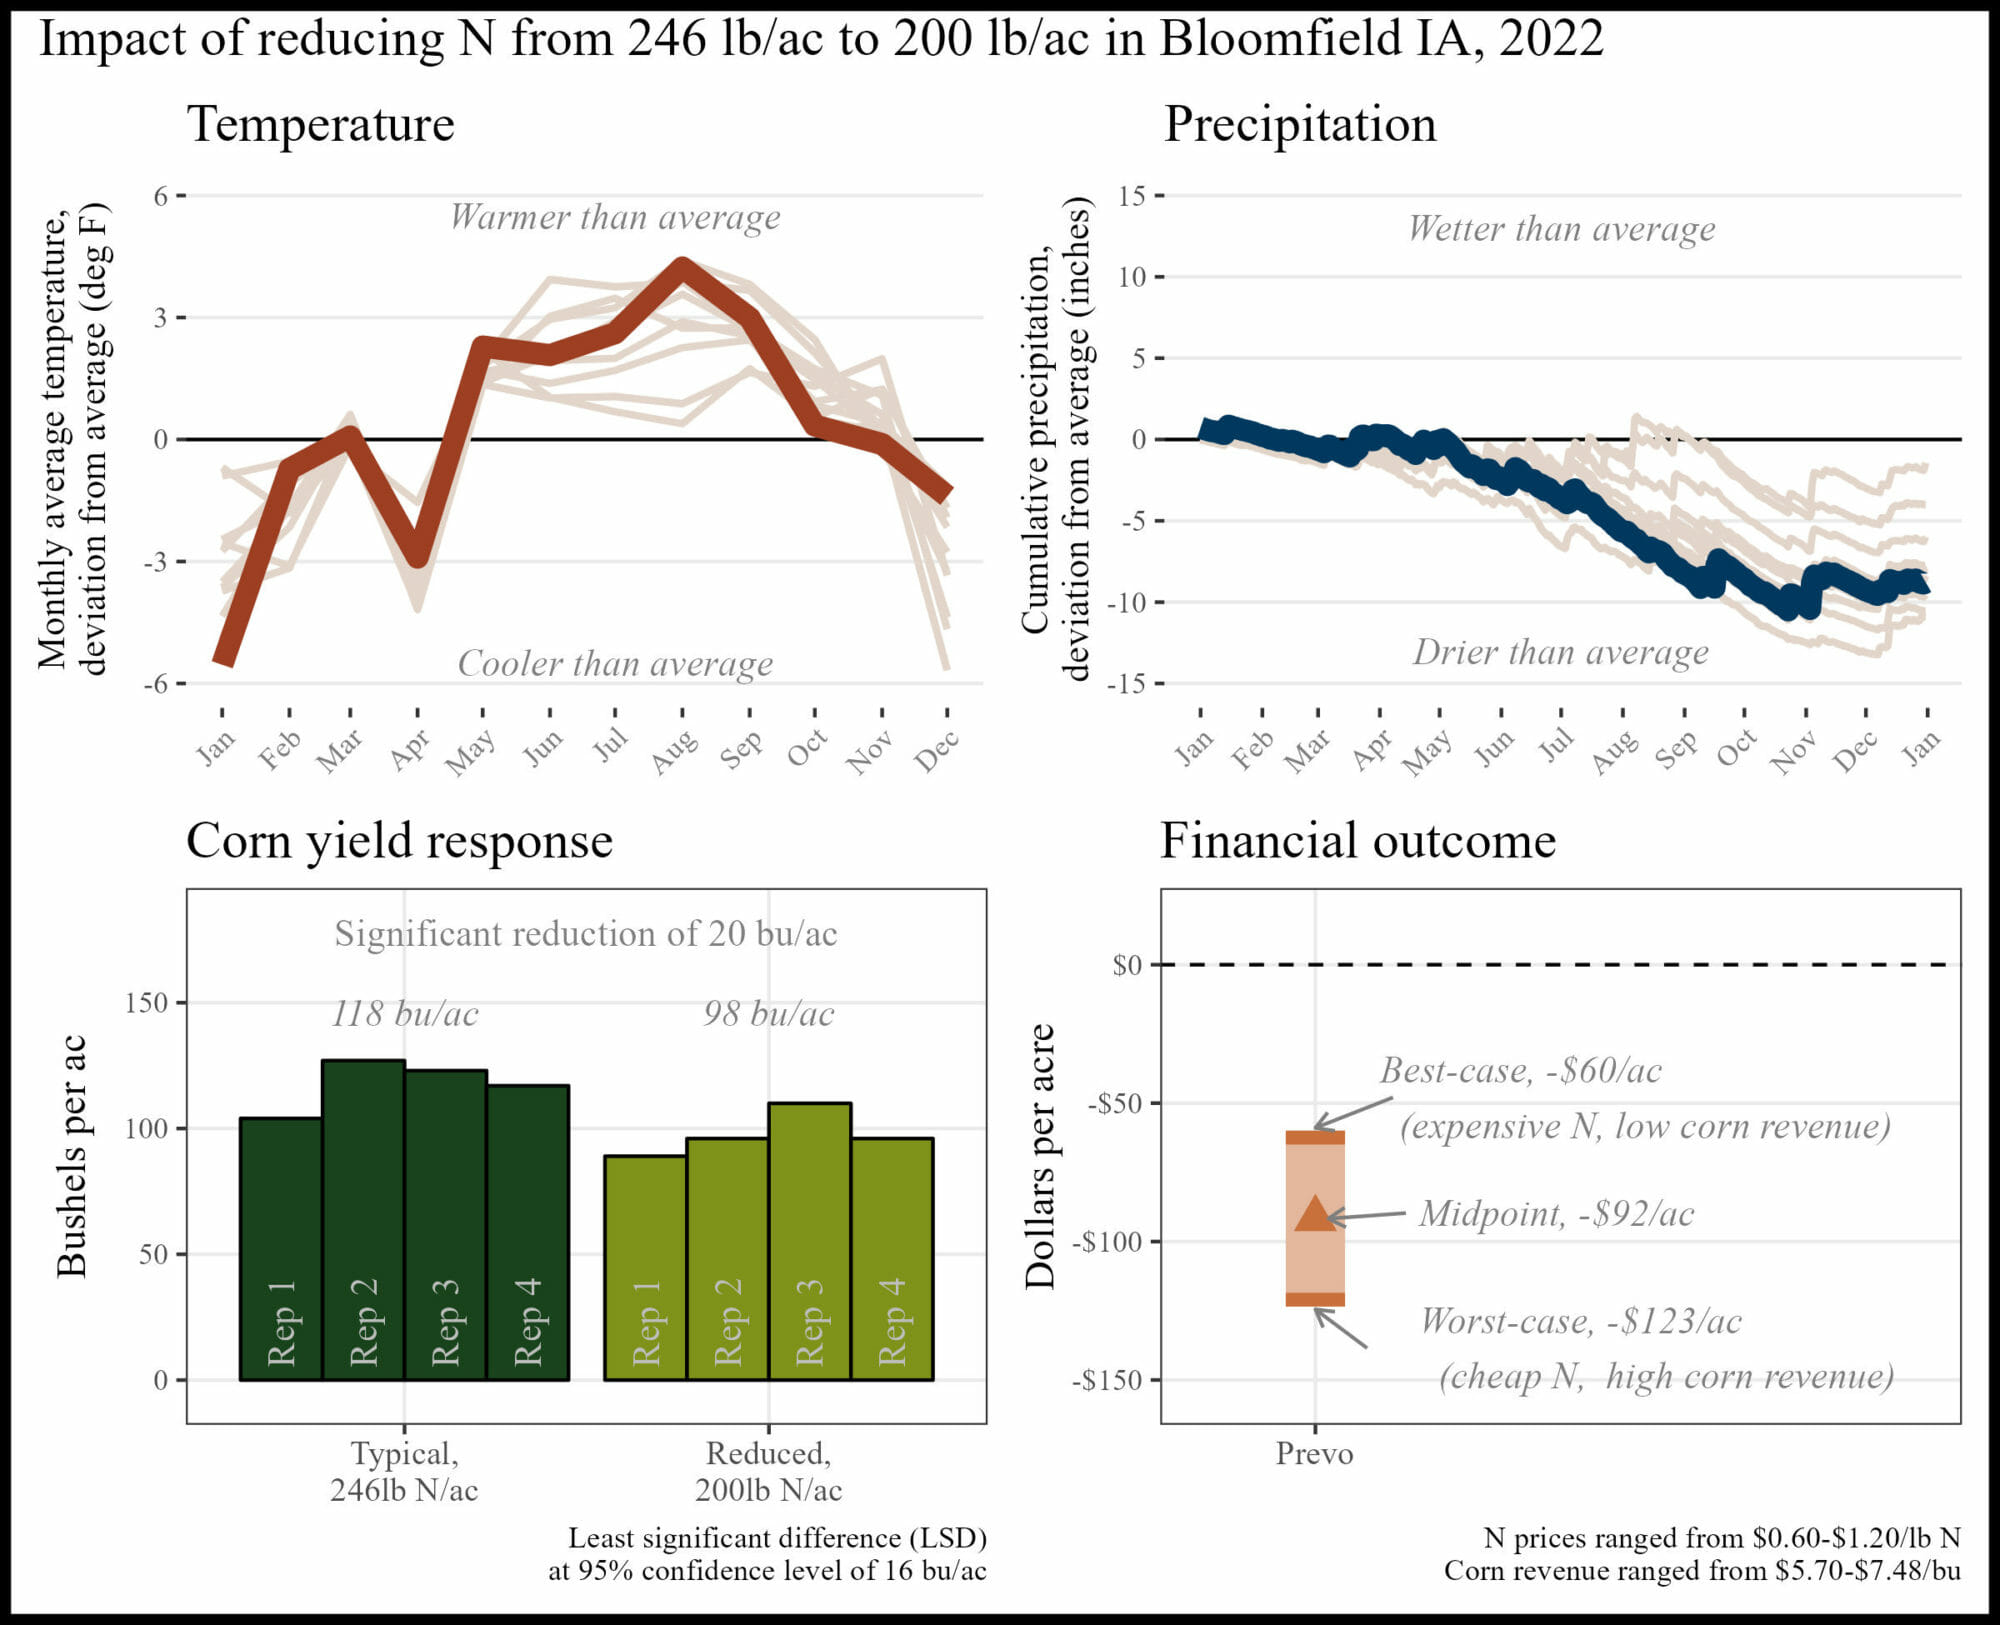
APPENDIX M. KEVIN PREVO, BLOOMFIELD IA
While Kevin wanted to help others, he also “gained knowledge and had fun!”
The financial outcome at the reduced N rate was likely a financial loss compared to the typical N rate. A 46 lb N/ac reduction was likely too large this year, but there may be potential for financial savings with a smaller N reduction.
 Historical cropping system (5 year): No-till soybeans, no-till corn, wheat or cereal rye cover crops, grazing
Previous crop: Soybeans and cereal rye cover crop
Replications and plot size: 4 reps, 1 acre strips
Corn planting/harvest date: May 9, 2022/September 25, 2022
Corn row spacing/planting density: 30 inch; 32,000 seeds/ac
Nitrogen sources and timing: Organic, chemical; fall, side-dress
Historical cropping system (5 year): No-till soybeans, no-till corn, wheat or cereal rye cover crops, grazing
Previous crop: Soybeans and cereal rye cover crop
Replications and plot size: 4 reps, 1 acre strips
Corn planting/harvest date: May 9, 2022/September 25, 2022
Corn row spacing/planting density: 30 inch; 32,000 seeds/ac
Nitrogen sources and timing: Organic, chemical; fall, side-dress
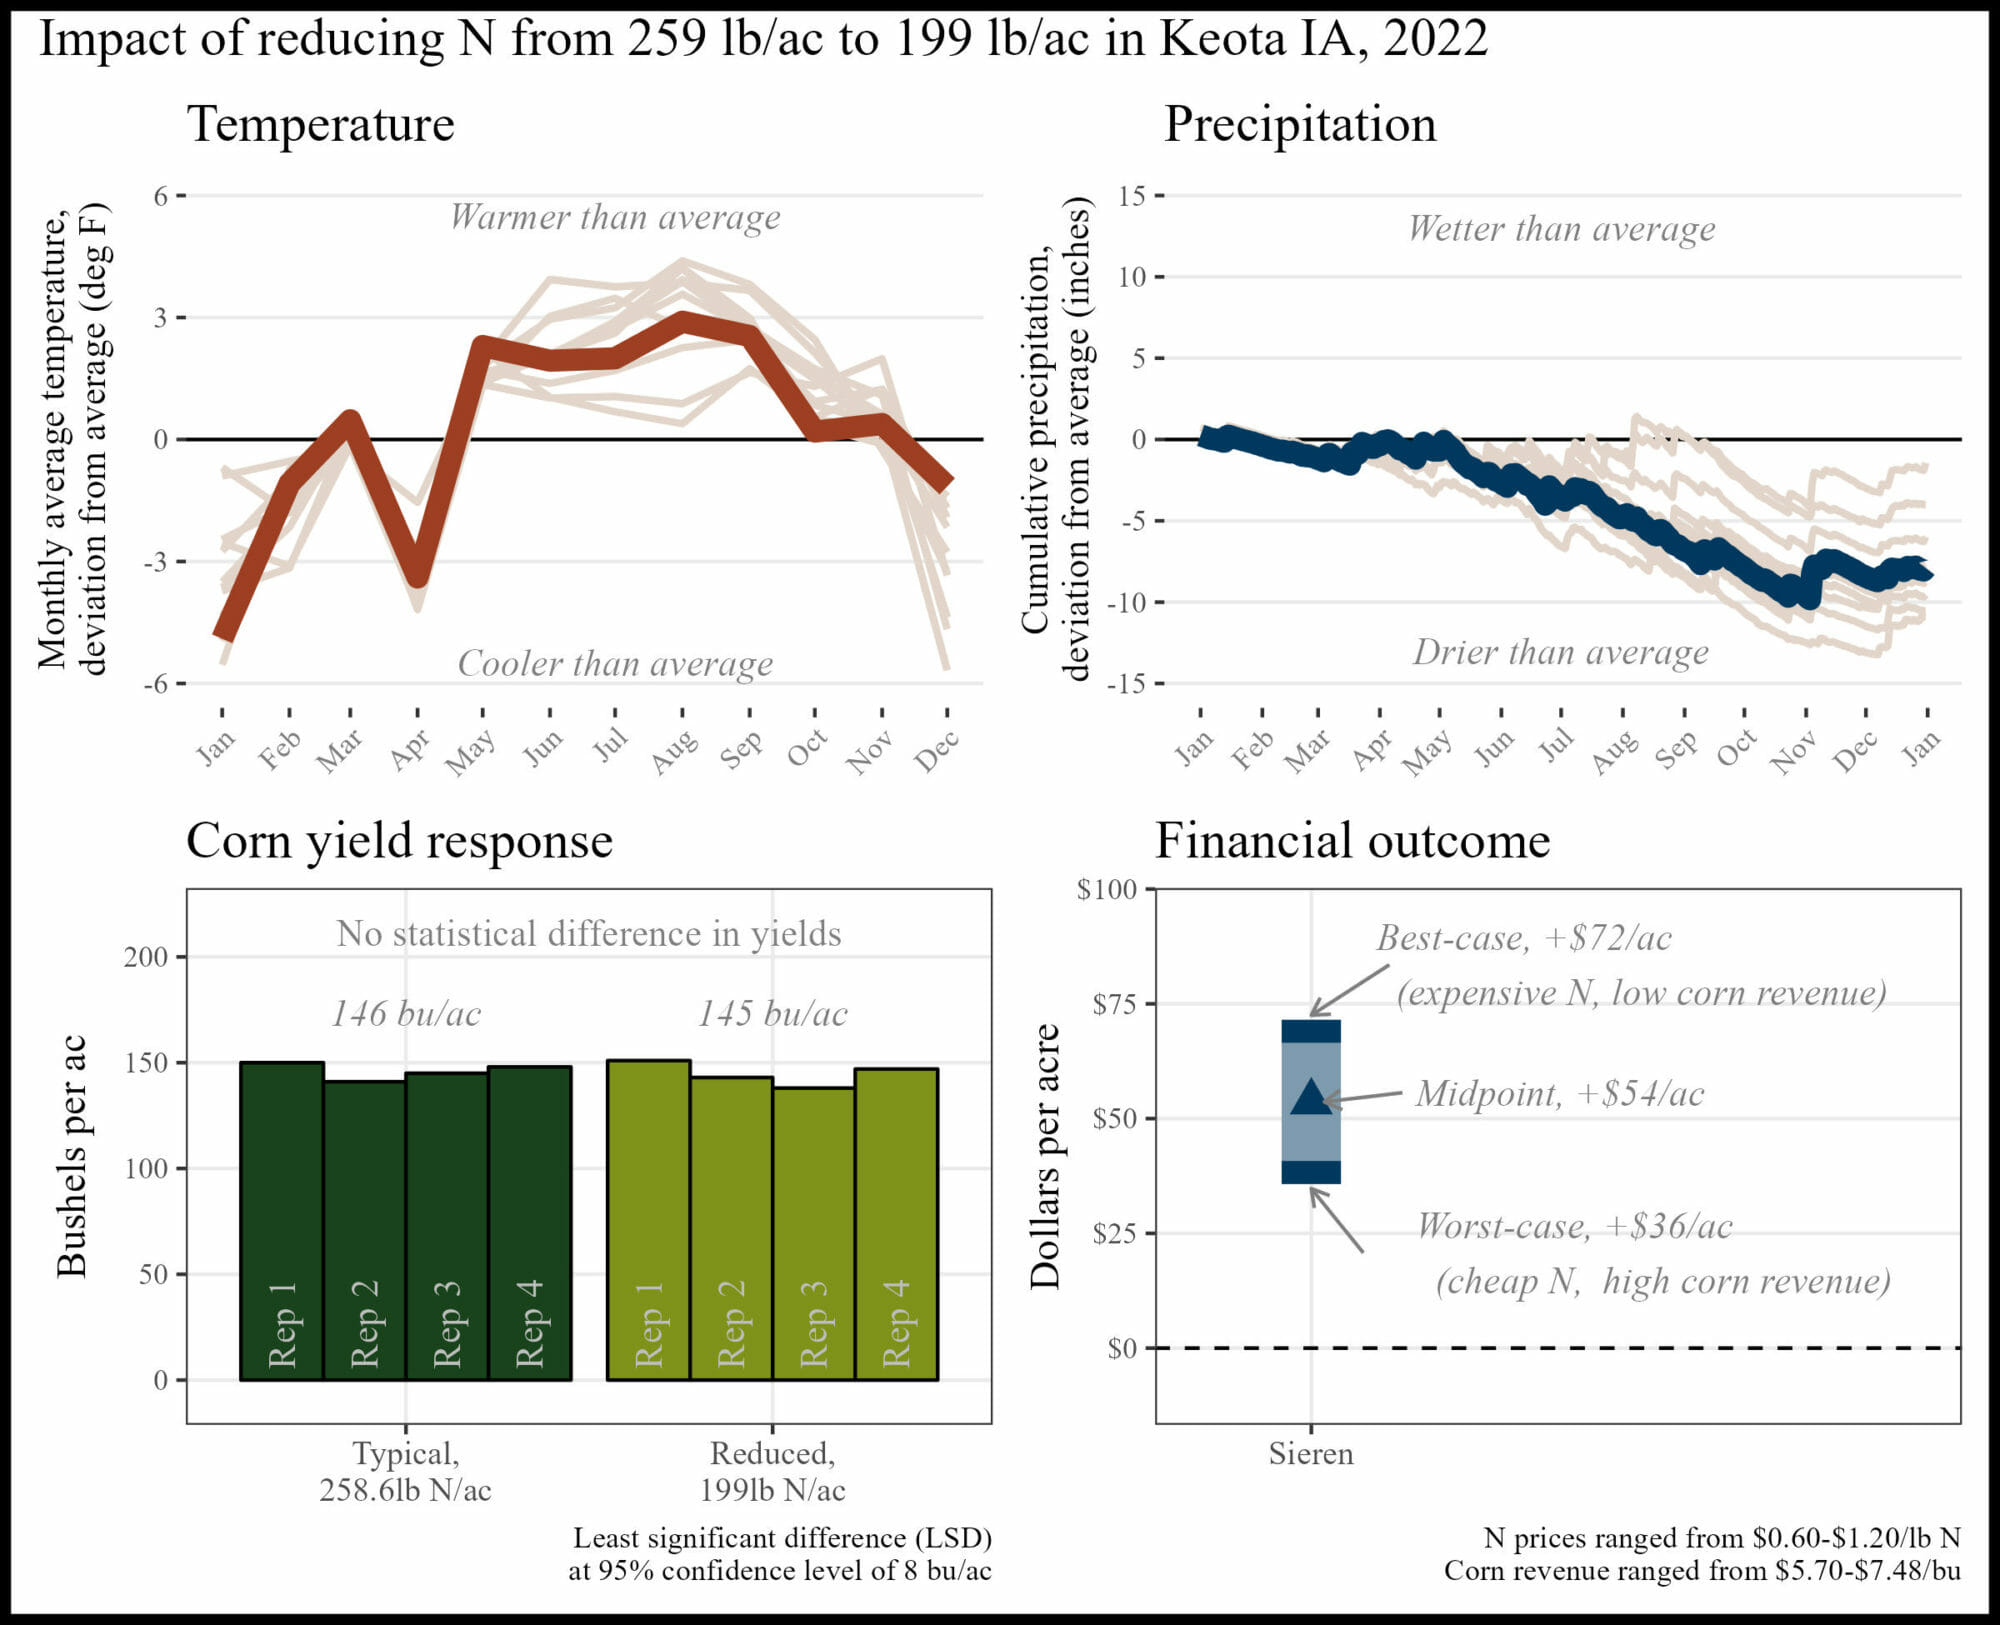
APPENDIX N. TIM SIEREN, KEOTA IA
“[My satisfaction with this trial’s results] was limited by the dry conditions.”
The financial outcome at the reduced N rate was likely a financial savings compared to the typical N rate. A 50 lb N/ac reduction was likely too large this year, however there may be potential for financial savings with a smaller N reduction.
 Historical cropping system (5 year): Strip-till corn, no-till soybeans, cereal rye cover crop, grazing
Previous crop: Soybeans and cereal rye cover crop
Replications and plot size: 4 reps, 20 feet wide strips, length of field
Corn planting/harvest date: May 9, 2022/October 24, 2022
Corn row spacing/planting density: 30 inch; 36,000 seeds/ac
Nitrogen sources and timing: Organic, chemical; fall, spring, at-planting, side dress
Historical cropping system (5 year): Strip-till corn, no-till soybeans, cereal rye cover crop, grazing
Previous crop: Soybeans and cereal rye cover crop
Replications and plot size: 4 reps, 20 feet wide strips, length of field
Corn planting/harvest date: May 9, 2022/October 24, 2022
Corn row spacing/planting density: 30 inch; 36,000 seeds/ac
Nitrogen sources and timing: Organic, chemical; fall, spring, at-planting, side dress
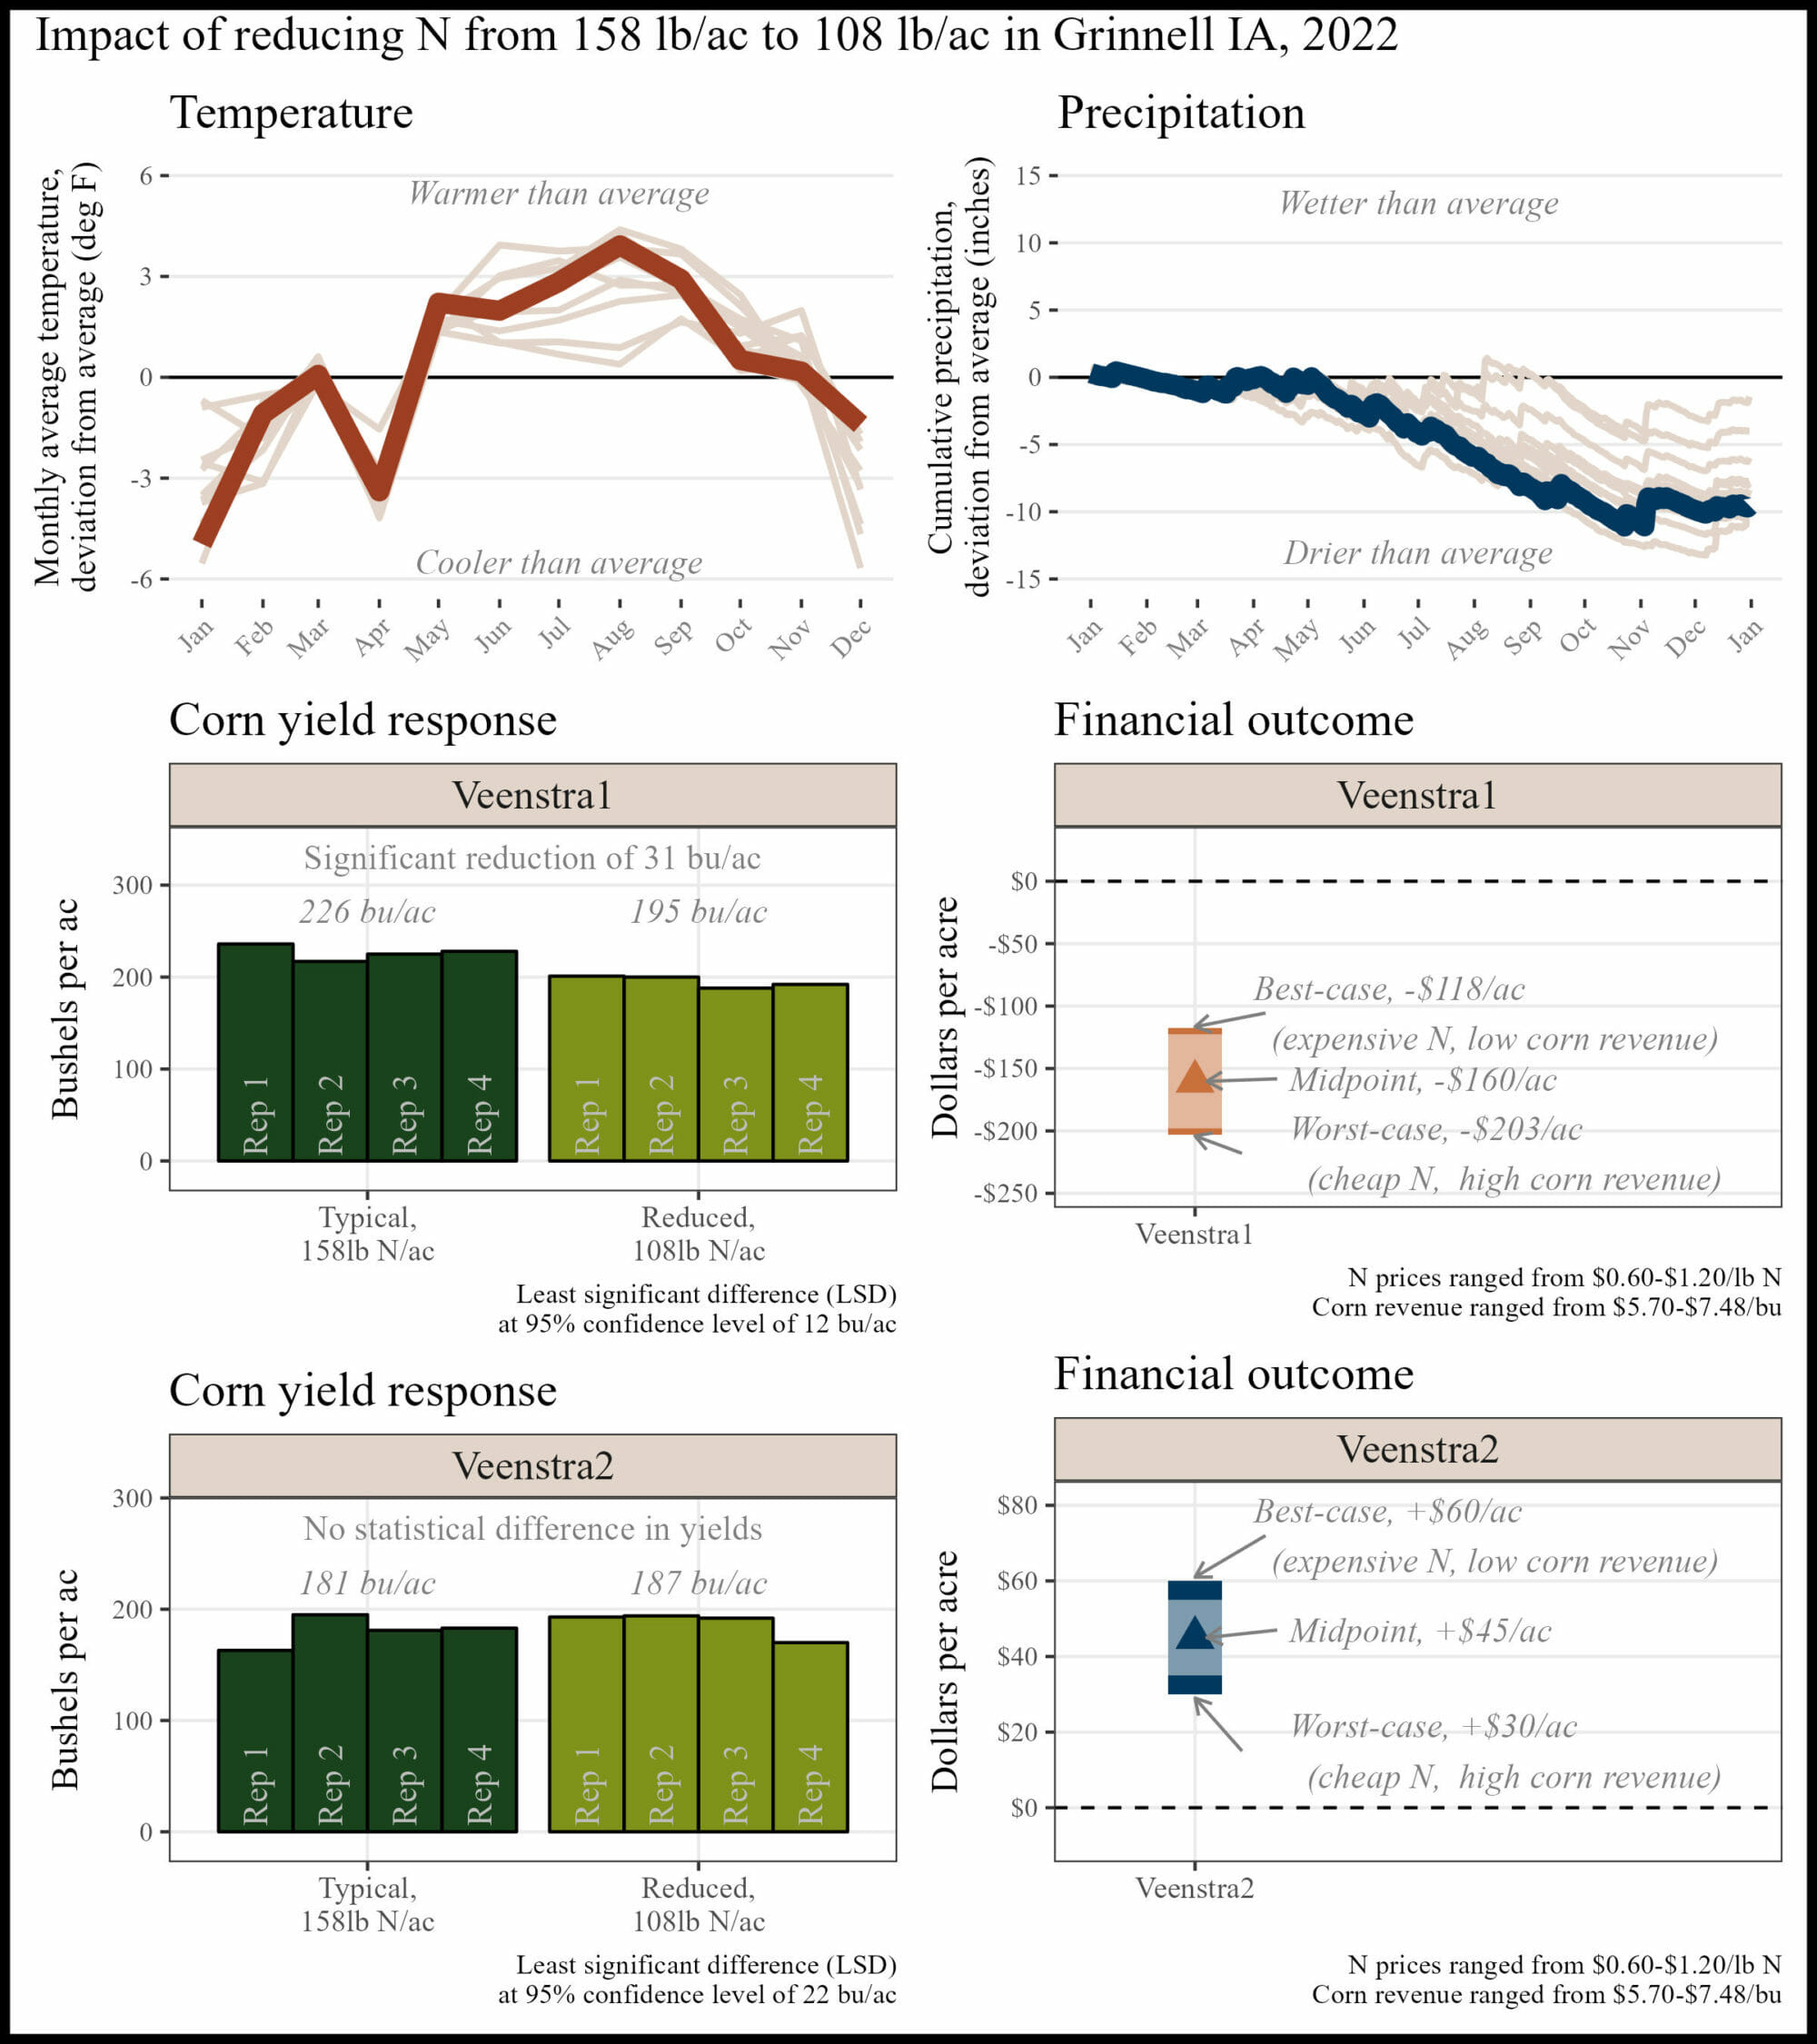
APPENDIX O. KEVIN VEENSTRA, GRINNELL IA (TWO TRIALS)
Without [this trial], I may have cut back nitrogen too much too soon.
The financial outcome showed losses in one trial, and savings in another.
 Historical cropping system (5 year): No-till corn, no-till soybeans, cereal rye cover crop, rye/turnip/rape cover crop, rye/turnip cover crop
Previous crop: Soybeans and cereal rye cover crop
Replications and plot size: 4 reps, 1 acre strips
Corn planting/harvest date: May 13, 2022/October 26, 2022
Corn row spacing/planting density: 30 inch; 34,000 seeds/ac
Nitrogen sources and timing: Chemical; at-planting, side-dress
Historical cropping system (5 year): No-till corn, no-till soybeans, cereal rye cover crop, rye/turnip/rape cover crop, rye/turnip cover crop
Previous crop: Soybeans and cereal rye cover crop
Replications and plot size: 4 reps, 1 acre strips
Corn planting/harvest date: May 13, 2022/October 26, 2022
Corn row spacing/planting density: 30 inch; 34,000 seeds/ac
Nitrogen sources and timing: Chemical; at-planting, side-dress
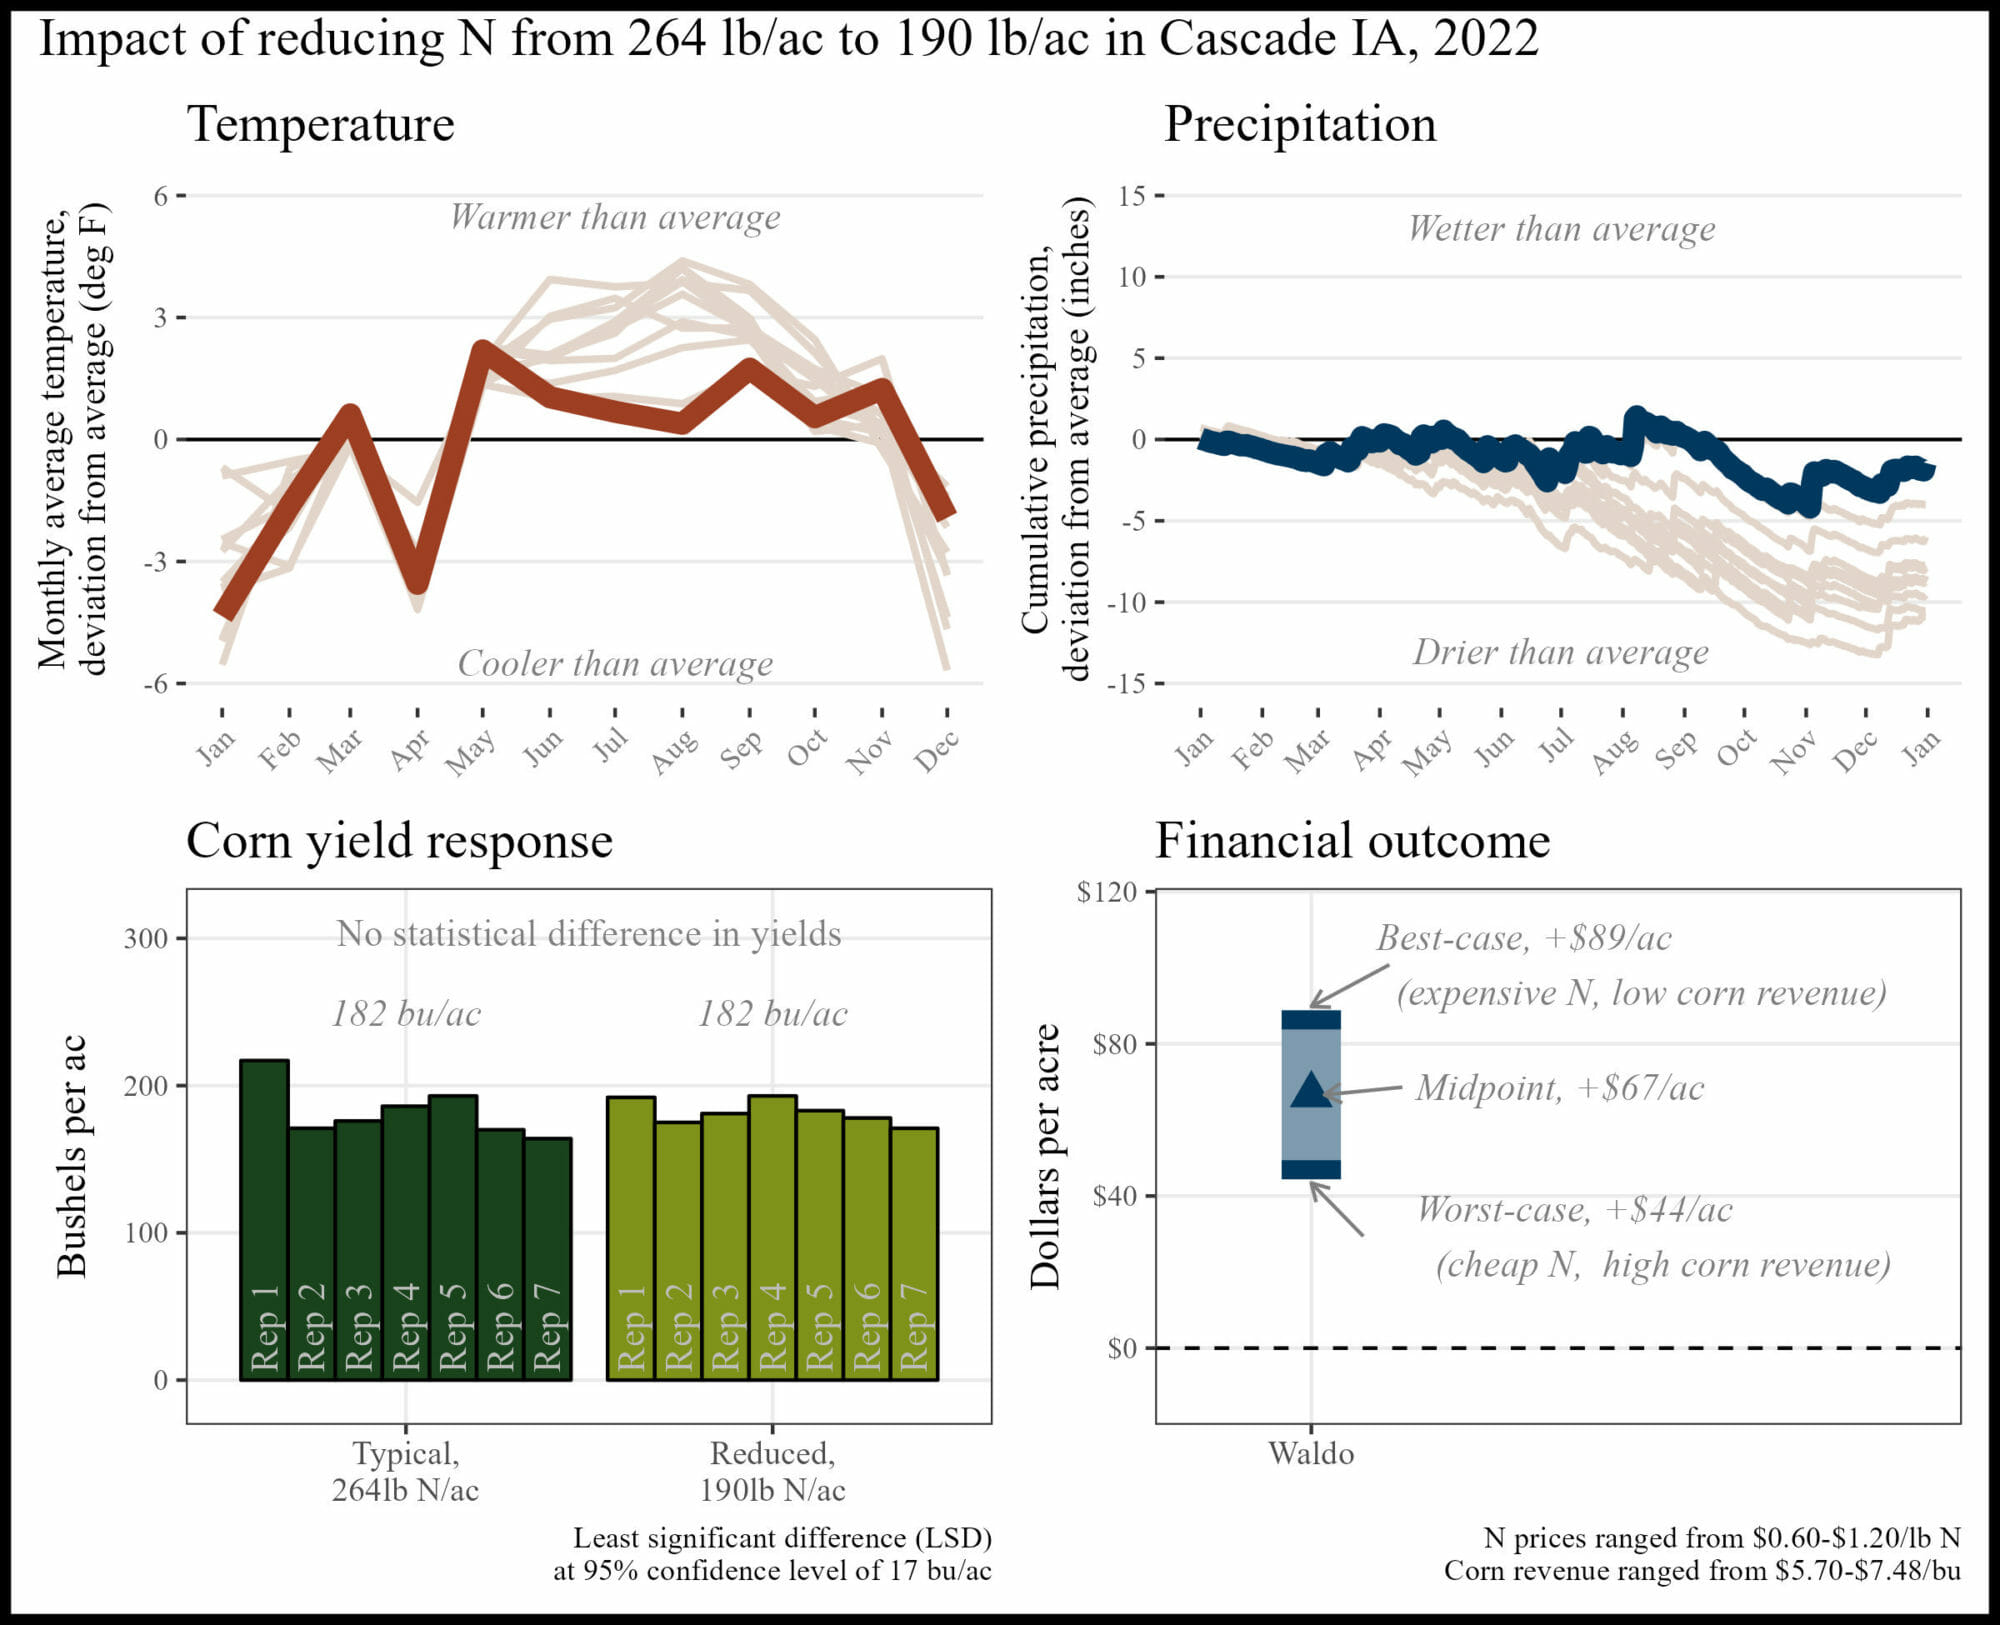
APPENDIX P. MARISSA WALDO, CASCADE IA
Oftentimes, side-dressing is just assumed to be necessary for an in-season N supply. It was eye-opening to see no significant yield difference between manure-only and manure + side dressing.
The financial outcome at the reduced N rate was likely a financial savings compared to the typical N rate. A 74 lb N/ac reduction saved money this year.
 Historical cropping system (5 year): No-till soybean, no-till corn, cereal rye, cereal rye cover crop, summer mix cover crop, grass/legume early-seeded cover crop
Previous crop: Soybeans and cereal rye cover crop
Replications and plot size: 4 reps, 20 feet wide strips, length of field
Corn planting/harvest date: May 14, 2022/not reported
Corn row spacing/planting density: 60 inch; 34,000 seeds/ac
Nitrogen sources and timing: Chemical, organic; at planting, side-dress
Historical cropping system (5 year): No-till soybean, no-till corn, cereal rye, cereal rye cover crop, summer mix cover crop, grass/legume early-seeded cover crop
Previous crop: Soybeans and cereal rye cover crop
Replications and plot size: 4 reps, 20 feet wide strips, length of field
Corn planting/harvest date: May 14, 2022/not reported
Corn row spacing/planting density: 60 inch; 34,000 seeds/ac
Nitrogen sources and timing: Chemical, organic; at planting, side-dress
Appendix Q. Detailed Methods
All data and code are available in a public github repository: https://github.com/vanichols/PFI_CanWeReduceN Weather data Each cooperator chose a US Census-recognized town with which to associate the trial. The latitude and longitude of the chosen town were used to retrieve weather data from the National Aeronautics and Space Administration (NASA) Prediction of Worldwide Energy Resources (POWER) project using the nasapower package1 for R software2. Data was downloaded for the period spanning January 1, 1992 through December 31, 2022. Two weather variables were used: (1) cumulative daily precipitation values and (2) the average daily air temperature at two meters above ground level. The weather data was separated into two data sets: one comprising the entire 30 years of data (historical weather data), and one containing only data from January 1 – December 31, 2022 (trial year data). To provide context for each trial’s temperatures, the historical mean temperature for month at a given site was calculated using the historical weather dataset. The historical value was subtracted from the trial year average temperature for that month to provide an estimate of the deviation from average conditions. For example, in Galva, Iowa the historical average temperature in April is 48 deg F. In 2022, the month of April had an average temperature of 44 deg F, resulting in a deviation of -4 deg F (cooler than average). To provide context for precipitation, the cumulative precipitation up to a given day was calculated for each year separately. The historical value was calculated as the average cumulative precipitation received up to a given calendar day. Like the temperature deviation calculation, this historical mean was subtracted from the cumulative precipitation for each calendar day in 2022. Continuing with the Galva, Iowa example, Galva historically receives an average of 11 inches of precipitation from January 1 through June 1. In 2022, Galva had received 10.6 inches, for a deviation of -0.4 inches (drier than average). Finances In the 2021/2022 suite of trials, farmers reported nitrogen prices ranging from $0.60/lb N up to $1.20/lb N. Not all farmers reported the price received for corn, so we used USDA National Agricultural Statistics Service (NASS)3data as reported by Iowa State University’s Ag Decision Maker,4 which provides a range in prices received for corn in Iowa for the year 2022.
Funding Acknowledgement
This material is based upon work supported by the U.S. Department of Agriculture, under agreement number NR216114XXXXG003. Any opinions, findings, conclusions, or recommendations expressed in this publication are those of the author(s) and do not necessarily reflect the views of the U.S. Department of Agriculture. In addition, any reference to specific brands or types of products or services does not constitute or imply an endorsement by the U.S. Department of Agriculture for those products or services. USDA is an equal opportunity provider, employer, and lender.
References
- Sparks A. 2018. Nasapower: A NASA POWER Global Meteorology, Surface Solar Energy and Climatology. Data Client for R. The Journal of Open Source Software. 3(30), 1035. doi:10.21105/joss.01035. https://power.larc.nasa.gov/ (accessed June 2023).
- R Core Team (2022). R: A language and environment for statistical computing. R Foundation for Statistical Computing, Vienna, Austria. URL https://www.R-project.org/. (accessed June 2023).
- US Department of Agriculture-National Agricultural Statistics Service. Quick stats. USDA-National Agricultural Statistics Service. https://quickstats.nass.usda.gov/ (accessed June 2023).
- Johanns, A. 2023. Iowa Cash Corn and Soybean Prices. A2-11. Ag Decision Maker. Iowa State University Extension and Outreach. https://www.extension.iastate.edu/agdm/crops/pdf/a2-11.pdf (accessed June 2023).