In a Nutshell:
- The practice of cover crop grazing provides economic returns, and farmers wonder if benefits to soil health follow suit. Economic returns are realized within a year’s time, while soil health impacts seemingly are slower to manifest.
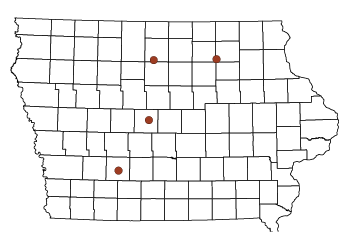
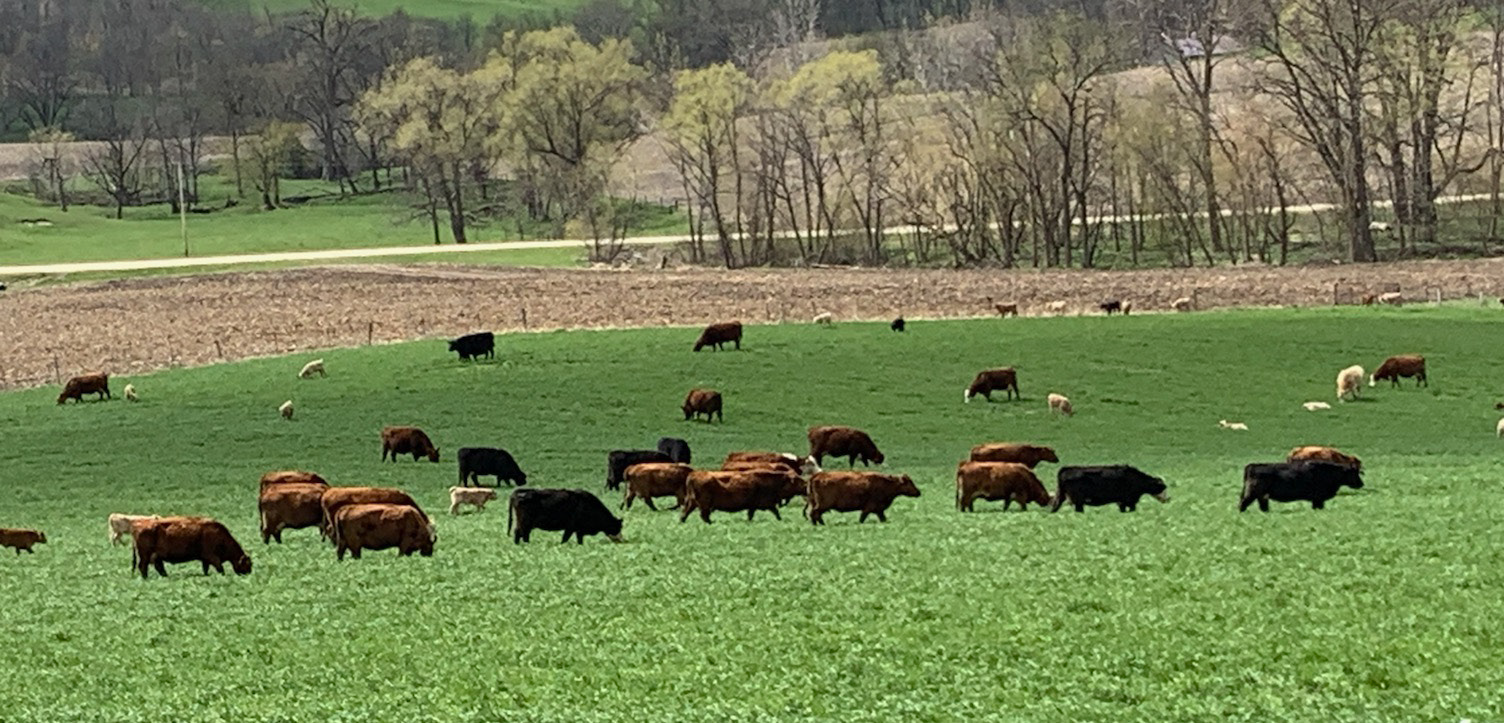
- It is common for nearby cattle and row crop farmers to partner in order to graze cover crops. Nick Smith grazed his cattle on Tim Daly’s cover crop fields. The pair kept cover crop records and Nick sampled soil in April of each year.
Key Findings:
- Both cooperators profited from grazing cover crops within the year of planting. Smith profited an average of $158.47/ac. Daly profited an average of $27.14/ac.
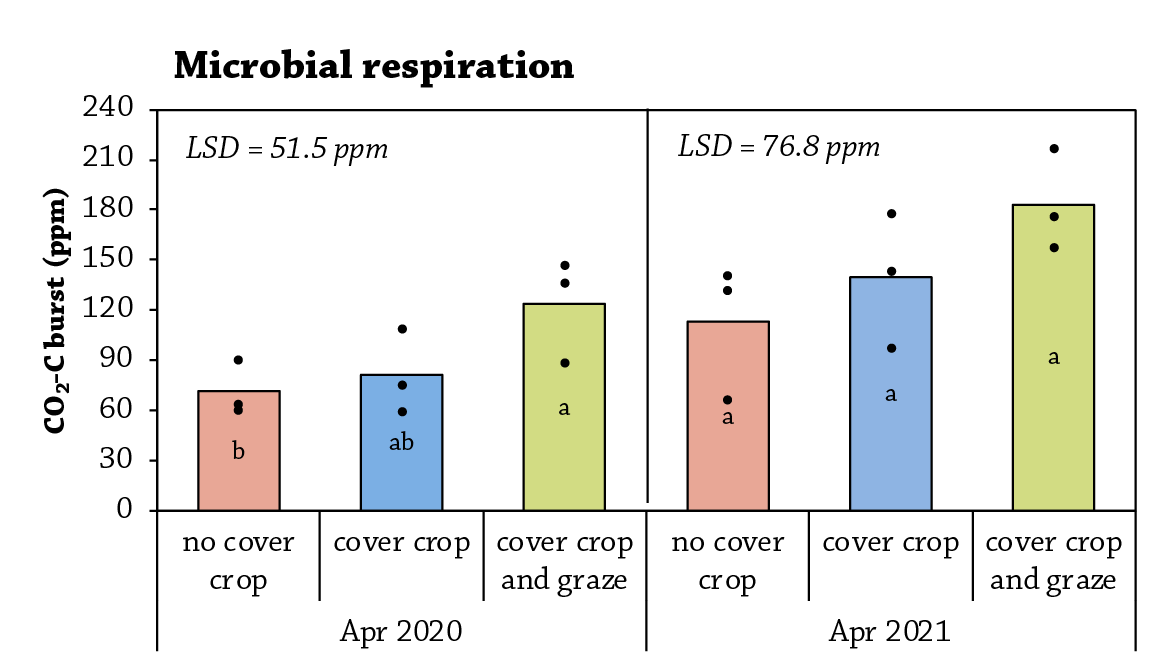
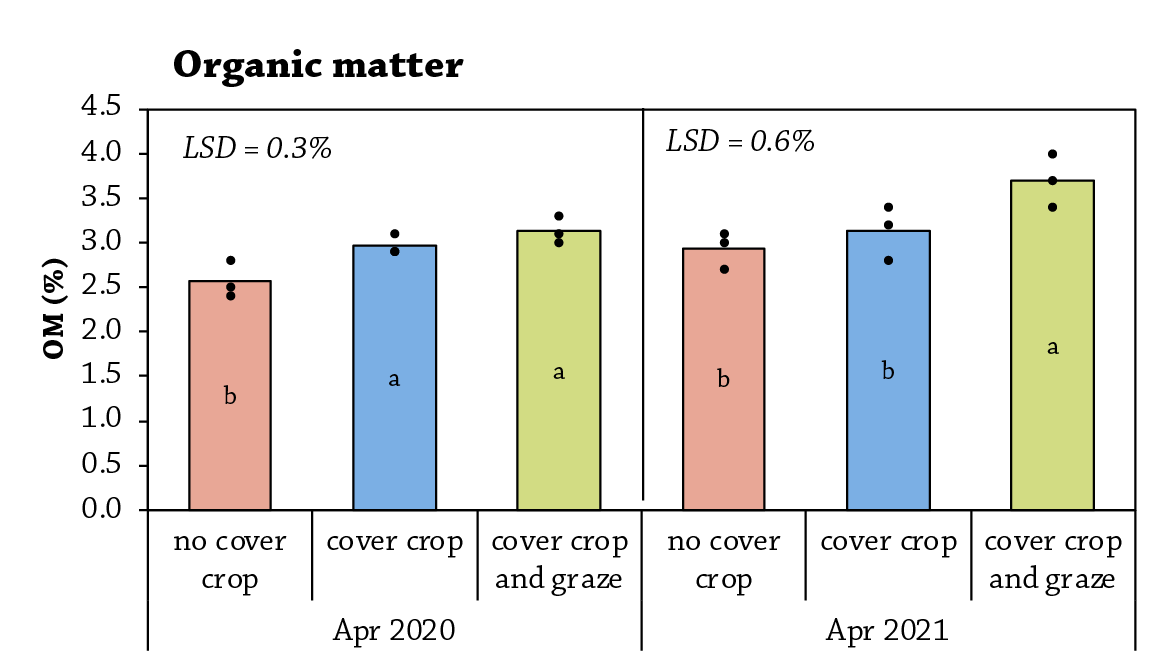
- Soil samples from April 2020 and 2021 showed more microbial respiration and organic matter in the field in which cover crops were grazed compared to the field that did not have cover crops.
Background
“We wanted to determine the economic and soil health impact of the fields where we contract graze. This is something we’ve been doing for a few years and we wanted to quantify the benefits for our neighbor Tim,” said Nick Smith, who grazes cover crops and corn stalks in a field owned by his neighbor, Tim Daly. Not only do cover crops protect the soil, but profits can be achieved when livestock graze cover crops.[1,2] It is also known that grazing cover crops can provide benefits to soil health, but the effects are longer term [1] and require proper grazing management. To determine the impact of the practice, Smith and Daly compared economics and soil health data between fields that were managed differently between fall 2019 and spring 2021.
Methods
DesignIn order to determine the effects on economics and soil health on cover crop and grazing management, Smith and Daly established three treatment fields:
- No cover crops with no grazing
- Cover crops with no grazing
- Grazed cover crops
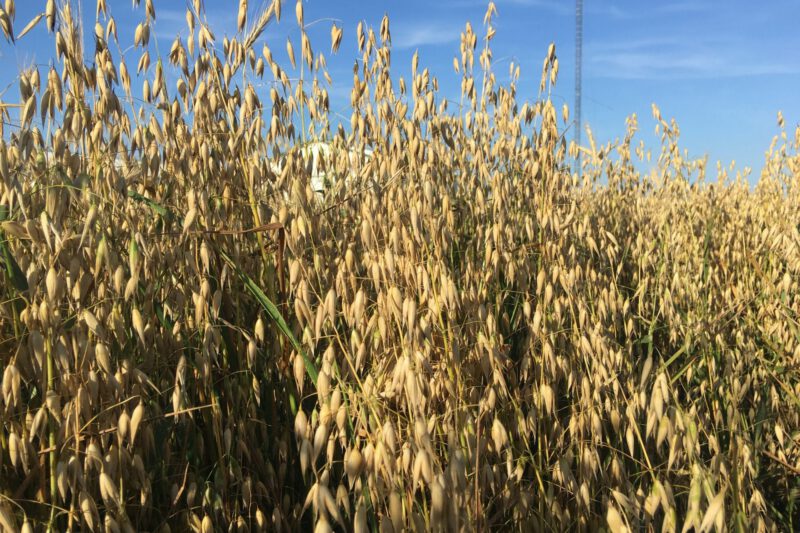
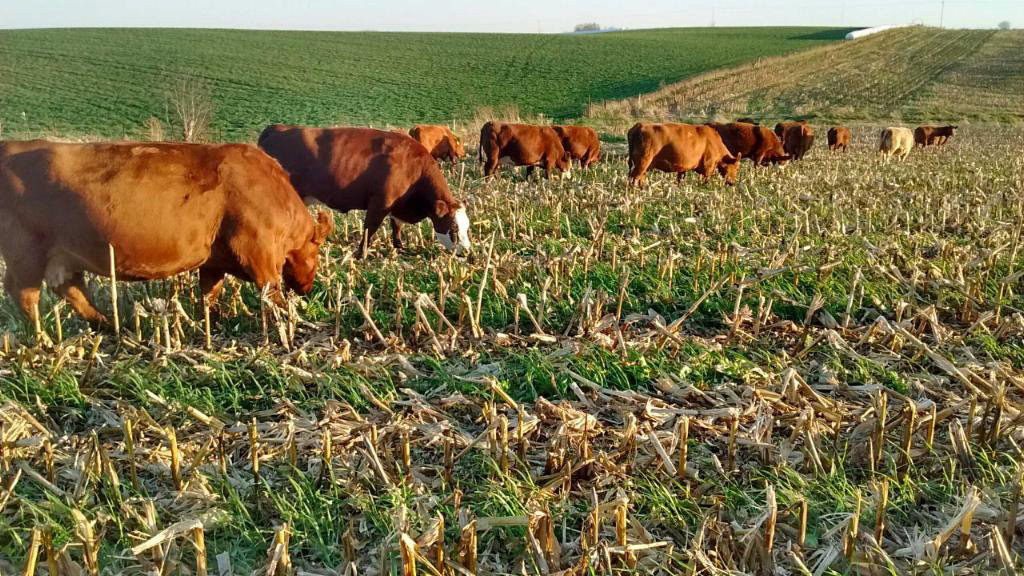
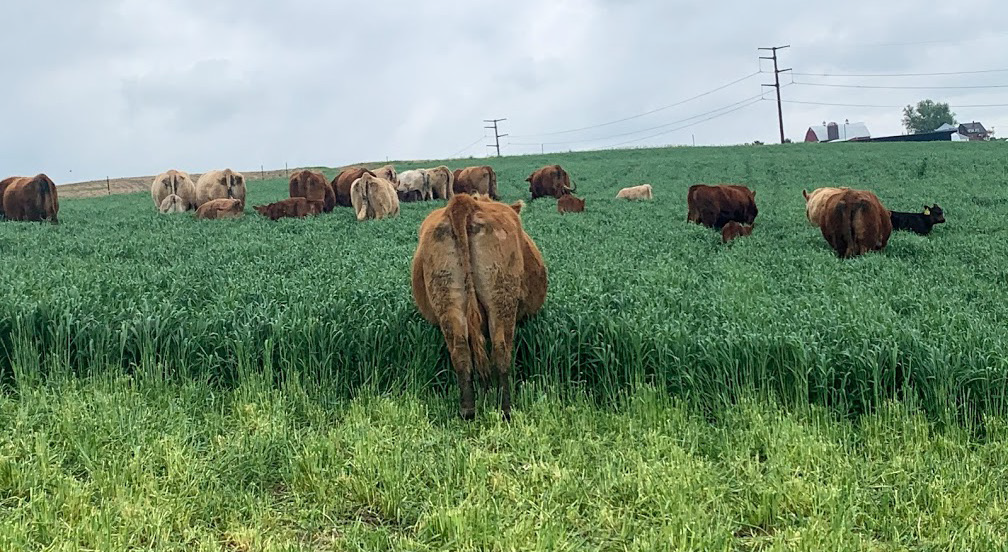
In September 2019 and 2020, Daly aerial seeded a cover crop mix that consisted of oats (38 lb/ac), cereal rye (56 lb/ac) and radish (2 lb/ac) on 350 acres. As soon as the crop fields were harvested each fall, cattle were turned out in the ‘grazed cover crops’ field only. Grazing commenced in October each year and different fields were grazed until February or March. Spring grazing took place between mid-April and late May.
Grazing Economics
Smith and Daly recorded cover crop expenses and grazing data in the grazed cover crop fields, which were used to estimate the forage value of cover crops on each farm using ISU’s Ag Decision Maker Economics of Cover Crops tool.[3] This tool takes into account revenue and costs associated with cover crop grazing. Revenue includes the value of feed replaced by grazing, cost-share payments received, crop insurance discounts and reduced labor due to grazing instead of feeding stored feed. Expenses include costs for establishing cover crops, additional herbicide and labor needed for cover crop termination, additional labor required, fence and water infrastructure.
The value of feed replaced by grazing assumes cattle would have been fed hay valued at $150/ton if cover crops were not available to graze. The tool takes into account number of cattle grazed, average weight of livestock, number of grazing days and cooperator estimates of dietary needs provided by supplemental feed and crop residue. The tool assumes cattle consume 4% of their bodyweight in forage dry matter (DM) each day (2.5 to 3.0% intake, 0.5% trampling loss and 0.5-1.0% buffer).[4] All formulas are nested within the tool.
Net profit is reported on a per acre and a per animal unit (AU) basis. An animal unit is equal to 1,000 lb of animal. Net profit was calculated two ways – 1) including cost-share and crop insurance discounts and 2) without including cost-share or crop insurance discounts.
This economic analysis did not take into account effects on cash crop yield, soil retention value, nutrient retention value, soil health value, nutritional value of forage or animal weight gain.
Results and Discussions
Economic impact
The economic results are presented by year and by farmer (Table 1). Total savings are shown for both Smith and Daly, in order to illustrate the impact to both the grazier and the row-crop farmer. “Tim pays for the establishment of cover crops and I reimburse him for half of the cost,” explained Smith. Daly also incurs a $4.50/ac termination cost that he would not have if no cover crops were planted.
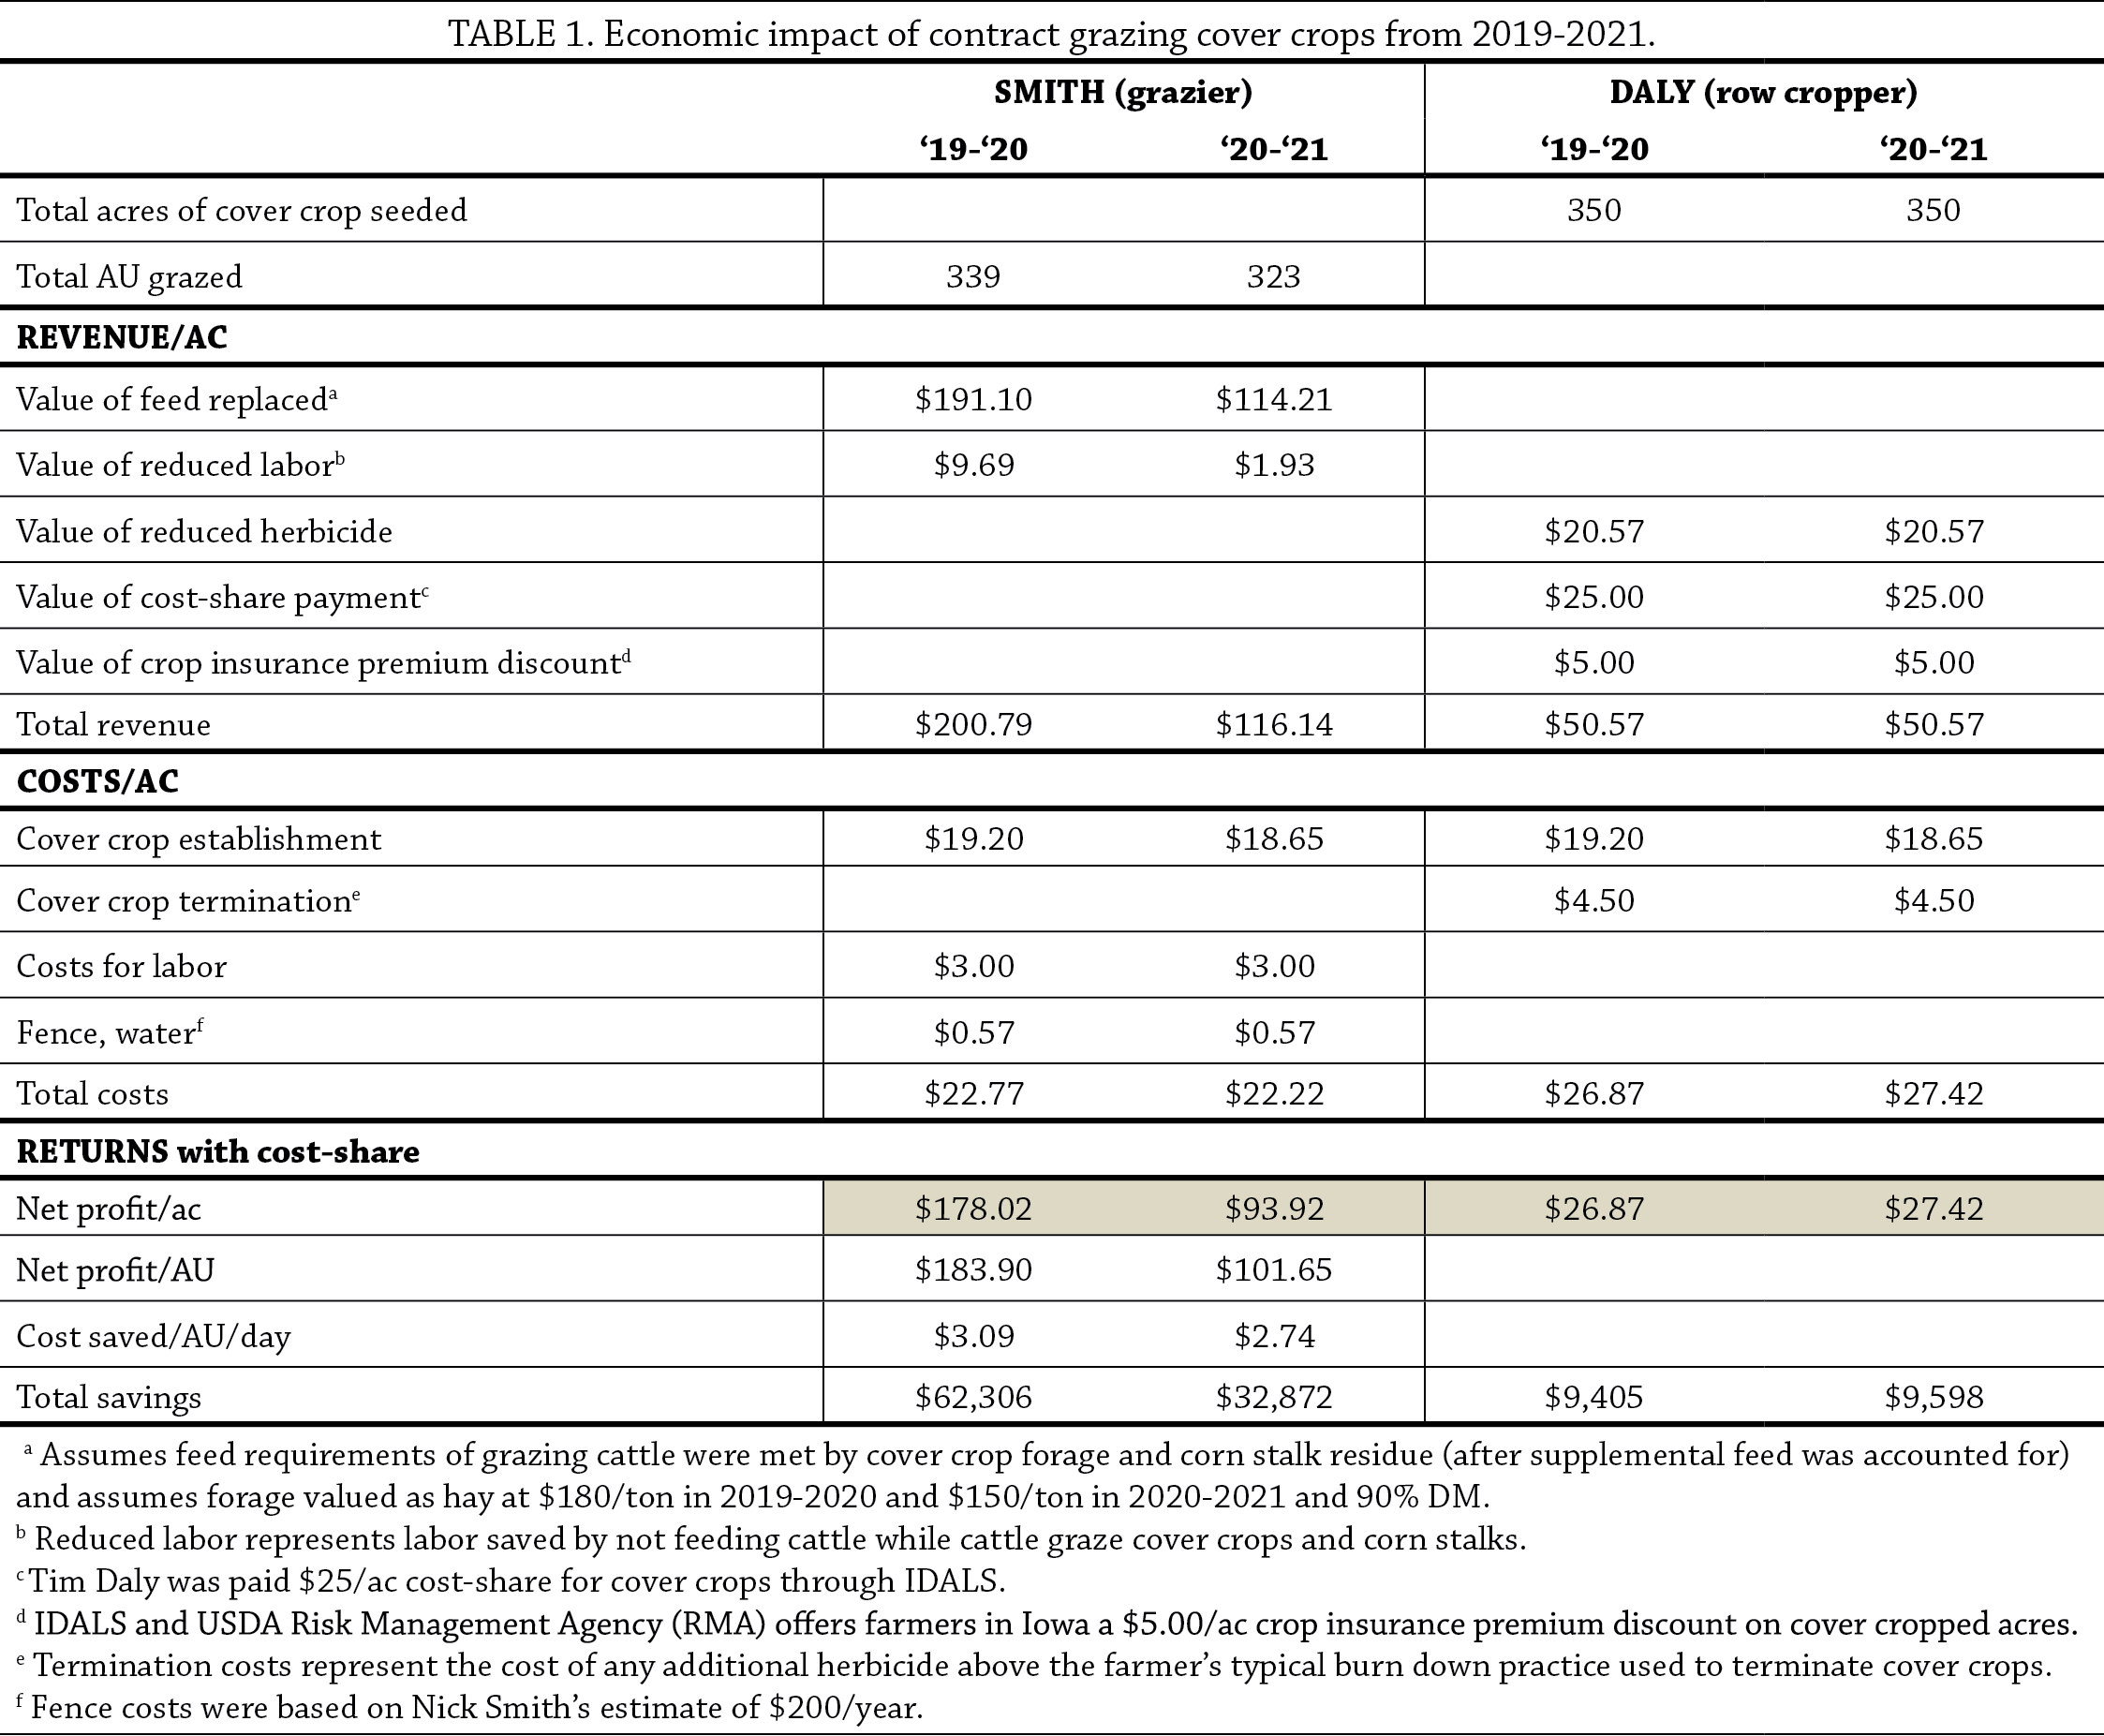 On average, cover crop establishment cost $37.85/ac. Smith’s profits from grazing averaged $158.47/ac due to the amount of feed replaced by grazing cover crops and the labor he was able to save by not having to feed cattle. The labor required for grazing, which consisted of putting up single strand electric wire and moving cattle from paddock to paddock, was included in the analysis. Grazing profits were greater in 2020 than in 2021. “Hay was quite a bit cheaper this year (2021) compared to last year because of weather conditions,” explained Nick; he reported hay costs of $180/ton in 20201 and $150/ton in 2021.
“When it’s all said and done, I saved $2.92 per AU per day versus what it would cost to feed cattle in a dry lot scenario,” said Smith. This is an important finding considering winter feed costs represent the single largest cost in cattle operations.[5] Grazing cover crops can reduce winter feed costs.
Daly’s profits averaged $27.14/ac. This was due to the cost-share payments and crop insurance discounts he received for planting cover crops ($25/ac from the Iowa Department of Land Stewardship and Agriculture (IDALS) and $5/ac as a crop insurance discount). Without cost-share, Tim would have incurred an average $2.85/ac loss. Tim said that he reaps savings that were not quantified in the study because he “is able to get away with one herbicide pass during the crop growing season due to cover crops suppressing weeds.” Tim also looks towards long-term soil health benefits from the cover crops and grazing that make the practice worth it to him.
On average, cover crop establishment cost $37.85/ac. Smith’s profits from grazing averaged $158.47/ac due to the amount of feed replaced by grazing cover crops and the labor he was able to save by not having to feed cattle. The labor required for grazing, which consisted of putting up single strand electric wire and moving cattle from paddock to paddock, was included in the analysis. Grazing profits were greater in 2020 than in 2021. “Hay was quite a bit cheaper this year (2021) compared to last year because of weather conditions,” explained Nick; he reported hay costs of $180/ton in 20201 and $150/ton in 2021.
“When it’s all said and done, I saved $2.92 per AU per day versus what it would cost to feed cattle in a dry lot scenario,” said Smith. This is an important finding considering winter feed costs represent the single largest cost in cattle operations.[5] Grazing cover crops can reduce winter feed costs.
Daly’s profits averaged $27.14/ac. This was due to the cost-share payments and crop insurance discounts he received for planting cover crops ($25/ac from the Iowa Department of Land Stewardship and Agriculture (IDALS) and $5/ac as a crop insurance discount). Without cost-share, Tim would have incurred an average $2.85/ac loss. Tim said that he reaps savings that were not quantified in the study because he “is able to get away with one herbicide pass during the crop growing season due to cover crops suppressing weeds.” Tim also looks towards long-term soil health benefits from the cover crops and grazing that make the practice worth it to him.
Conclusions and Next Steps
The economic results from this project show that contract grazing cover crops can provide short-term economic benefits and pay off in one year. The row-crop farmer in this arrangement would not have profited without cost-share, but Daly claims he reaps economic benefits later in the season by saving herbicide due to less weed pressure. The preliminary soil health benefits measured in this study are promising and may translate to economic profits in the future. Next, Smith would like to try interseeding different mixes of cover crops for early growth and more biomass. “We’re figuring out ways to be as efficient as we can with these fields.”
Funding Acknowledgement
This material is based upon work supported by the Natural Resources Conservation Services, U.S. Department of Agriculture, under number NR186114XXXXG002. Any opinions, findings, conclusions, or recommendations expressed in this publication are those of the author(s) and do not necessarily reflect the views of the U.S. Department of Agriculture.
Appendix - Weather Conditions

References
- Myers, R., Weber, A., S. Tellatin. 2019. Cover Crop Economics. SARE Technical Bulletin. https://www.sare.org/Learning-Center/Bulletins/Cover-Crop-Economics (accessed April 2020).
- Filbert, M. 2020. Economic and Soil Health Impact of Grazing Cover Crops, 2018-2019. Practical Farmers of Iowa Cooperators' Program. https://practicalfarmers.org/research/economic-and-soil-health-impact-of-grazing-cover-crops-2018-2019/ (accessed July 2021).
- Edwards, E., Plastina, A., and M. Filbert. 2018. Economics of Cover Crops. Iowa State University Ag Decision Maker. https://www.extension.iastate.edu/agdm/crops/html/a1-91.html (accessed April 2020).
- NRCS. 2009. Balancing your Animals with your Forage. USDA. 2–5. https://www.nrcs.usda.gov/Internet/FSE_DOCUMENTS/stelprdb1097070.pdf (accessed April 2020).
- Boetel, B. 2017. In The Cattle Markets: Cost of Wintering Cattle. Drovers. https://www.drovers.com/article/cattle-markets-cost-wintering-cattle (accessed April 2020).
- Iowa Environmental Mesonet. 2021. Climodat Reports. Iowa State University. http://mesonet.agron.iastate.edu/climodat (accessed November 2021).