

In a Nutshell:
- Two farms provided enterprise budgets for cherry tomato production in 2018.
- Yield, revenue, net income and details about expenses and labor are reported by each farm.
Key Findings
- The two farms were similar in their net income per pound, with the Johnsons netting slightly less ($1.79/lb) compared to Roller/Schintler ($2.42/lb).
- Per square-foot, however, the Johnsons netted $3.76/ ft2, while Roller/Schintler netted $2.11/ft2.
- The Johnsons harvested 2.10 lb of fruit per square-foot; over double that of Roller/Schintler at 0.87 lb/ft2.
- Labor was the largest contributor to production expenses on both farms, accounting for 69% of total costs at Roller/Schintler and 74% of total costs at the Johnson’s farm.
- At the Johnsons’, harvest accounted for 42% of the total labor-hours; at Roller/Schintler’s harvesting was 53% of total labor-hours.
Background
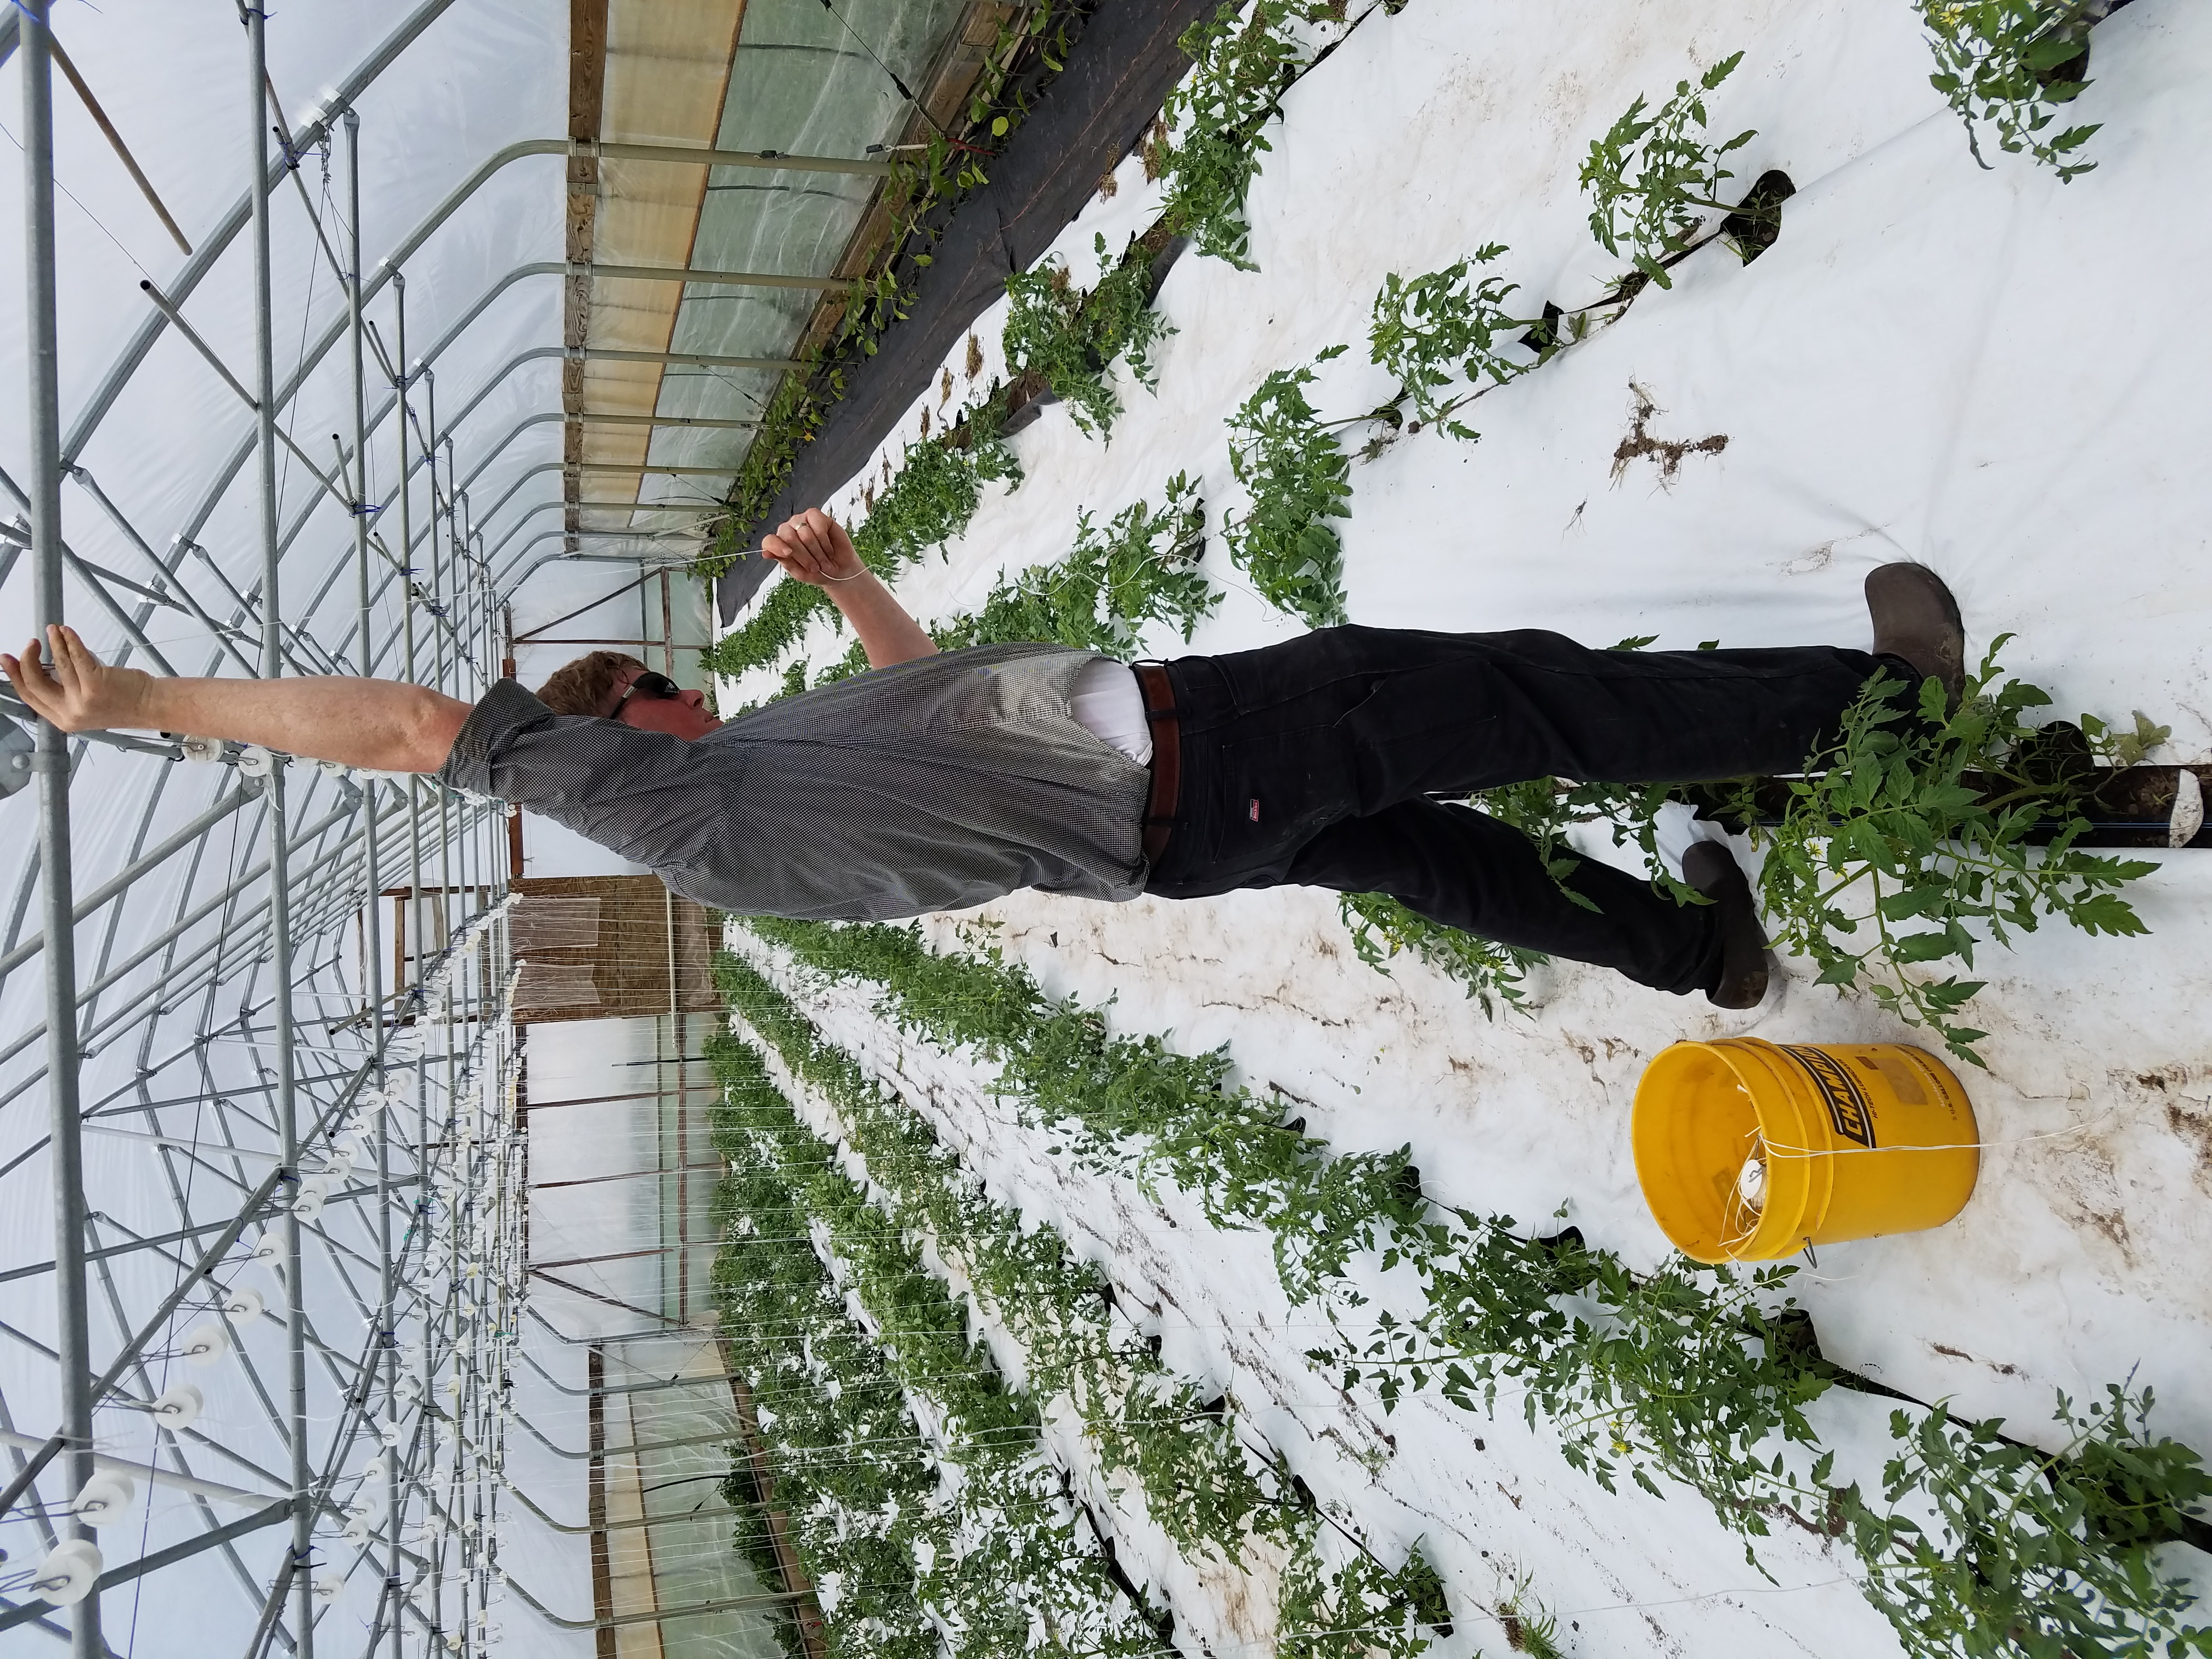
Marcus Johnson uses his height to install trellis strings on May 30.
Cherry tomatoes are popular with consumers, but are also a labor-intensive crop. In 2017, farmers at two farms each completed an enterprise budget to determine if the labor expense required for cherry tomatoes made sense for their farm.[1] Both farms showed that cherry tomatoes were a profitable crop, but one of the farms, Eric and Ann Franzenburg of Pheasant Run Farm, decided that they could better use the space and labor time on crops that had higher profit potential, and dropped their cherry tomato production. The other farm, Emma and Marcus Johnson of Buffalo Ridge Orchard, went the other way; increasing their cherry tomato production, and opting to report a second year of enterprise budget data for cherry tomatoes. The Johnsons were joined in the present study by Derek Roller and Molly Schintler of Echollective Farm.
University extension programs offer enterprise budgets examples for tomatoes, but not for cherry tomatoes. Iowa State University provides a high tunnel budget example with slicer tomatoes, breaking down expenses and labor, showing a net income of $3.14/ft2.[2] Practical Farmers’ research cooperators have previously done enterprise budgets for high tunnels,[3,4] cucumbers,[5,6] cherry tomatoes[1] and strawberries.[7] Farmers have found the results useful to their bottom line, have improved farmer-to-farmer conversations about production and marketing, and helped them focus on finding and discussing labor inefficiencies. Producers still have questions about the differences in their variety choices and management decisions, and how those variations by farm impact the bottom line.
Objective: In this enterprise budget report for cherry tomato production, revenue, expenses, net income, production practices and a breakdown of labor by task are shared for the two farms.
Methods
Each farm planted and managed cherry tomatoes according to their own timing, markets and preferred practices. Data collected from each farm was standardized to provide insight into cost and labor efficiency at each farm. Planting and management details can be found in Table 1. The Johnsons and Roller/Schintler both tracked data on high tunnel cherry tomatoes which are trellised to maximize space and lengthen the harvest window.
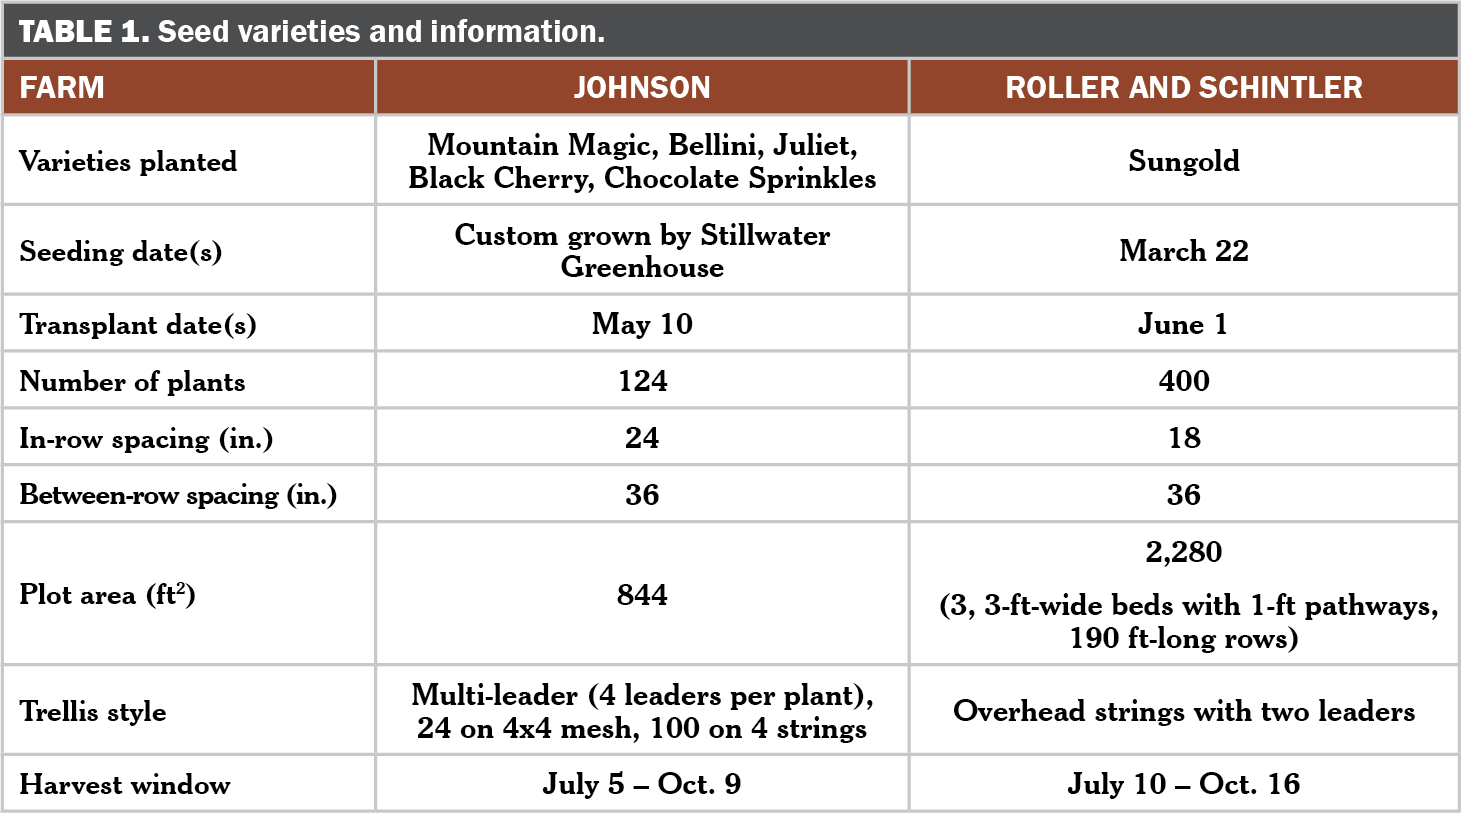
At Buffalo Ridge Orchard near Central City in Linn County, Emma and Marcus Johnson trellised multi-leader cherry tomatoes in their unheated, moveable high tunnel. This year, they grew five varieties: Bellini, Black Cherry, Chocolate Sprinkles, Juliet and Magic Mountain. These varieties are a variety of colors, sizes and shapes, but are all indeterminate and appropriate for trellising. The Johnsons sold cherry tomatoes at farmers market and to some larger institutional buyers.
Derek Roller and Molly Schintler of Echollective Farm near Mechanicsburg in Cedar County performed the enterprise budget for this study on their crop of Sungold cherry tomatoes; a favorite variety among customers, but with fruit prone to cracking. They trellised tomatoes on string, with two leaders per plant.
Results and Discussion
Net income
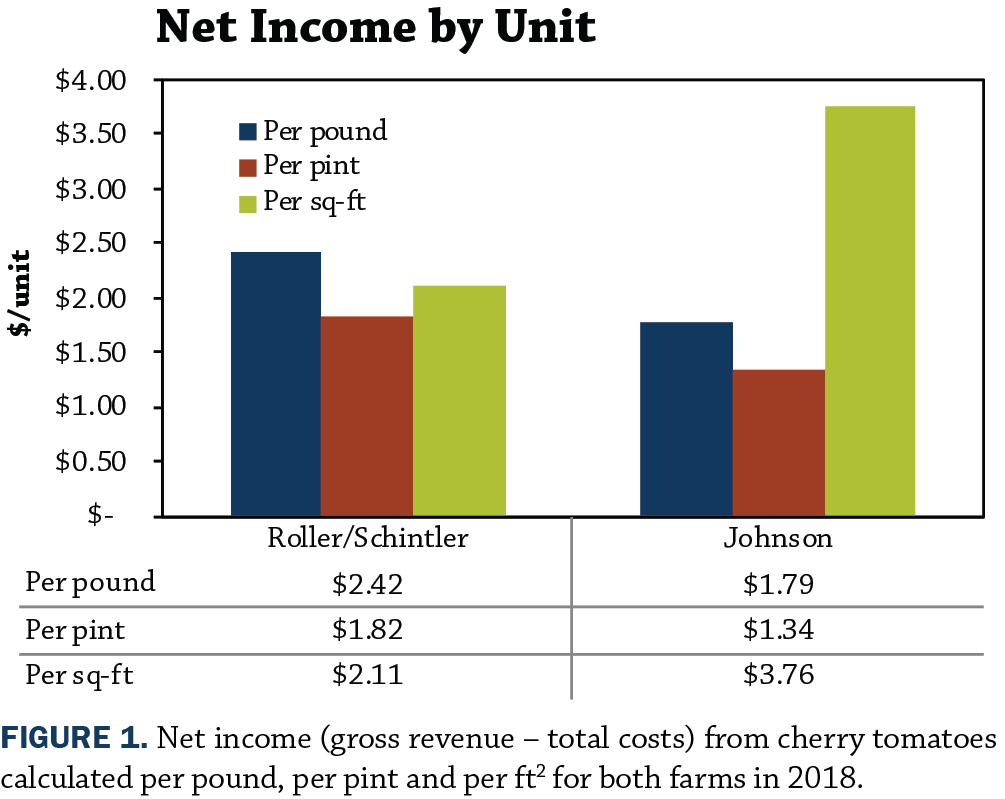
Revenue, costs and net income were analyzed three ways: per pound sold, per pint sold and per square-foot in production. As seen in Figure 1, cherry tomatoes were profitable for both farms, and Roller/Schintler earned more net income per pound and per pint compared to the Johnsons. The two farms were similar in their net income per pound, with the Johnsons netting $1.79/lb compared to Roller/Schintler netting $2.42/lb. This ratio is the same as per pint, as both farms assume pints weigh 0.75 lb. Per square-foot, however, the Johnsons had a higher net income with$3.76/ ft2, while Roller/Schintler netted $2.11/ft2.
Yield and revenue
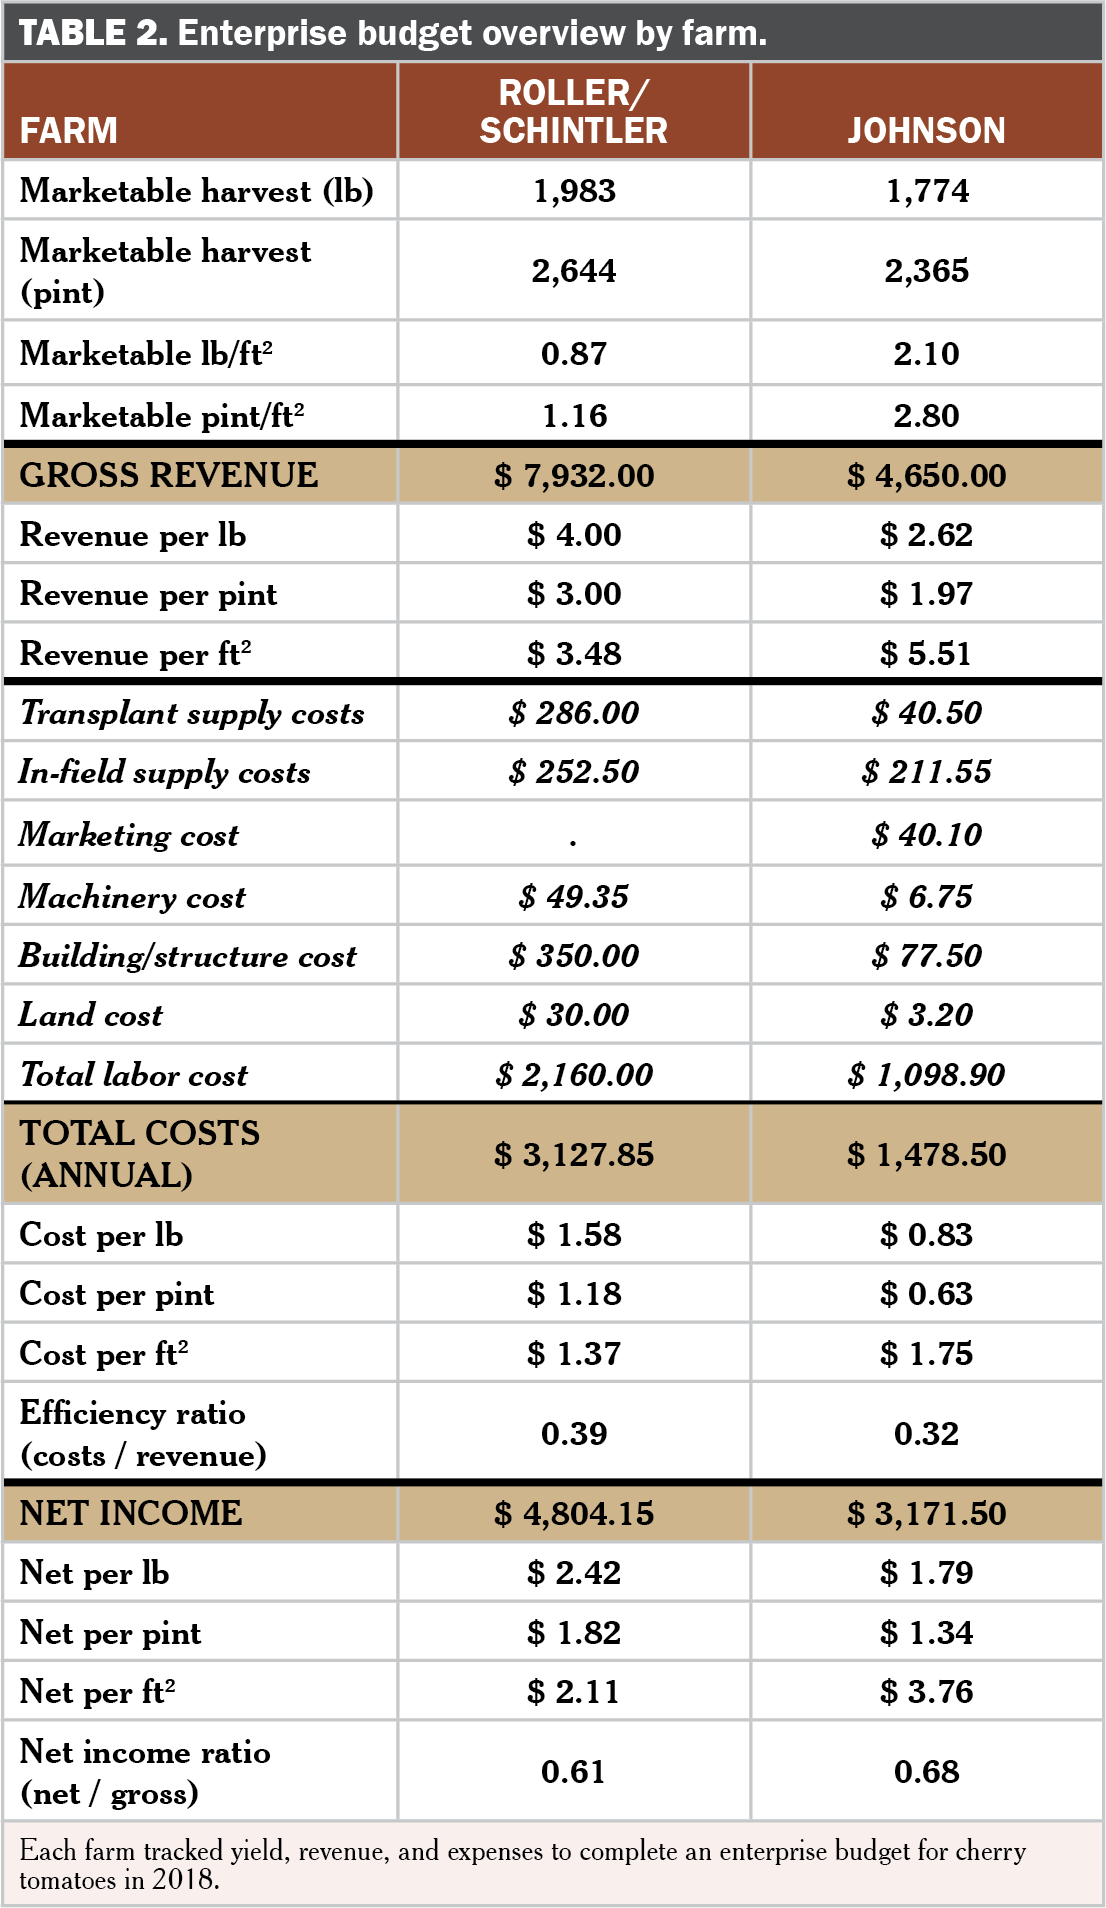
Looking at the enterprise budgets in Table 2, differences in yield and expense categories begin to emerge. As detailed in the top portion of Table 2, the Johnsons harvested 2.10 lb of fruit per square-foot; more than double the yield of Roller/Schintler’s, at 0.87 lb/ft2. This indicates that the Johnsons were very productive with their use of space in the high tunnel. Their prices, however, were lower, and expenses were $0.38/ft2 higher than Roller/Schintler’s. Harvest windows were nearly identical, from July through October.
Variety matters when picking small fruit by hand. In 2017 the Johnsons trialed four new cherry tomato varieties; only one of those, Black Cherry, they continued growing in 2018. Some of their varieties in 2018 were smaller-fruited (0.5 – 0.7 oz/fruit), including Black Cherry and Sunpeach. Esterina and Juliet have slightly larger fruits (0.5 – 1.0 oz), while Mountain Magic are much larger: 2.0 oz/fruit. In comparison, Roller/Schintler did their enterprise budget work only on their Sungold production, which accounts for 60% of their total cherry tomato production. Sungolds are notorious for splitting, and are quite small: 0.5-0.7 oz/fruit.
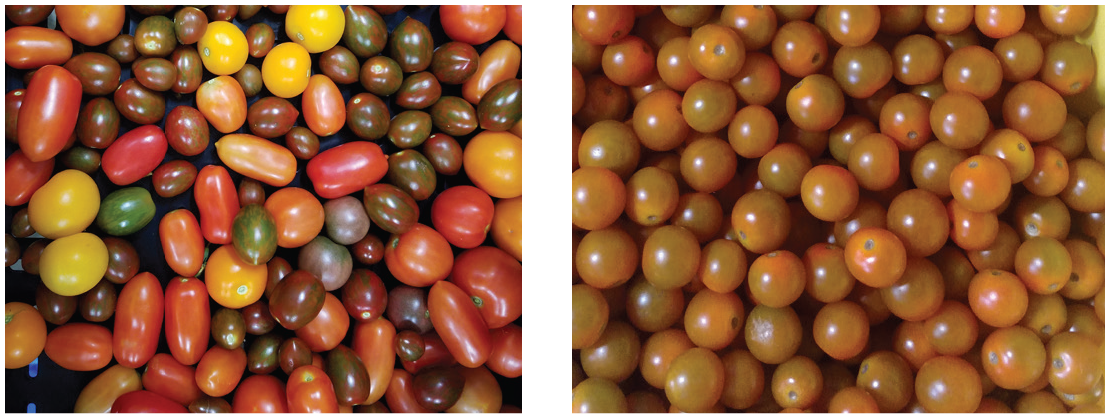
Left: The Johnsons grew five varieties of cherry tomatoes in 2018, ranging in size from 0.5 oz to 2.0 oz. Right: Sungold cherry tomatoes harvested at Roller/Schintler’s in 2018.
Roller/Schintler’s overall revenue was higher per pound and per pint; they averaged $3.00/pt in revenue compared to $1.97/pt at the Johnsons’ (Table 2). Emma Johnson noted the difference in revenue per unit received between the farms, and the difference was likely related to their markets. “We sell some cherry tomatoes at farmers market,” she said, “but we grow them for wholesale and we sell them to wholesale, which is why our price is so low.” Additionally, both growers agreed that because of the difficulty of growing Sungolds, they rightfully sell at a premium price.
Roller and Schintler were curious about their Sungold profitability, and in future years, are considering comparing the profitability of Sungolds (for which they charge a premium), to other varieties of cherry tomatoes. Said Roller, “We grow enough Sungolds for our markets, and do try to sell larger cherry tomatoes as we can. It does make a huge difference in the end, picking each one by hand. As more markets develop, we will try to do less of the Sungolds and more of the larger cherries.”
Production costs
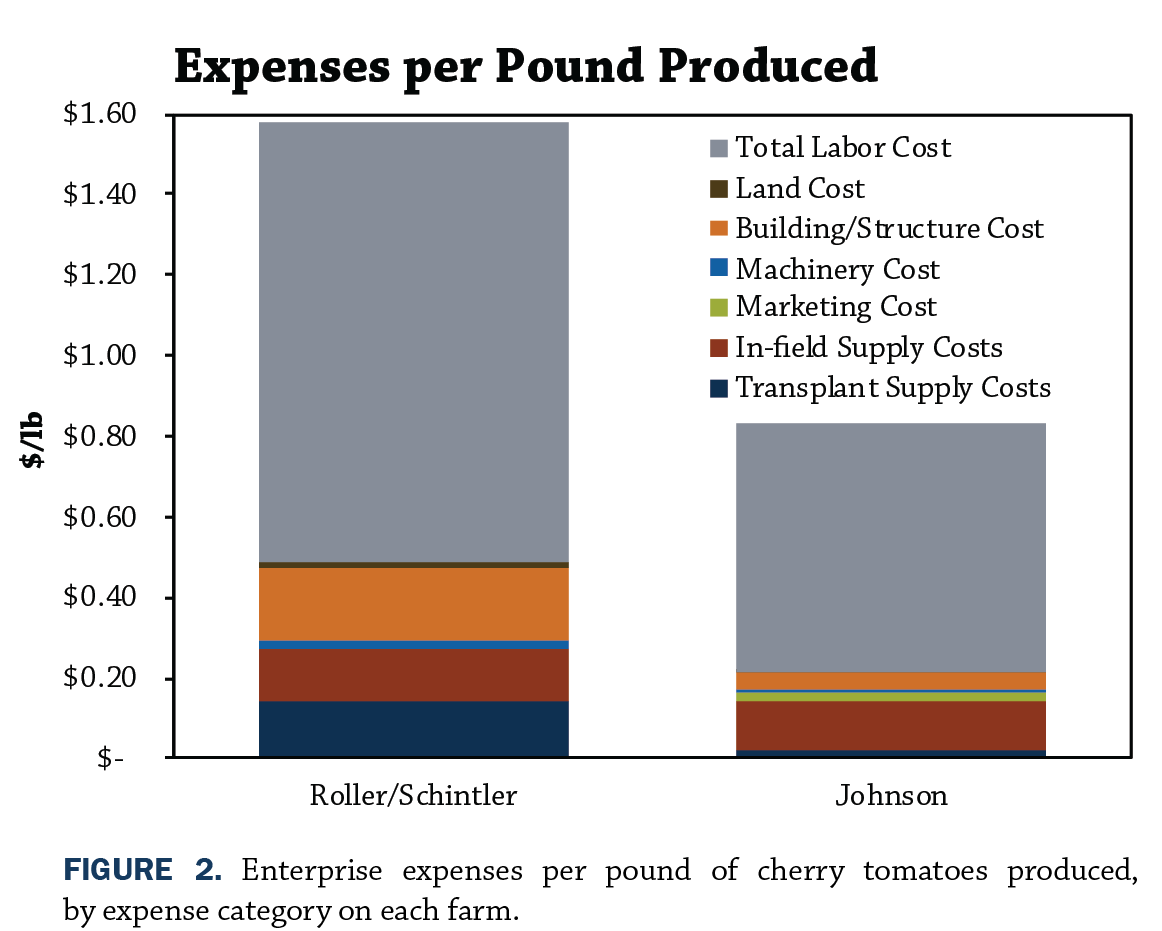
Labor was the largest contributor to production expenses on both farms, accounting for 69% of total costs at Roller/Schintler’s, and 74% of total costs at the Johnsons’. In-field supplies were the next largest expense category for the Johnsons; structures, in-field supplies, and transplant supplies were the remaining bulk of expenses at Roller/Schintler’s. This breakdown can be seen in actual dollar amounts in Table 2, and by proportion in Figure 2.
Overall, Roller/Schintler had the higher costs per pound and per pint, but the Johnsons had the higher cost of production per square-foot (Table 2). Both farms had strong net income ratios for their cherry tomatoes; 0.39 for Roller/Schintler and 0.32 for the Johnsons (Table 2). According to Iowa State University, net income ratios of 0.35 and higher are considered excellent.[8]
Labor for cherry tomato production
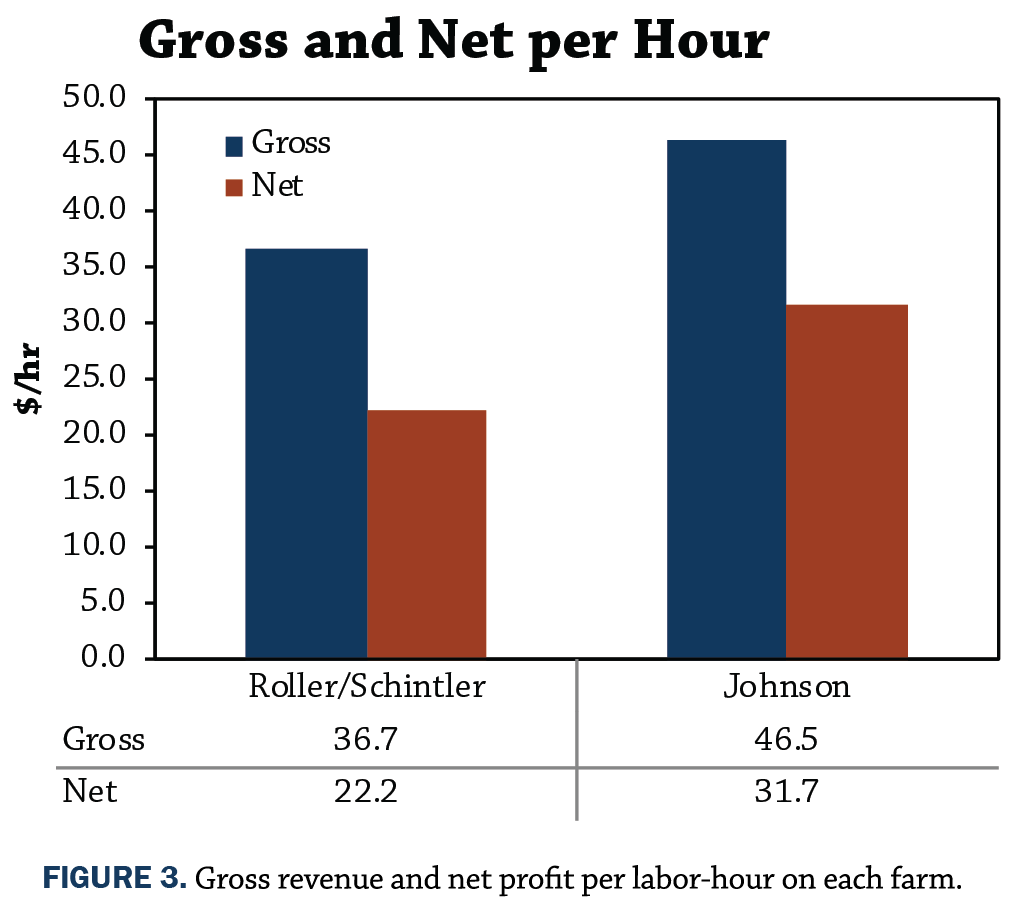
As discussed in the enterprise budget section, labor is the primary cost for each farm’s cherry tomato production. Are these hours well spent? Figure 3 provides the gross revenue and net income per labor-hour by farm. Gross revenue per labor-hour, shown in blue, ranges from $36.70 for Roller/Schintler to $46.50 for the Johnsons, while net income (shown in red) ranges from $31.70 per labor-hour for the Johnsons to $22.20 for Roller/Schintler. By these numbers, both farms are profitably using their time.
“We were really concerned about the amount of labor for cherry tomatoes; especially the time spent harvesting,” said Marcus Johnson. By percent of total time spent on labor at each farm, harvesting accounted for the bulk of labor with cherry tomatoes (Figure 4). On the Johnson farm, harvesting accounted for 42% of the total labor; at Roller/Schintler’s harvesting was 53% of total labor hours. Financially, harvest labor costs $0.33/lb for Johnsons, and $0.45/lb at Roller/Schintler’s. Emma Johnson notes that the quality of the worker and speed of harvest is important for cherry tomatoes, and that on their farm, no one is a better harvester than her mom, Mary Zahradnik: “Other people would not work as efficiently; she picks a flat – about 20 pounds – in an hour.”
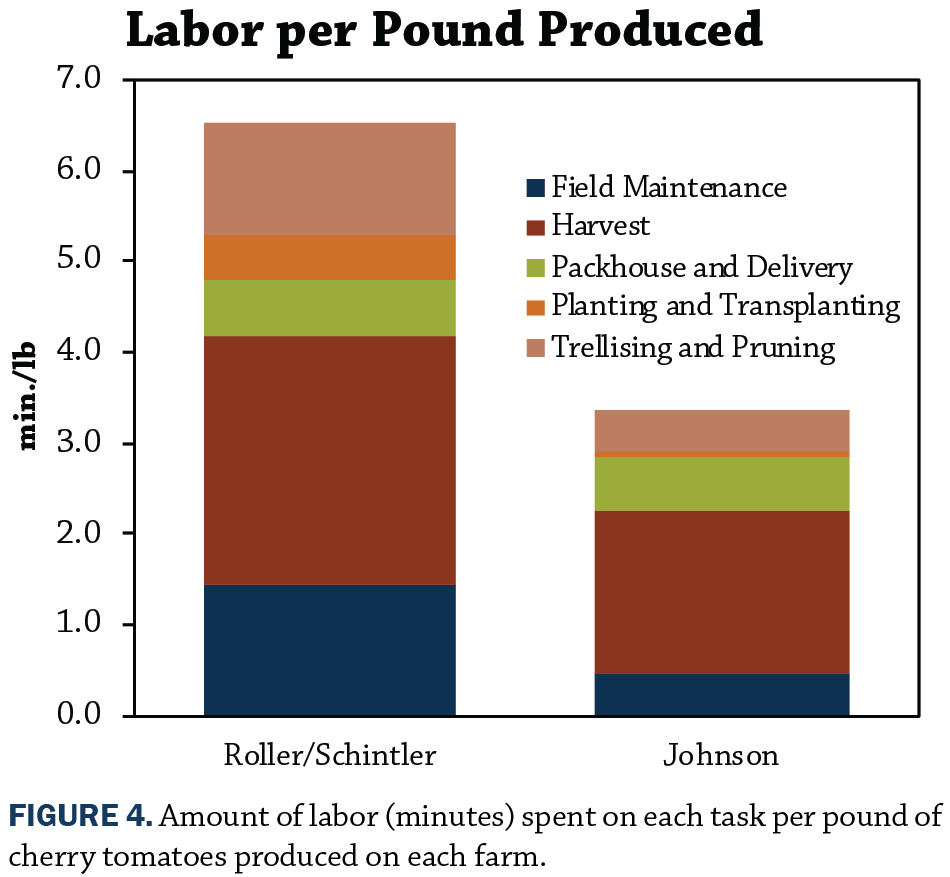
At the Johnsons’, work in the packhouse, marking and delivery accounted for 17% of the labor; trellising accounted for 14% of the labor, and field maintenance was 13%. At Roller/Schintler’s, trellising and pruning took 19% of their labor, and field maintenance and prep accounted for 22% of labor. A detailed breakdown of the time spent on labor can be found in Table 3 and Figure 4.
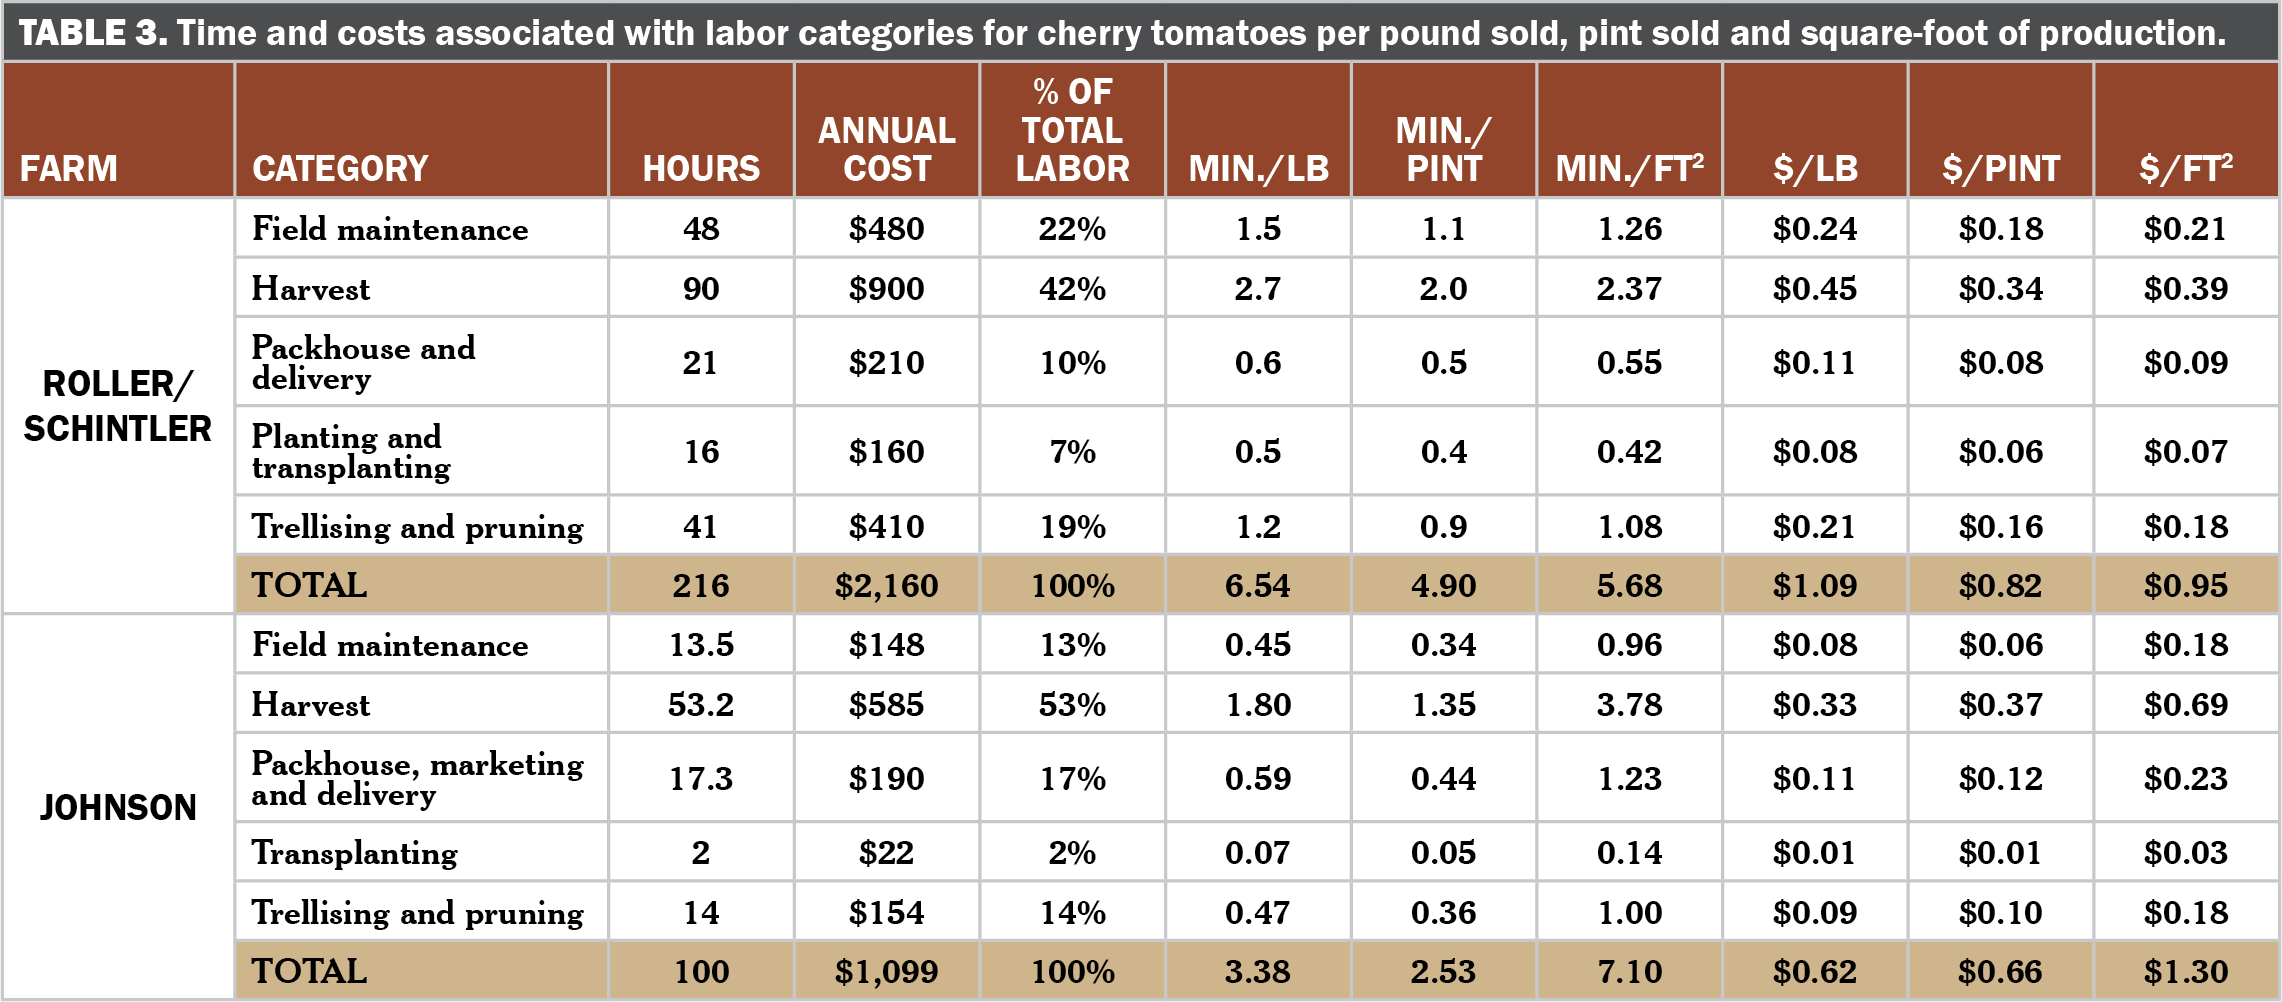
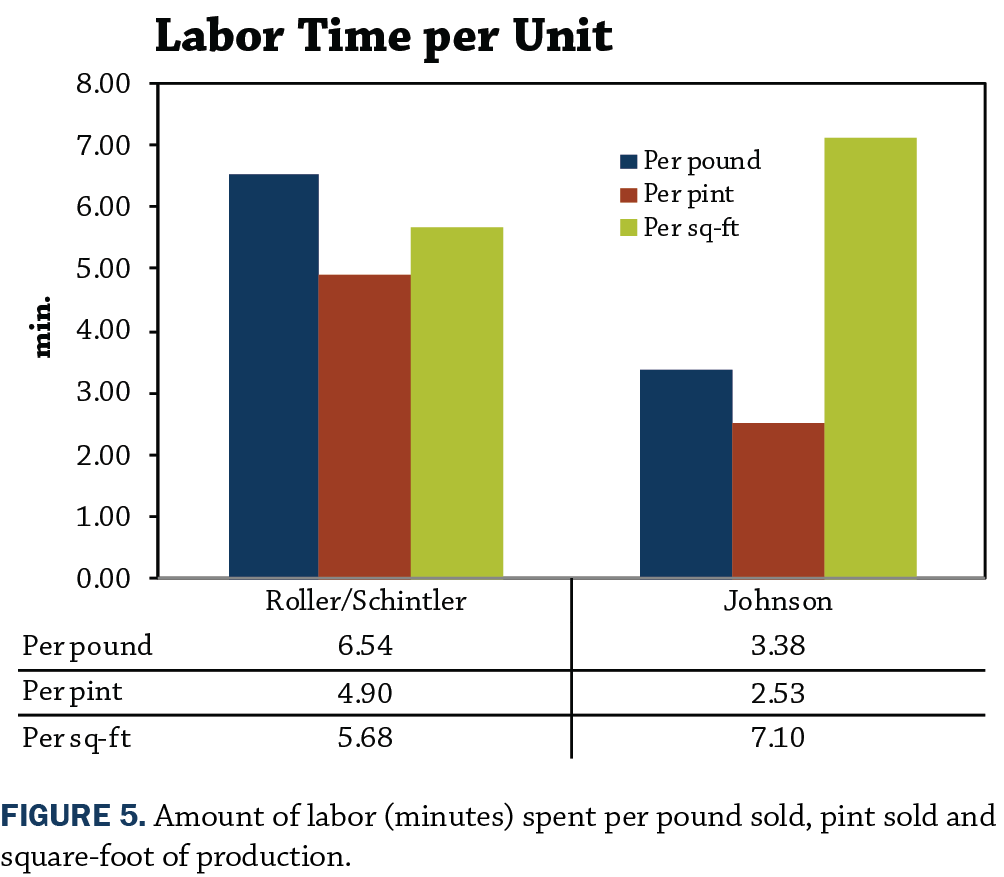
The Johnsons, with less area planted but higher yields (in part due to larger-fruited varieties), used less total labor-time per pint (2.53 min./pint) and per pound (3.38 min./lb) than did Roller/Schintler (4.90 min./pint and 6.54 min./lb) as shown in Figure 5. Per pint, the Johnsons were nearly twice as efficient with labor. To achieve these high yields, the Johnsons did use more labor per square-foot.
When farmers think about how to measure their efficiency, they need to consider labor, money, and high-value growing space like high tunnels.
Conclusions and Next Steps
Cherry tomatoes were a profitable crop at both farms, netting $1.79/lb at the Johnsons’ and $2.42/lb at Roller/Schintler’s. Labor was the highest expense for cherry tomatoes at both farms, and most of the labor (in time and cost) was spent on harvesting. The Johnsons had more efficient harvest (less labor per pound and per pint) and high yields, which earned them higher profits per square-foot. Both farms were pleased with the numbers in their enterprise budgets. Said Derek Roller, “This data supports what we felt – that Sungolds were good money for us.”
From 2017 to 2018, the Johnsons made a few changes to their cherry tomato production., Particularly, the removal of the straw from their high tunnel and custom-grown transplants from Stillwater Greenhouse were successful for them. Said Emma Johnson: “We had in the past used the straw to reduce compaction from foot traffic but also to retain moisture. We suspected the straw also kept the soil temperature too cool in May and early June.” About the transplants, Emma Johnson said, “We are going to continue to have our plants custom grown because we felt we saw some yield benefits, it is cheaper for us and we don’t have to heat our greenhouse in February. I am sure Stillwater did a much better job of making sure the plants had supplemental light and heat during the grey cool days of winter when we are normally distracted with pruning apple trees.”
The opportunity to discuss the results between the farms also gave each farm nuanced insight into different pricing strategies, production, and marketing goals. Both farms plan to increase their cherry tomato production for 2019.
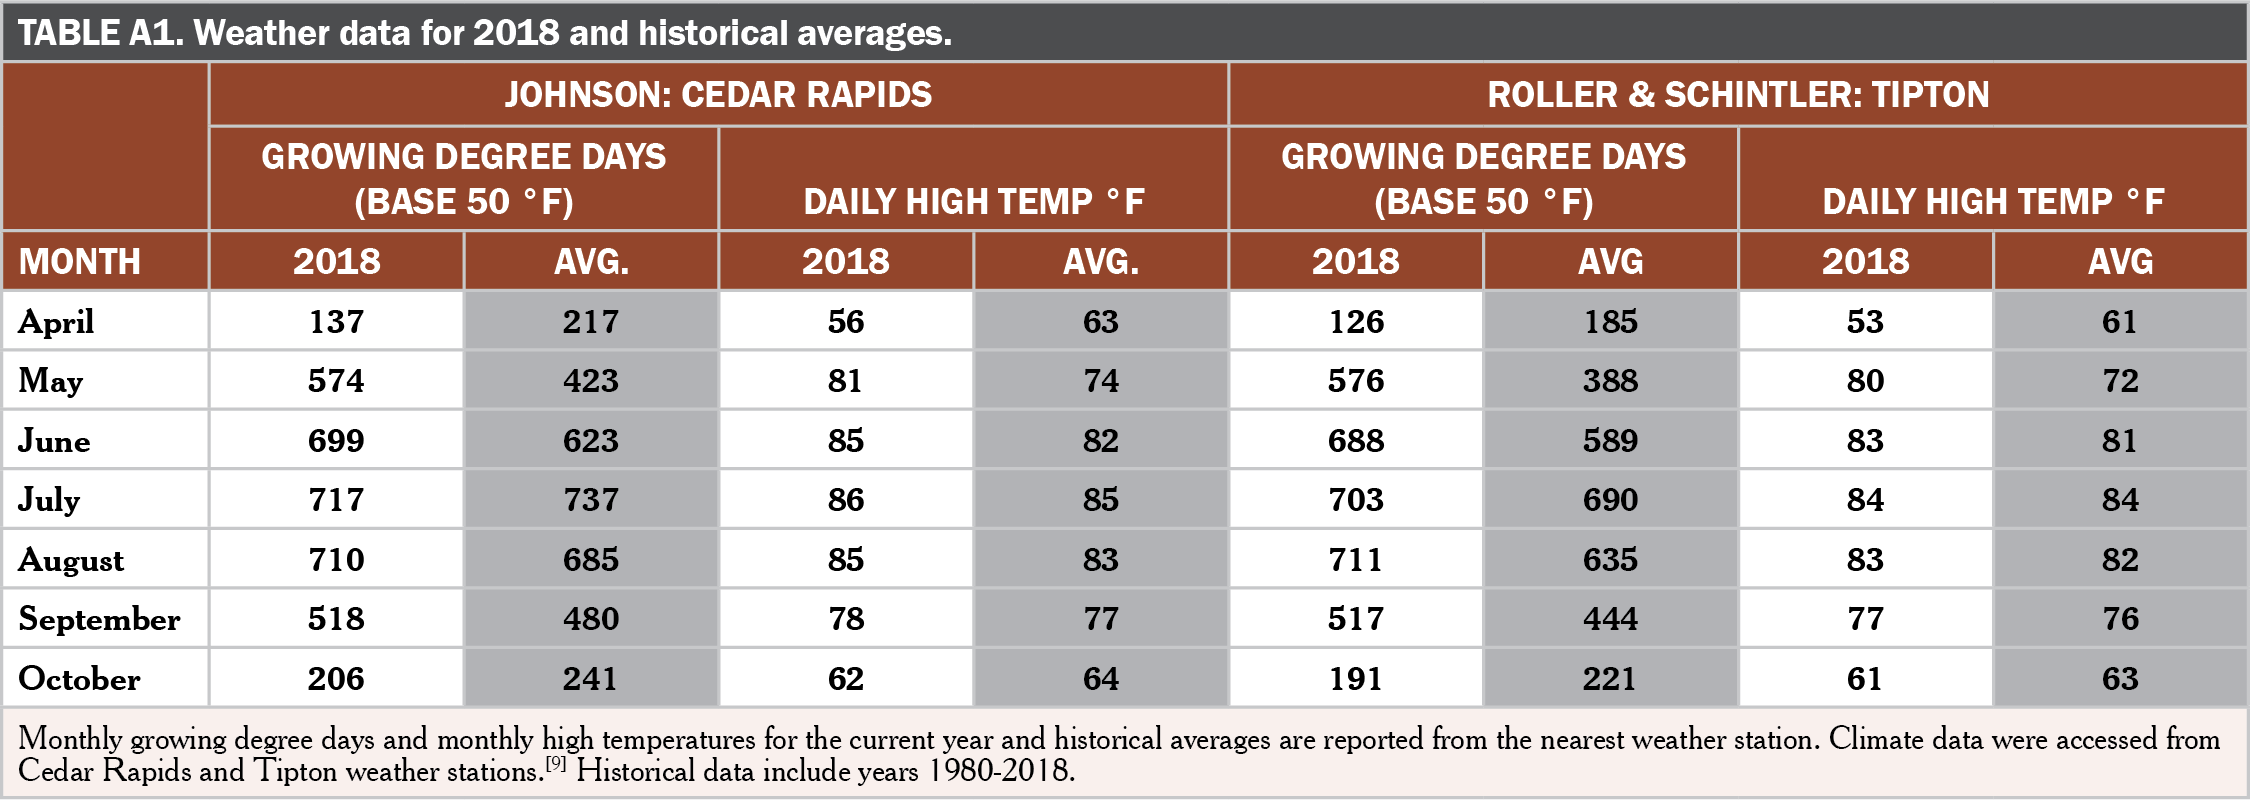
Appendix – Weather Conditions
References
- Kolbe, L., A. Franzenburg and E. Johnson. 2017. Enterprise Budget for Cherry Tomatoes. Practical Farmers of Iowa Cooperators’ Program. https://practicalfarmers.org/wp-content/uploads/2018/11/17.H.Enterprise_Budget_Cherry_Tomatoes.pdf (accessed April 2019).
- Chase, C. and L. Naeve. 2012. Vegetable Production Budgets for a High Tunnel. https://store.extension.iastate.edu/product/Vegetable-Production-Budgets-for-a-High-Tunnel(accessed April 2019).
- Worley, S. and J. Beebout. 2011. Blue Gate Farms High Tunnels: Take 3. Practical Farmers of Iowa Cooperators’ Program. https://practicalfarmers.org/research/ (accessed April 2019).
- Worley, S. and J. Beebout. 2012. Blue Gate high tunnels recording keeping project: Winter, Season 3. Practical Farmers of Iowa Cooperators’ Program. https://practicalfarmers.org/research/ (accessed April 2019).
- Kolbe, L., E. Johnson and J. Libbey. 2015. Enterprise Budget for Cucumbers. http://practicalfarmers.org/farmer-knowledge/research-reports/2015/enterprise-budget-for-cucumbers/ (accessed April 2019).
- Kolbe, L., E. Johnson and J. Libbey. 2016. Enterprise Budget for Cucumbers, Year 2. https://practicalfarmers.org/research/enterprise-budget-for-cucumbers-year-2/ (accessed April 2019).
- Kolbe, L., L. Matteson and R. Schick. 2019. Strawberry Establishment and Production Enterprise Budget. Practical Farmers of Iowa Cooperators’ Program. https://practicalfarmers.org/research/strawberry-establishment-and-production-enterprise-budget (accessed April 2019).
- Chase, C. 2012. Selected Alternative Agricultural Financial Benchmarks. https://www.extension.iastate.edu/agdm/wholefarm/html/c3-65.html (accessed April 2019).
- Iowa Environmental Mesonet. 2019. Iowa Environmental Mesonet. Iowa State University Department of Agronomy. http://mesonet.agron.iastate.edu/ (accessed March 2019).