In a Nutshell:
- Variety selection is a key component of growing high quality oats, but information about which varieties are best suited to perform in a particular site is often lacking due to the limited scope of variety trial locations.
- This was the second year cooperators compared the performance of their traditional oat variety with a variety predicted to do well from a genotype-by-environment model.
Key Findings:
- Across all five farms, the traditional oat variety either outperformed or equaled the model-selected variety in both yield and test weight.
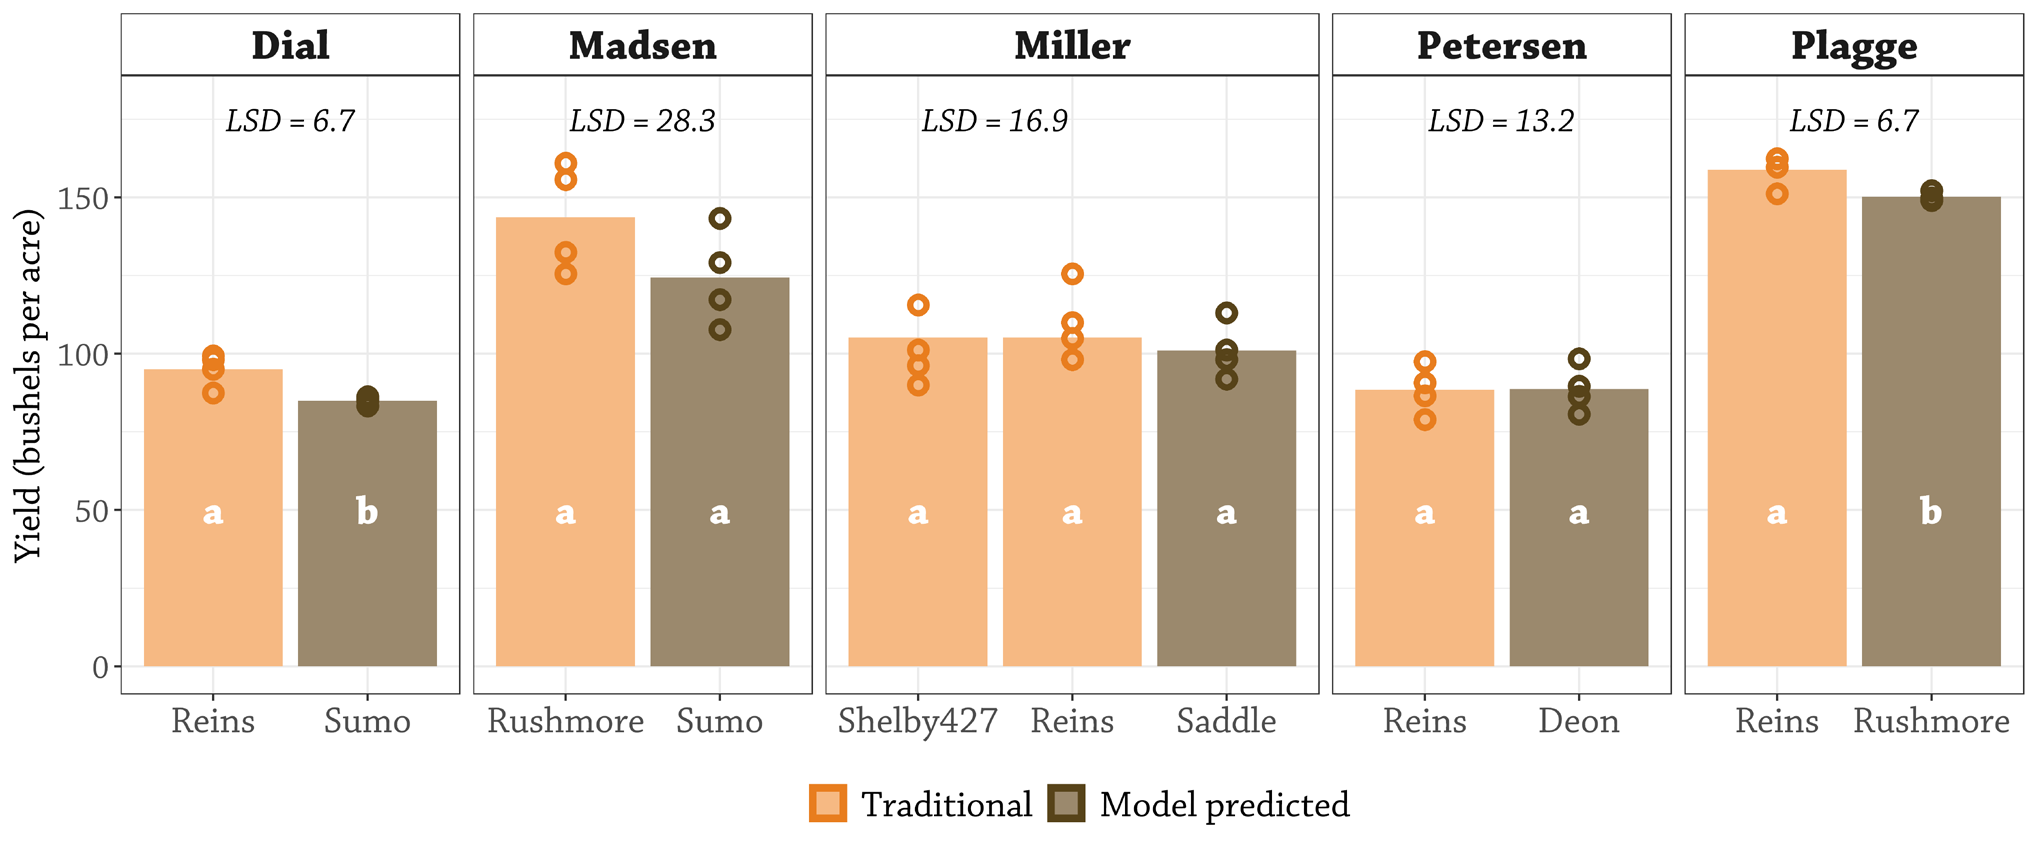
- At two farms, Dial and Plagge, the traditional oat variety (Reins in both cases) had a higher yield than the model-selected variety, while at the other three farms there was no difference in yield.
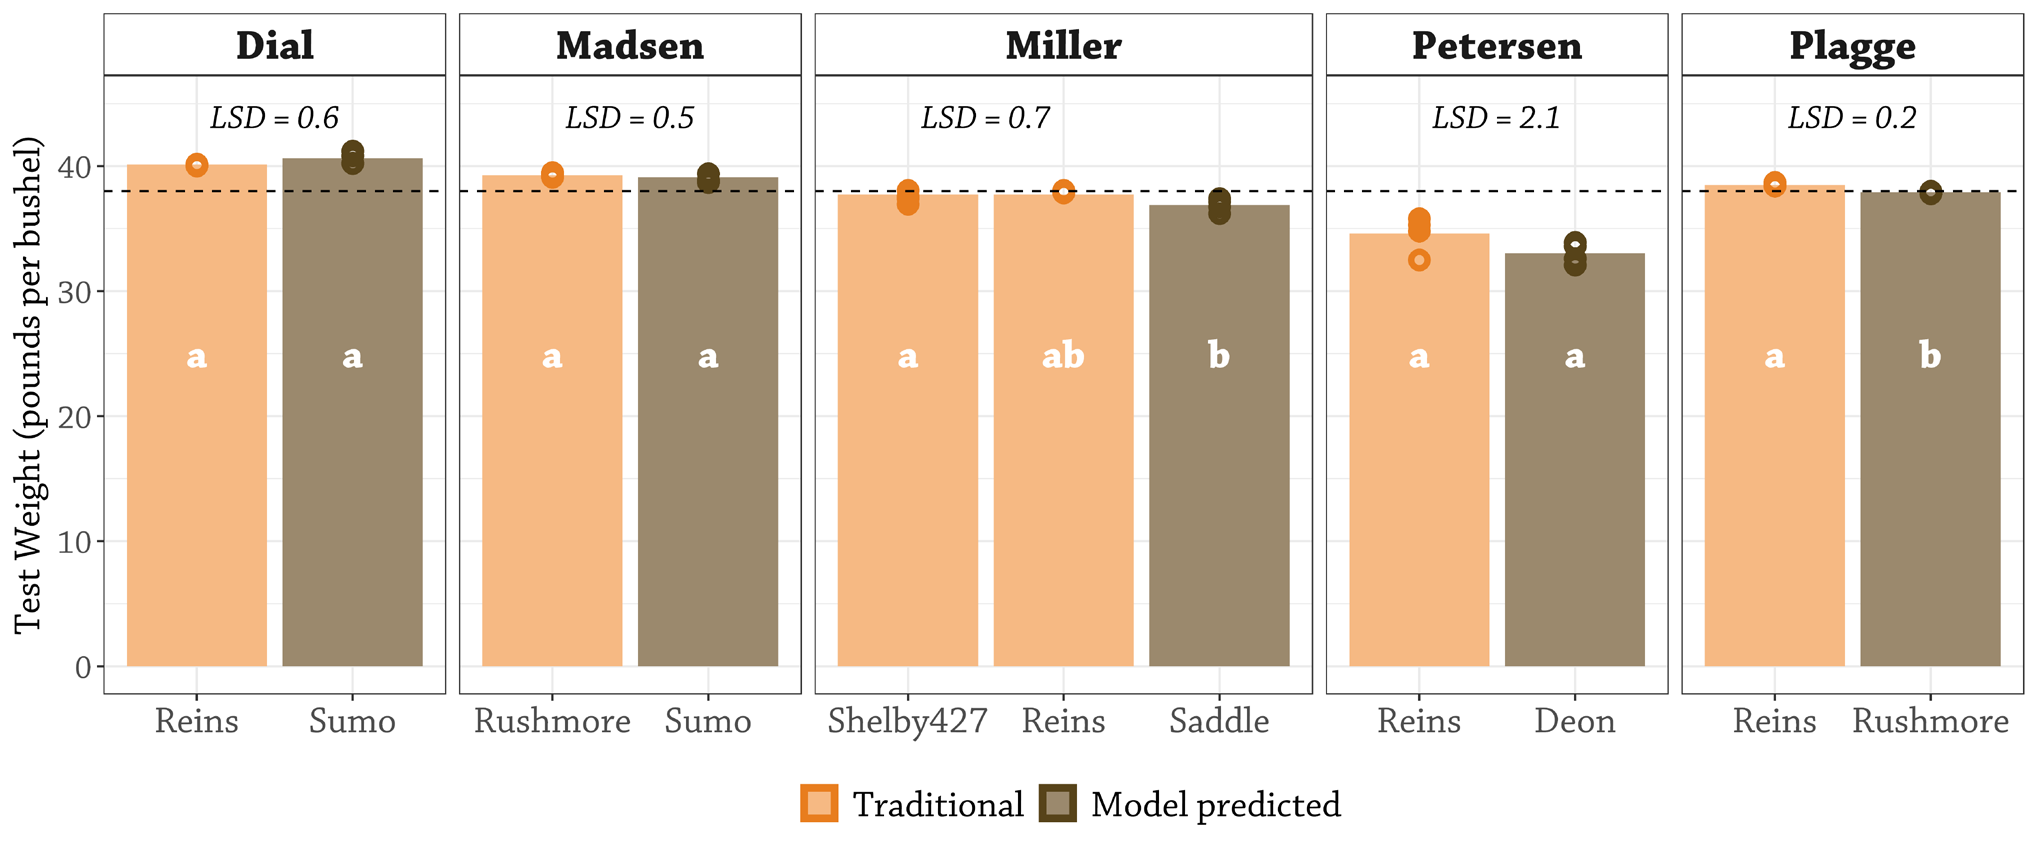
- At two farms, Miller and Plagge, the traditional oat variety, had a higher test weight than the model-selected variety, while at the other three farms there was no difference in test weight.
- Four of the five farms chose Reins as their traditional variety.
- Coming up with models that can reliably estimate variety performance across farm locations is challenging and requires a combination of historical data, predictions and on-the-ground calibration. These results indicate that our current models predicting oat variety selection can continue to be refined.
Background
Variety selection is an important consideration for growing high quality oats. Oats are bred for numerous traits including disease resistance, maturity, height, yield and lodging. Oats are grown for various end uses, including food grade milling, cover crop seed, livestock feed (either as grain, hay, or oatlage), straw bedding or as a nurse crop for alfalfa. Matching the variety characteristics with the end market is an important step for successful production. For instance, farmers looking to sell oats into a food-grade market should select a variety that has high test weight, because the grain must reach a certain heft to avoid dockage.
Methods
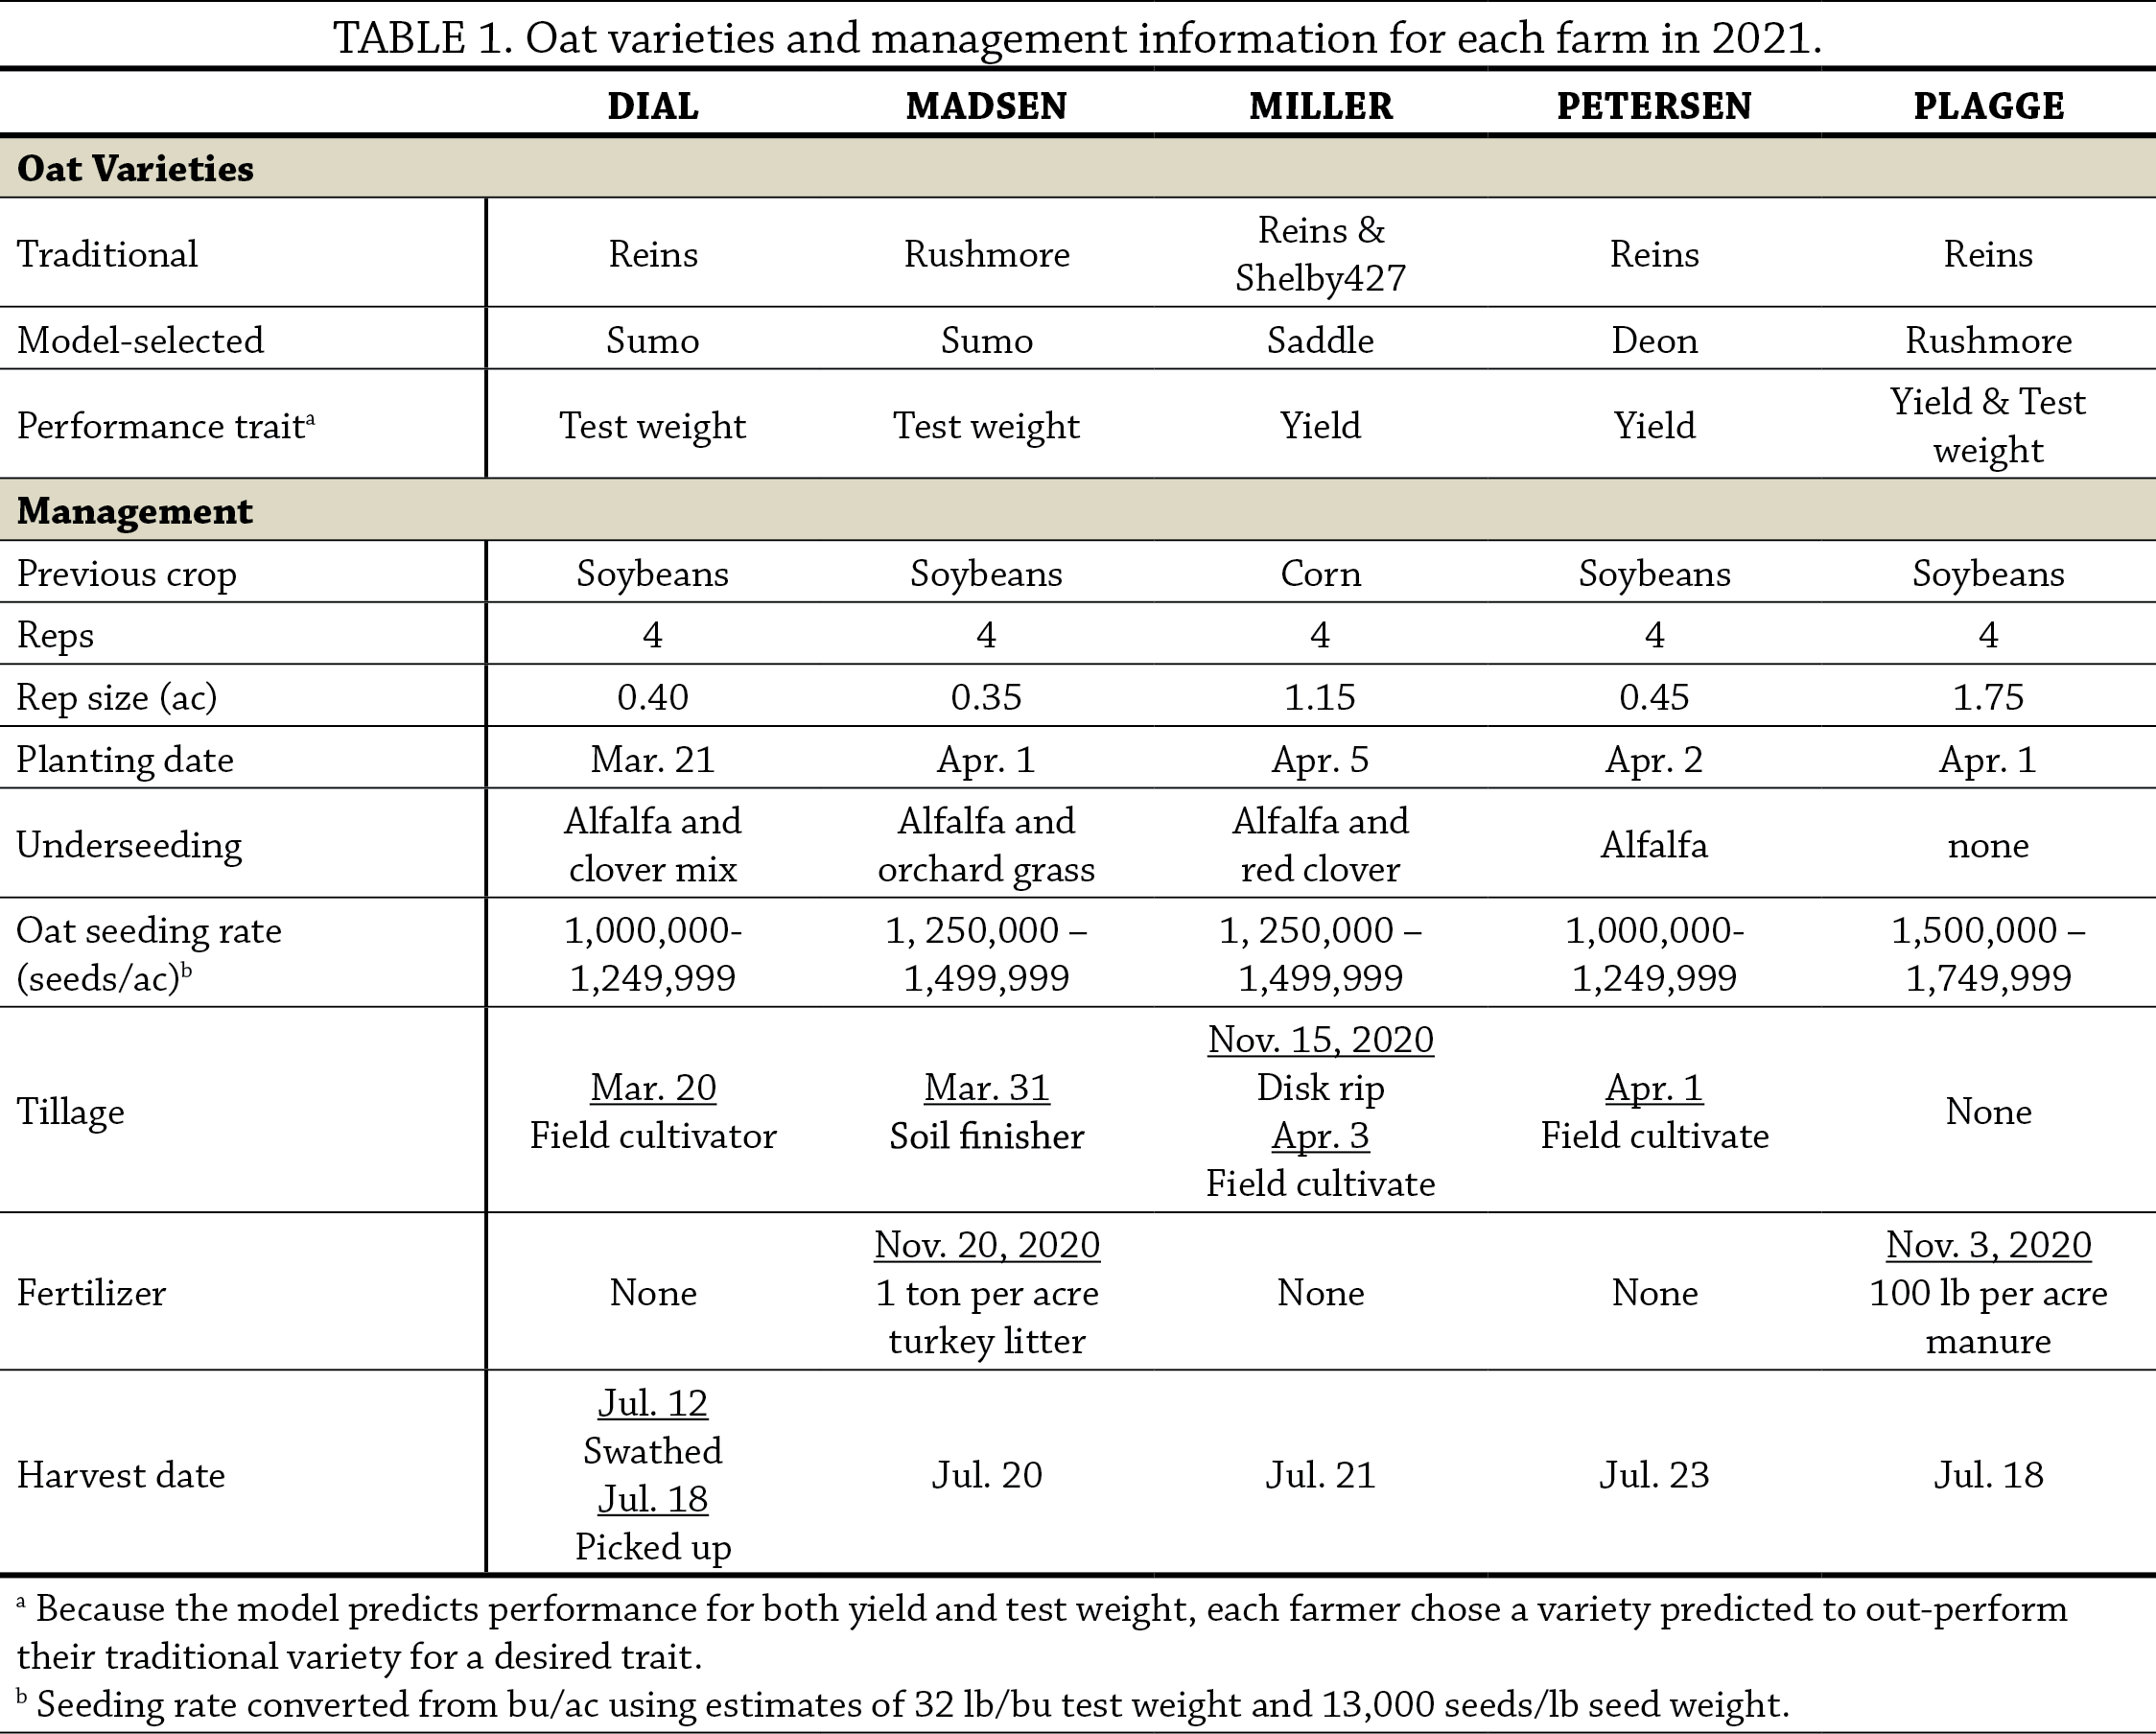
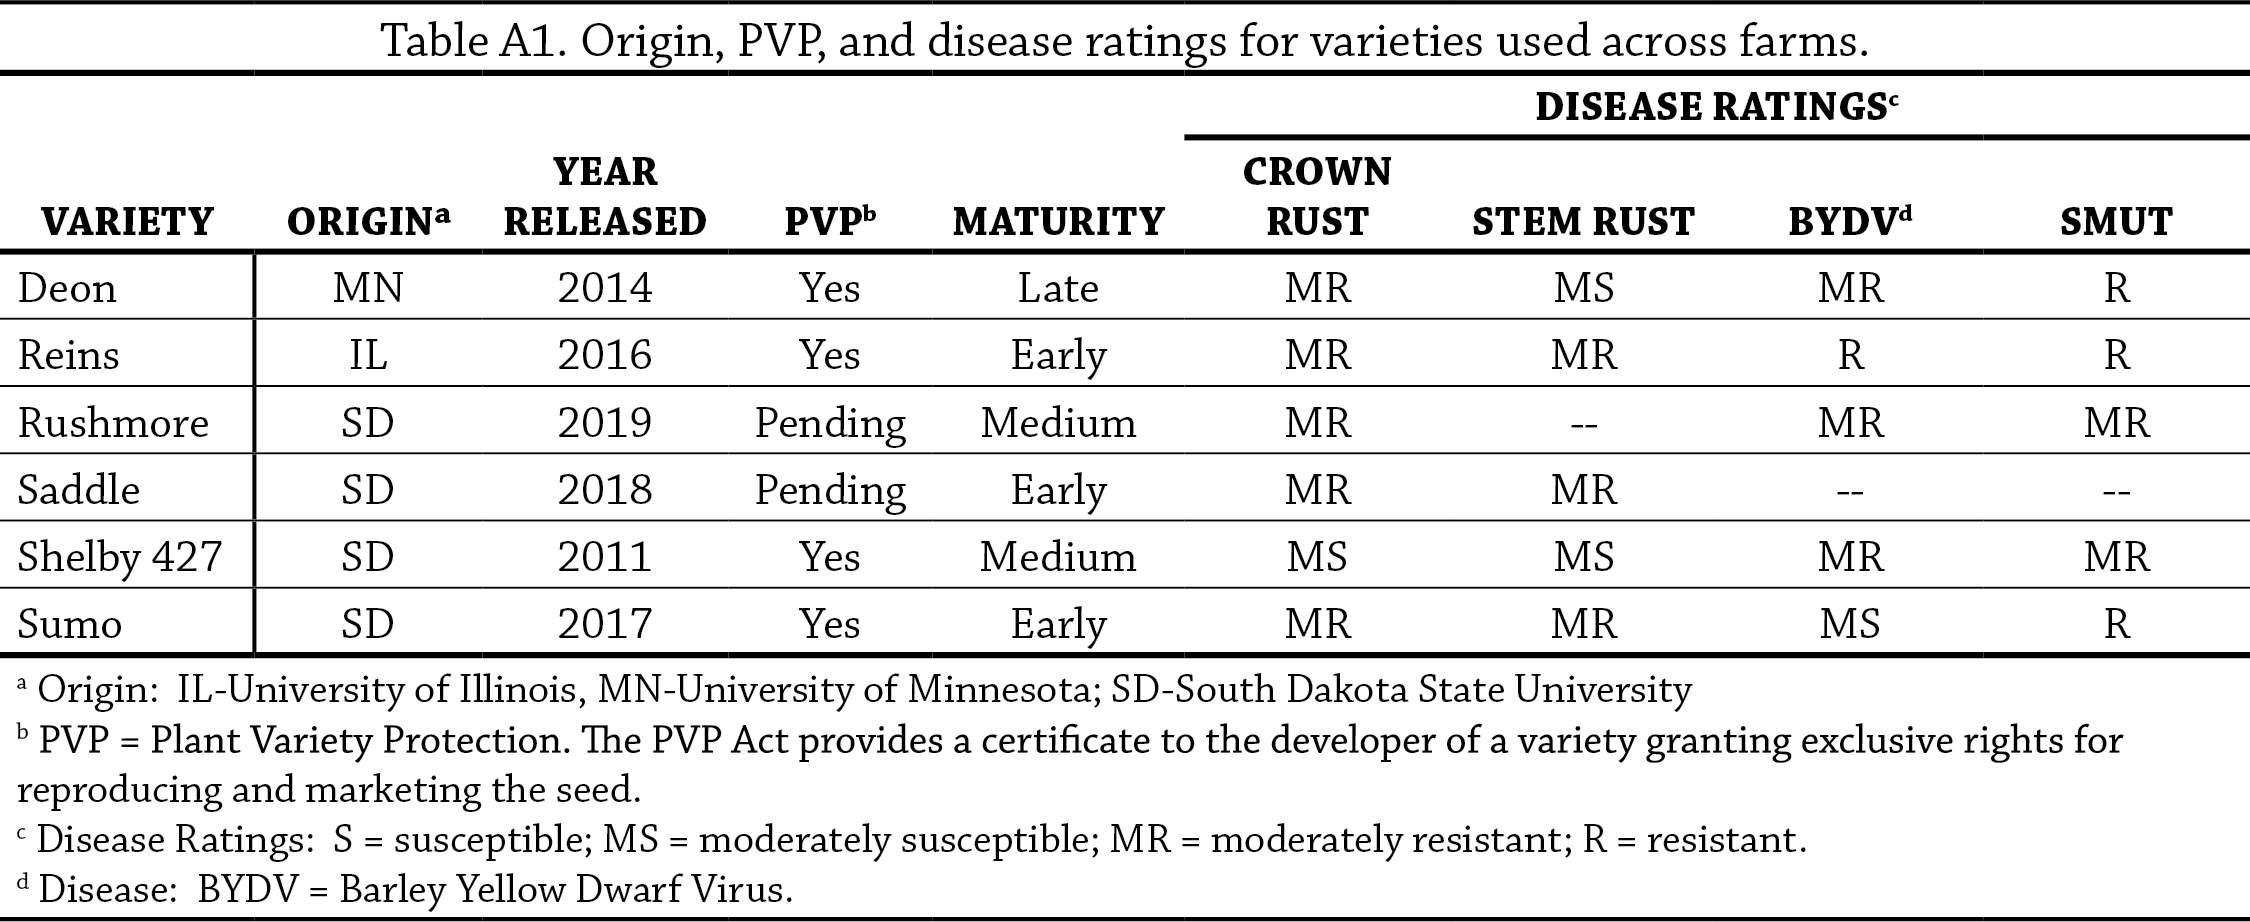
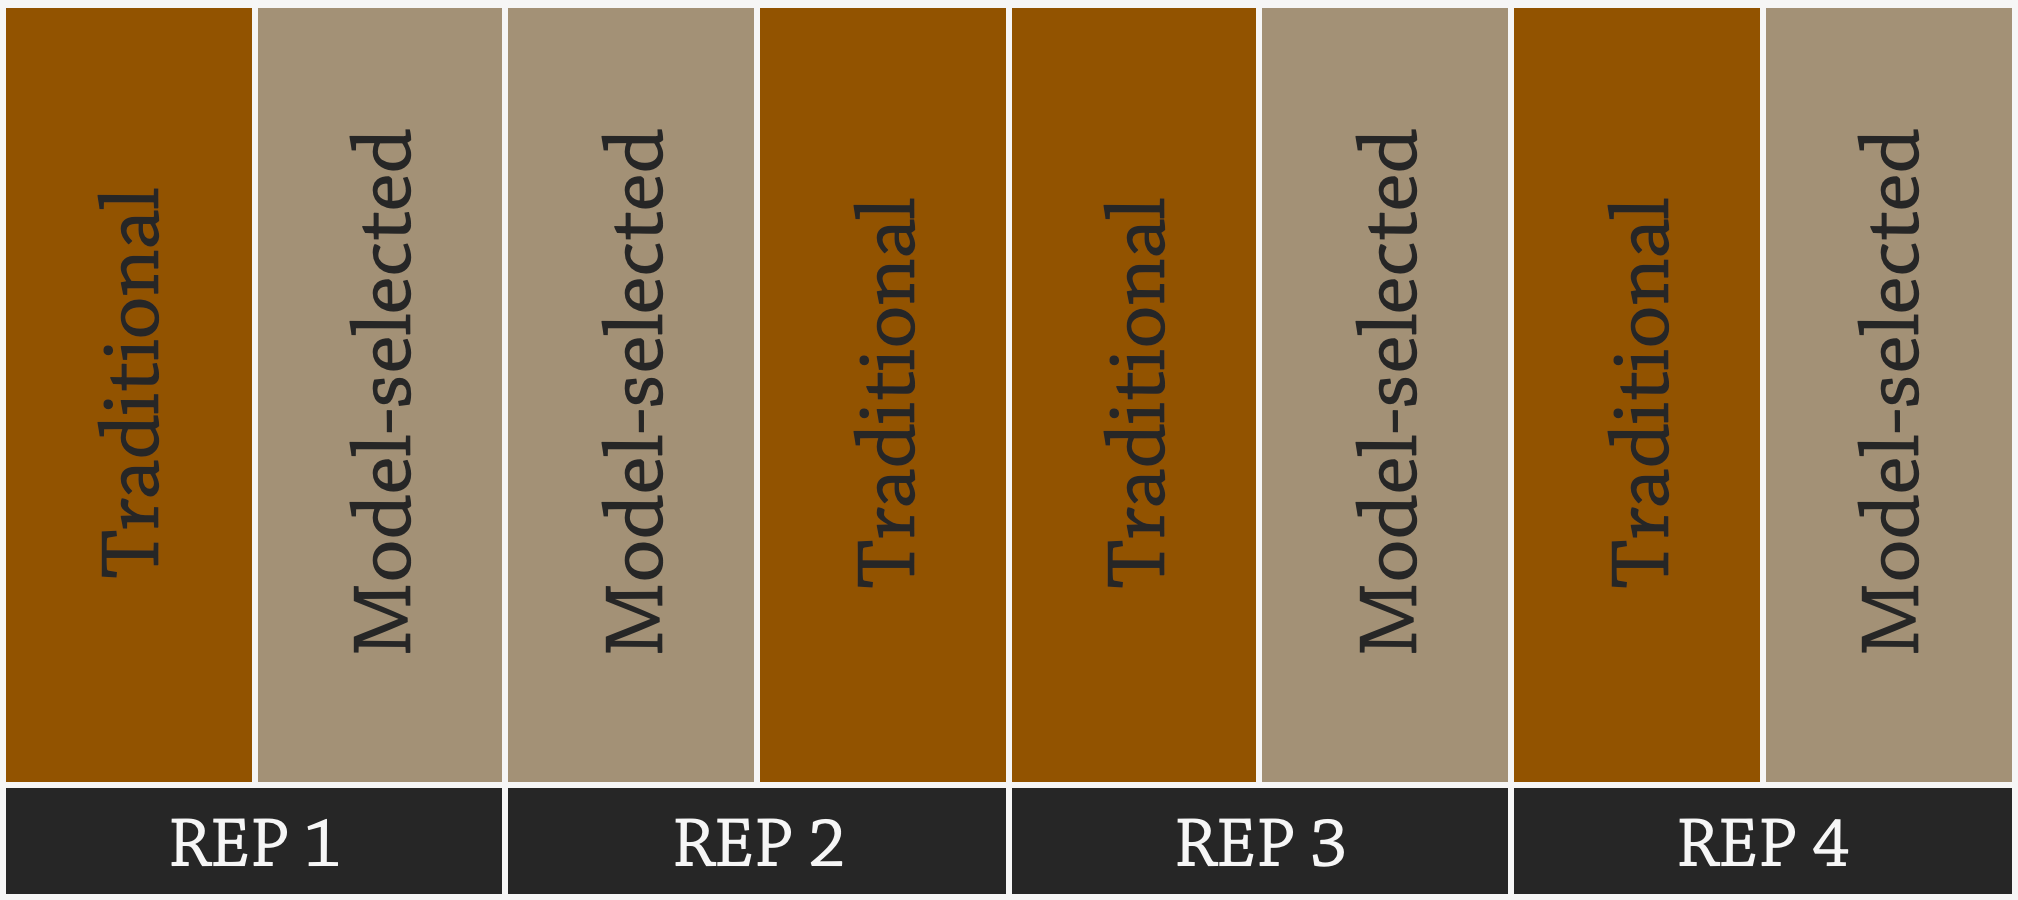
In 2021, the genotype-by-environment models predicted performance of varieties based on both yield and test weight. All farmers selected from the models a variety that was predicted to outperform their traditional variety for yield, test weight or both (Table 1). Each farm compared two varieties except for Miller, who compared three varieties – two traditional and one model-selected. All farms planted their traditional variety(s) alongside a model-selected variety in randomized replicated strip trials (Figure A1). Information about each variety used in these trials can be found in the Appendix (Table A1). The oat production practices for each farm can be found in Table 1.
Weight and moisture of each strip replicate were collected by the farmer at each site and samples of grain from each strip replicate were mailed to the University of Wisconsin-Madison where they were analyzed for test weight.
Data analysis
Data were analyzed in R version 4.0.2.[9] An ANOVA comparing varieties was run for each farm, for both yield and test weight. Means separations are reported using Tukey’s Least Significant Difference (LSD) determined at the 95% confidence level.
Results and Discussion
Yield
Yields ranged from 70 to 162 bu/ac across sites (Figure 1). Madsen and Plagge had the highest yields overall, but they were the only sites that applied any fertilizer to their oats (Table 1). Two farms, Dial and Plagge, saw statistically significant differences in yields between varieties, and in both cases the traditional variety, Reins, outperformed the model-selected variety. Rushmore, the traditional variety, appeared to out-yield Sumo at Madsen’s farm, but variation across replicates meant that this relationship was not statistically significant and therefore could not be confidently predicted to occur again. Neither Miller or Petersen, whose model-selected varieties were predicted to out-yield the traditional varieties, saw any statistical differences in yields (Figure 1).
Conclusions and Next Steps
Once again, these results underscore the need to ground-truth models as they are deployed, given that none of the model selected varieties significantly outperformed the traditional varieties for either yield or test weight. In 2021, four of the five farmers grew Reins as their traditional variety and overall it performed well compared to the other four varieties tested, underscoring farmer’s choice to continue to use it. These on-farm trials provide valuable information that will refine efforts to leverage small grain variety information into models that can assist farmers in decision making.
Appendix - Trial Design and Weather Conditions
References
- Gailans, S., S. Carlson, M. Schnabel K. Pecinovsky, and W. Koehler. 2019. Oat Variety Trials 2019. Practical Farmers of Iowa Cooperators’ Program https://practicalfarmers.org/research/oat-variety-trial-2019/ (accessed November 2021)
- Gailans, S., L. English, M. Schnabel, K. Pecinovsky. 2020. Oat Variety Trial 2020. Practical Farmers of Iowa Cooperators’ Program https://practicalfarmers.org/research/oat-variety-trial-2020/ (accessed November 2021)
- Gailans, S., L. English, M. Schnabel, K. Pecinovsky. 2021. Oat Variety Trial 2021. Practical Farmers of Iowa Cooperators’ Program https://practicalfarmers.org/research/oat-variety-trial-2021/ (accessed November 2021)
- Gailans, S., S. Carlson, M. Schnabel, K. Pecinovsky and W. Johnson. 2018. Oat Variety Trial 2018. Practical Farmers of Iowa Cooperators’ Program. https://practicalfarmers.org/research/oat-variety-trial-2018/ (accessed November 2021)
- Gailans, S., S. Carlson, M. Schnabel, K. Pecinovsky, B. Lang, and W. Koehler. 2017. Oat variety and fungicide trials 2017. Practical Farmers of Iowa Cooperators’ Program. Ames, IA. https://practicalfarmers.org/research/oat-variety-and-fungicide-trials-2017/ (accessed Jan. 17, 2019). (accessed November 2021)
- Gailans, S., S. Carlson, M. Schnabel, K. Pecinovsky, B. Lang, and W. Johnson. 2016. Oat variety trials 2016. Practical Farmers of Iowa Cooperators’ Program. Ames, IA. https://practicalfarmers.org/farmer-knowledge/research-reports/2016/oat-variety-trials-2016/ (accessed November 2021)
- Gailans, S., S. Carlson, K. Pecinovsky and B. Lang. 2015. Oat variety and fungicide trials. Practical Farmers of Iowa Cooperators’ Program. Ames, IA. https://practicalfarmers.org/farmer-knowledge/research-reports/2015/oat-variety-and-fungicide-trials/ (accessed November 2021)
- English, L. D. Fehr, C. Ingels, R. Rosmann, T. Thompson, and S. Wedemeier. 2020. Oat Selector Tool Variety Trial. https://practicalfarmers.org/research/oat-selector-tool-variety-trial/ (accessed November 2021)
- R Core Team (2020). R: A language and environment for statistical computing. R Foundation for Statistical Computing, Vienna, Austria. URL https://www.R-project.org/