In a Nutshell:
- Variety selection is a key component of growing high quality oats, but information about which varieties are best suited to perform in a particular location is often lacking.
- Cooperators compared the performance of their traditional oat variety with a variety predicted to do well from a genotype-by-environment model.
Key Findings:
- At three of the five farms there was no difference in yield performance between the two oat varieties. At one farm (Ingels) the model-selected oat variety had a higher yield than the traditional variety, but at another farm (Fehr), the opposite occurred – the traditional variety outperformed the model-selected variety.
- At two of the five farms there was no difference in test weight between the traditional and model-selected oat varieties. At two farms (Fehr and Rosmann) the model-selected variety had a higher test weight than the traditional variety, whereas at another farm (Wedemeier) the traditional variety had a higher test weight.
- Coming up with models that can reliably estimate variety performance across farm locations is challenging and requires a combination of historical data, predictions and on-the-ground calibration. These results indicate that our current models predicting oat variety selection can continue to be refined.
Background
Variety selection is an important consideration for growing high quality oats. Oats are bred for numerous traits including disease resistance, maturity, height, yield and lodging. Oats are grown for various end uses, including food grade milling, cover crop seed, livestock feed (either as grain, hay, or oatlage), straw bedding or as a nurse crop for alfalfa. Matching the variety characteristics with the end market is an important step for successful production. For instance, farmers looking to grow oats for livestock feed may be interested in selecting oats that have the highest yield possible, whereas farmers looking to sell oats into a food-grade market should select a variety that has high test weight, because the grain must reach a certain heft to avoid dockage.
To examine oat variety performance across Iowa, PFI has conducted variety trials every year since 2015. Occasionally one variety will perform the best, in terms of yield, across all trial locations.[1] But more commonly the top yielding variety differs across sites.[2-5] That fact that some varieties perform well in certain locations but not in other locations is called a genotype-by-environment interaction and it is commonplace in plant breeding, especially among small grains.
The best way to get reliable variety performance given genotype-by-environment interactions is to set up hyper-localized variety trials. Usually, however, that is not feasible. So instead, PFI, in conjunction with plant breeders, has been working since 2018 on developing models to predict small grain performance in localized environments. These genotype-by-environment models power a decision tool that takes into account existing small grains variety data and uses that information to predict performance of varieties based on a grower’s ZIP code.
While models can be extremely useful, they always benefit from calibration and refinement. To understand how effectively this variety selection model was at predicting oat performance, five cooperators conduced a trial comparing the oat variety they would typically use (“traditional” variety) alongside a variety predicted to perform well in the model (“model-selected” variety).
Methods
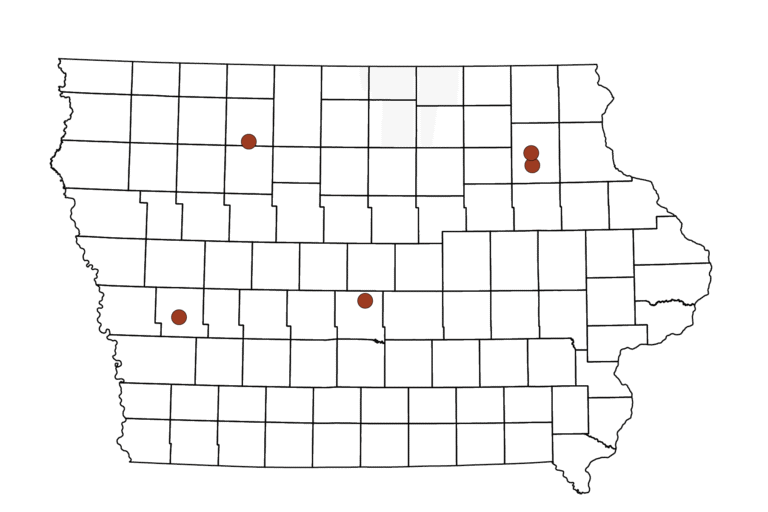
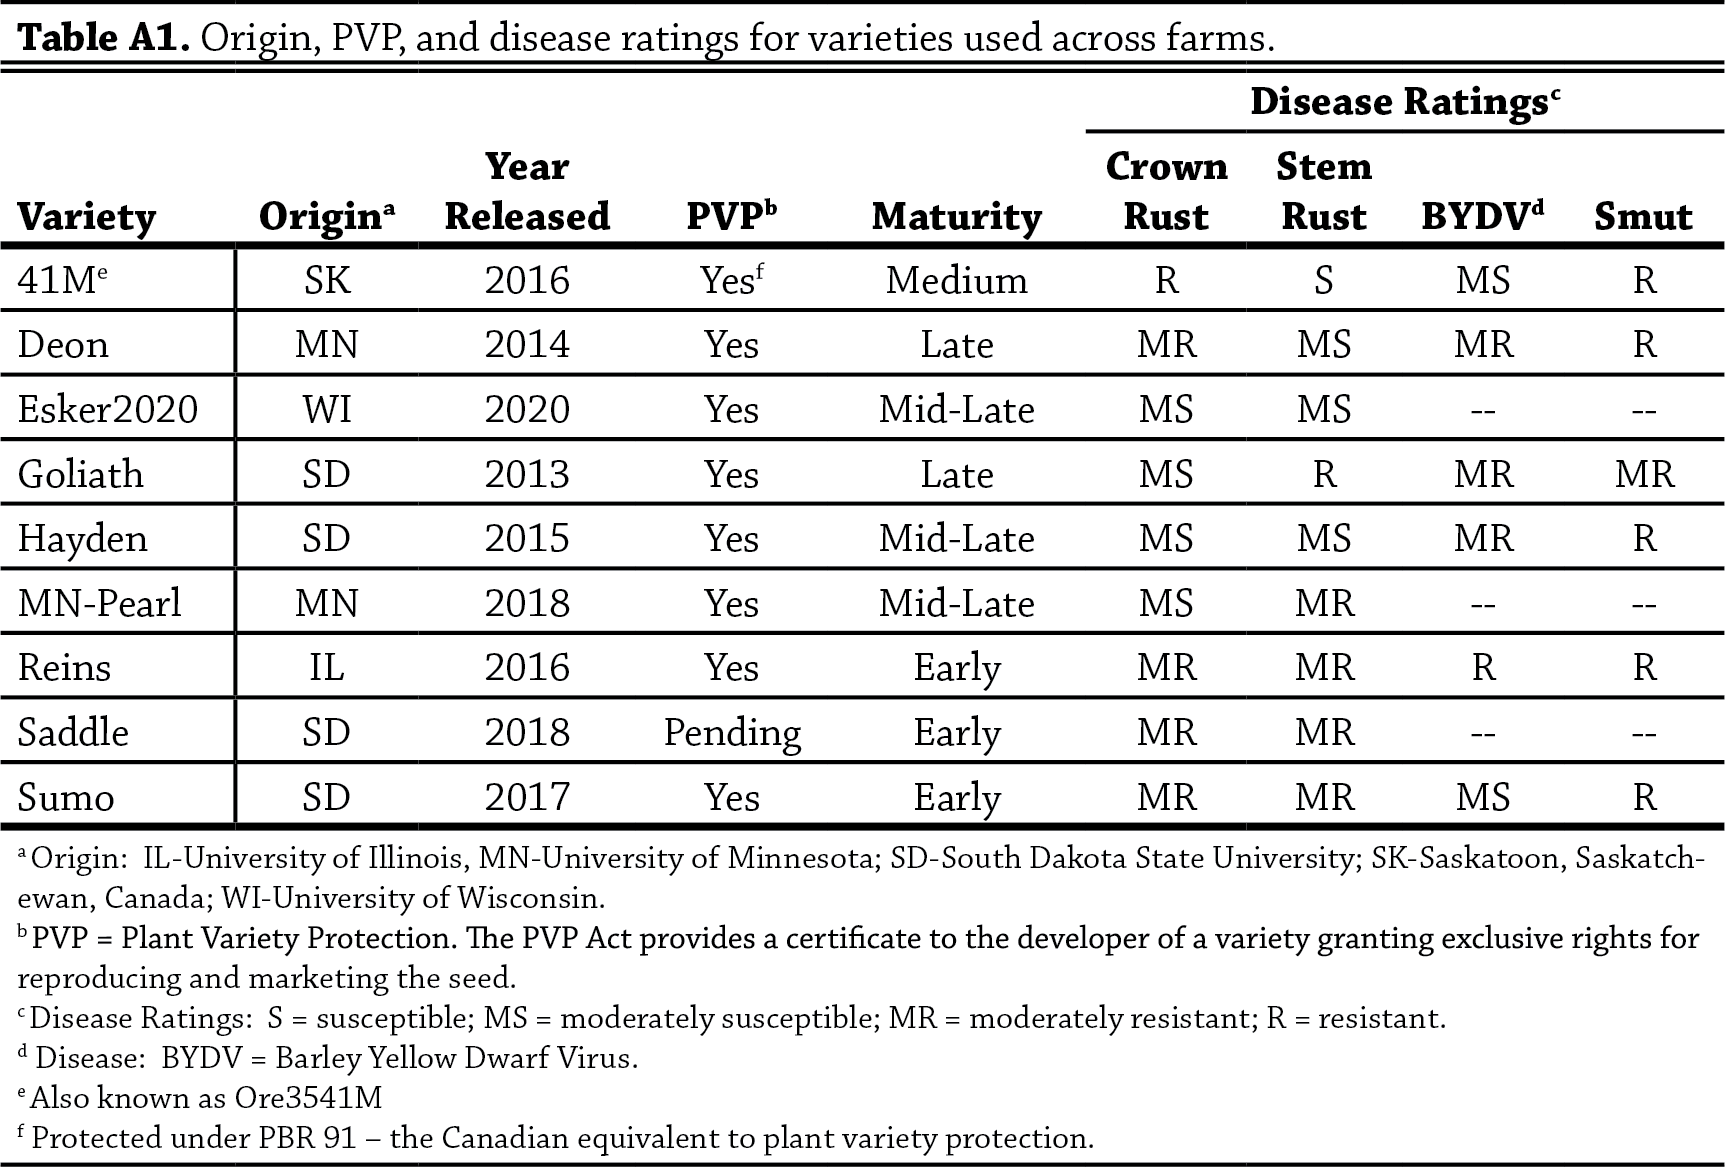
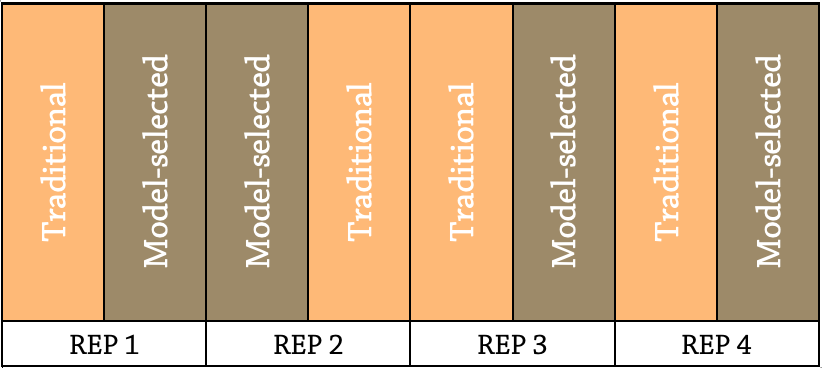
All farms planted their traditional variety alongside the model-selected variety in randomized replicated strip trials (Figure 1A). Information about each variety used in these trials can be found in the Appendix (Table A1). The varieties trialed at each farm as well as oat production practices can be found in Table 1.
Yields were collected by the farmer at each site and samples of grain from each strip replicate were mailed to the University of Wisconsin-Madison where they were analyzed for test weight.
 Data analysis
Data were analyzed in R version 4.0.2.[6] A two-way ANOVA with farm and variety type (traditional vs model-selected) was fit for our two response variables: yield and test weight. Means separations are reported using Tukey’s Least Significant Difference (LSD) determined at the 95% confidence level.
Data analysis
Data were analyzed in R version 4.0.2.[6] A two-way ANOVA with farm and variety type (traditional vs model-selected) was fit for our two response variables: yield and test weight. Means separations are reported using Tukey’s Least Significant Difference (LSD) determined at the 95% confidence level.
Results and Discussion
For both our response variables – yield and test weight – there was a significant interaction between our predictor variables – farm and variety source. This indicates that the direction of our response (whether the model-selected variety outperformed traditional variety) varied across sites.
YieldYields ranged from 42 to 137 bu/ac across sites (Figure 1). Thompson’s oats had the lowest yields, but they also were the only oats that did not receive any fertilizer (Table 1). At Fehr’s farm 41M (the traditional variety) had higher yield than Sumo (the model-selected variety). At Ingels’ farm Saddle (the model-selected variety) had higher yield than Goliath (the traditional variety). At Rosmann’s, Thompson’s, and Wedemeier’s farms there was no statistically significant differences between oat yields.

Test weight ranged from 34.6 to 46.6 lb/bu across farms (Figure 2). The majority of farms had both varieties meet the threshold for food grade milling – 38 lb/bu. Sumo oats (the model-selected variety) at Fehr’s farm had the highest test weight. At Fehr’s and Rosmann’s farms, Sumo and MN-Pearl, the model-selected varieties, had a higher test weight than the traditional varieties, 41M and Deon, respectively. At Wedemeier’s farm, Reins, the traditional variety, had a higher test weight than the model-selected variety, Hayden. At Ingels’ and Thompson’s farms there was no statistically significant difference between oat test weights.

Conclusion and Next Steps
The mixed results from these trials demonstrate that selecting a variety based on a model may not always result in higher yield or test weight. While models can be useful, they also need calibration to be accurate. These on-farm trials provide valuable information that will refine efforts to leverage small grain variety information into models that can assist farmers in decision making.
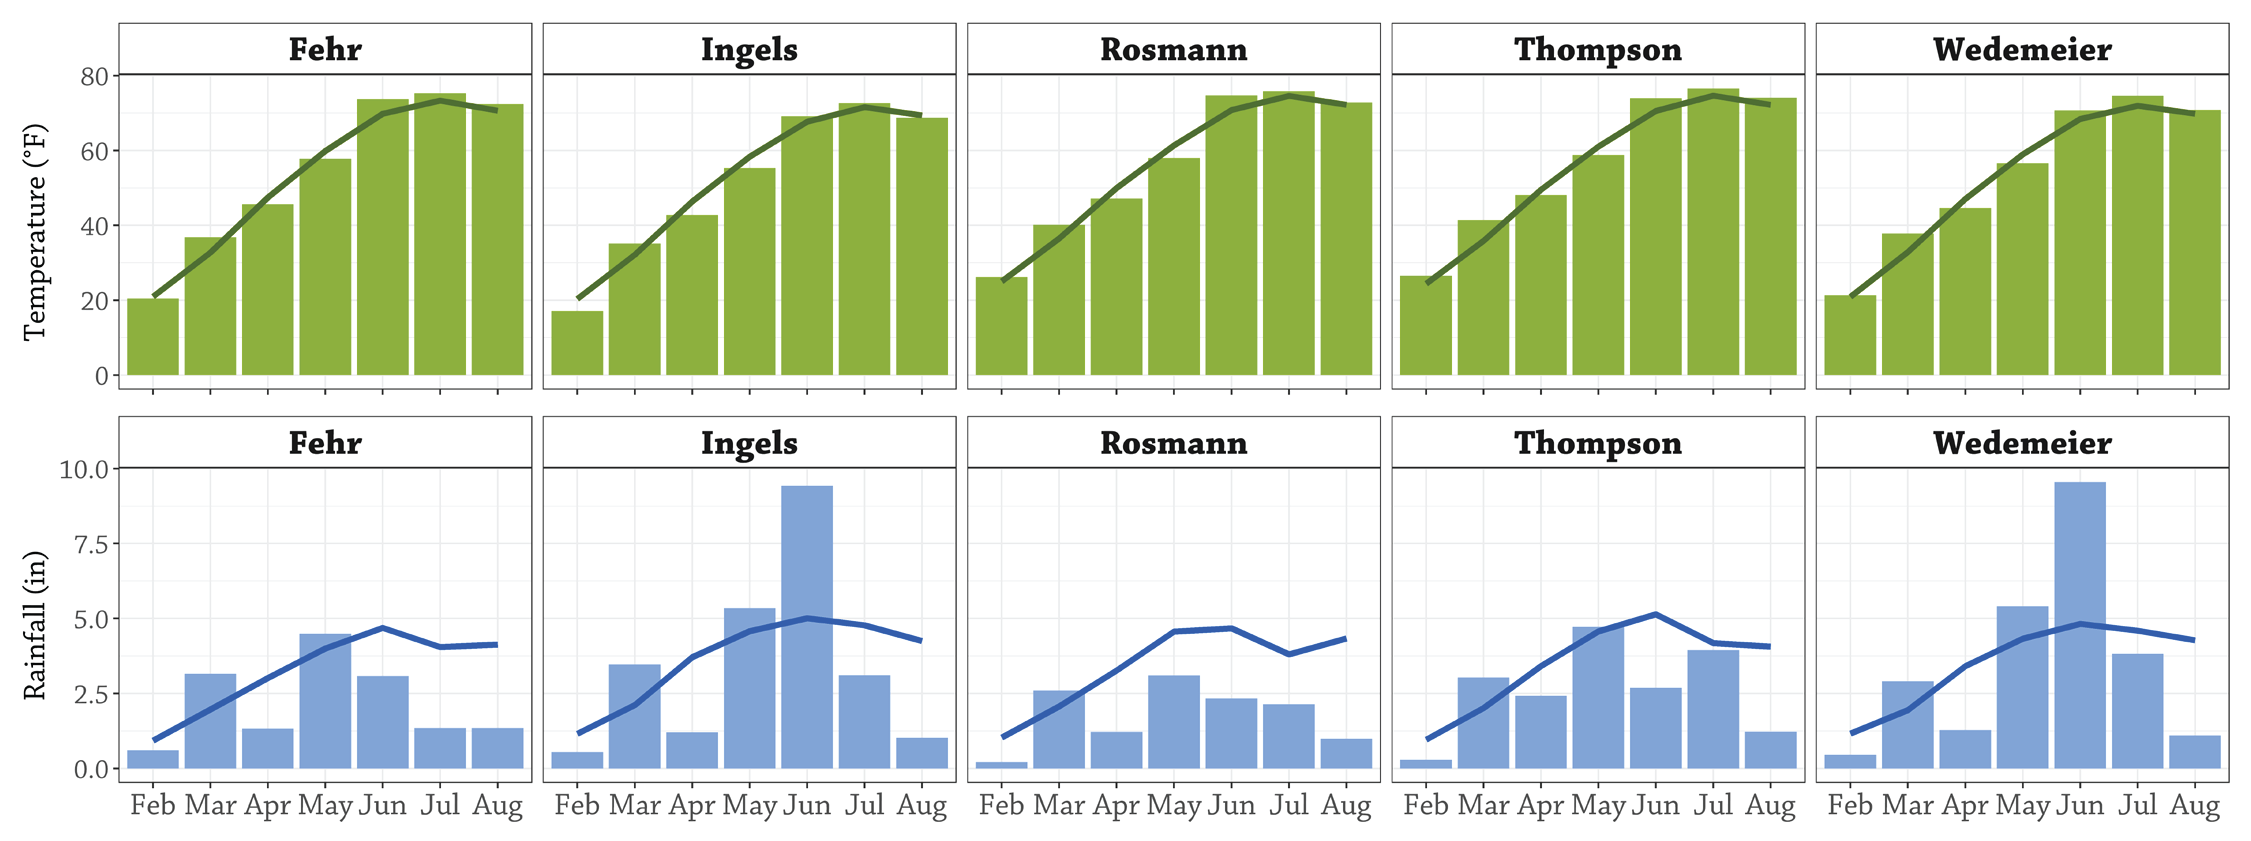
Appendix - Trial Design and Weather Conditions
References
- Gailans, S., S. Carlson, M. Schnable, K. Pecinosky, and W. Koehler. 2019. Oat Variety Trials 2019. Practical Farmers of Iowa Cooperators’ Program https://practicalfarmers.org/research/oat-variety-trial-2019/ (accessed November 2020)
-
Gailans, S., S. Carlson, M. Schnabel, K. Pecinovsky and W. Johnson. 2018. Oat Variety Trial 2018. Practical Farmers of Iowa Cooperators’ Program. https://practicalfarmers.org/research/oat-variety-trial-2018/ (accessed November 2020).
-
Edwards, E., Plastina, A., and M. Filbert. 2018. Economics of Cover Crops.Iowa State University Ag Decision Maker. https://www.extension.iastate.edu/agdm/crops/html/a1-91.html (accessed April 2020).
-
Gailans, S., S. Carlson, M. Schnabel, K. Pecinovsky, B. Lang, and W. Johnson. 2016. Oat variety trials 2016. Practical Farmers of Iowa Cooperators’ Program. Ames, IA. https://practicalfarmers.org/farmer-knowledge/research-reports/2016/oat-variety-trials-2016/ (accessed November 2020).
-
Gailans, S., S. Carlson, K. Pecinovsky and B. Lang. 2015. Oat variety and fungicide trials. Practical Farmers of Iowa Cooperators’ Program. Ames, IA. https://practicalfarmers.org/farmer-knowledge/research-reports/2015/oat-variety-and-fungicide-trials/ (accessed November 2020).
-
R Core Team (2020). R: A language and environment for statistical computing. R Foundation for Statistical Computing, Vienna, Austria. URL https://www.Rproject.org/.