
Giving Credit Where It’s Due to Small Grains in the Rotation
Systems as complex as crop rotations are difficult to reduce down and put into categories and classifications that we can grasp. One of the ways farmers have to break down a crop rotation in order to stay in business is by tracking income and expenses, making sure that every activity in that business is contributing to the bottom line. Often times, small grains don’t fare so well in this kind of analysis; sure they are low input crops, but they also generate less income per acre than their corn or soy counterparts.
Dr. David Hooker of the University of Guelph takes issue with this kind of simple accounting. “Having a small grain in our operation, we have to determine the profitability that crop has in itself but also what effect it has in the rotation,” Dave says, “This is very commonly overlooked in enterprise analysis for small grain cereals.” On our August shared learning call Dr. Hooker shared some of the results from his long-term cropping systems trials in Ontario and then built off of those findings to complete some accounting exercises for approximating the true value of a small grain in rotation.
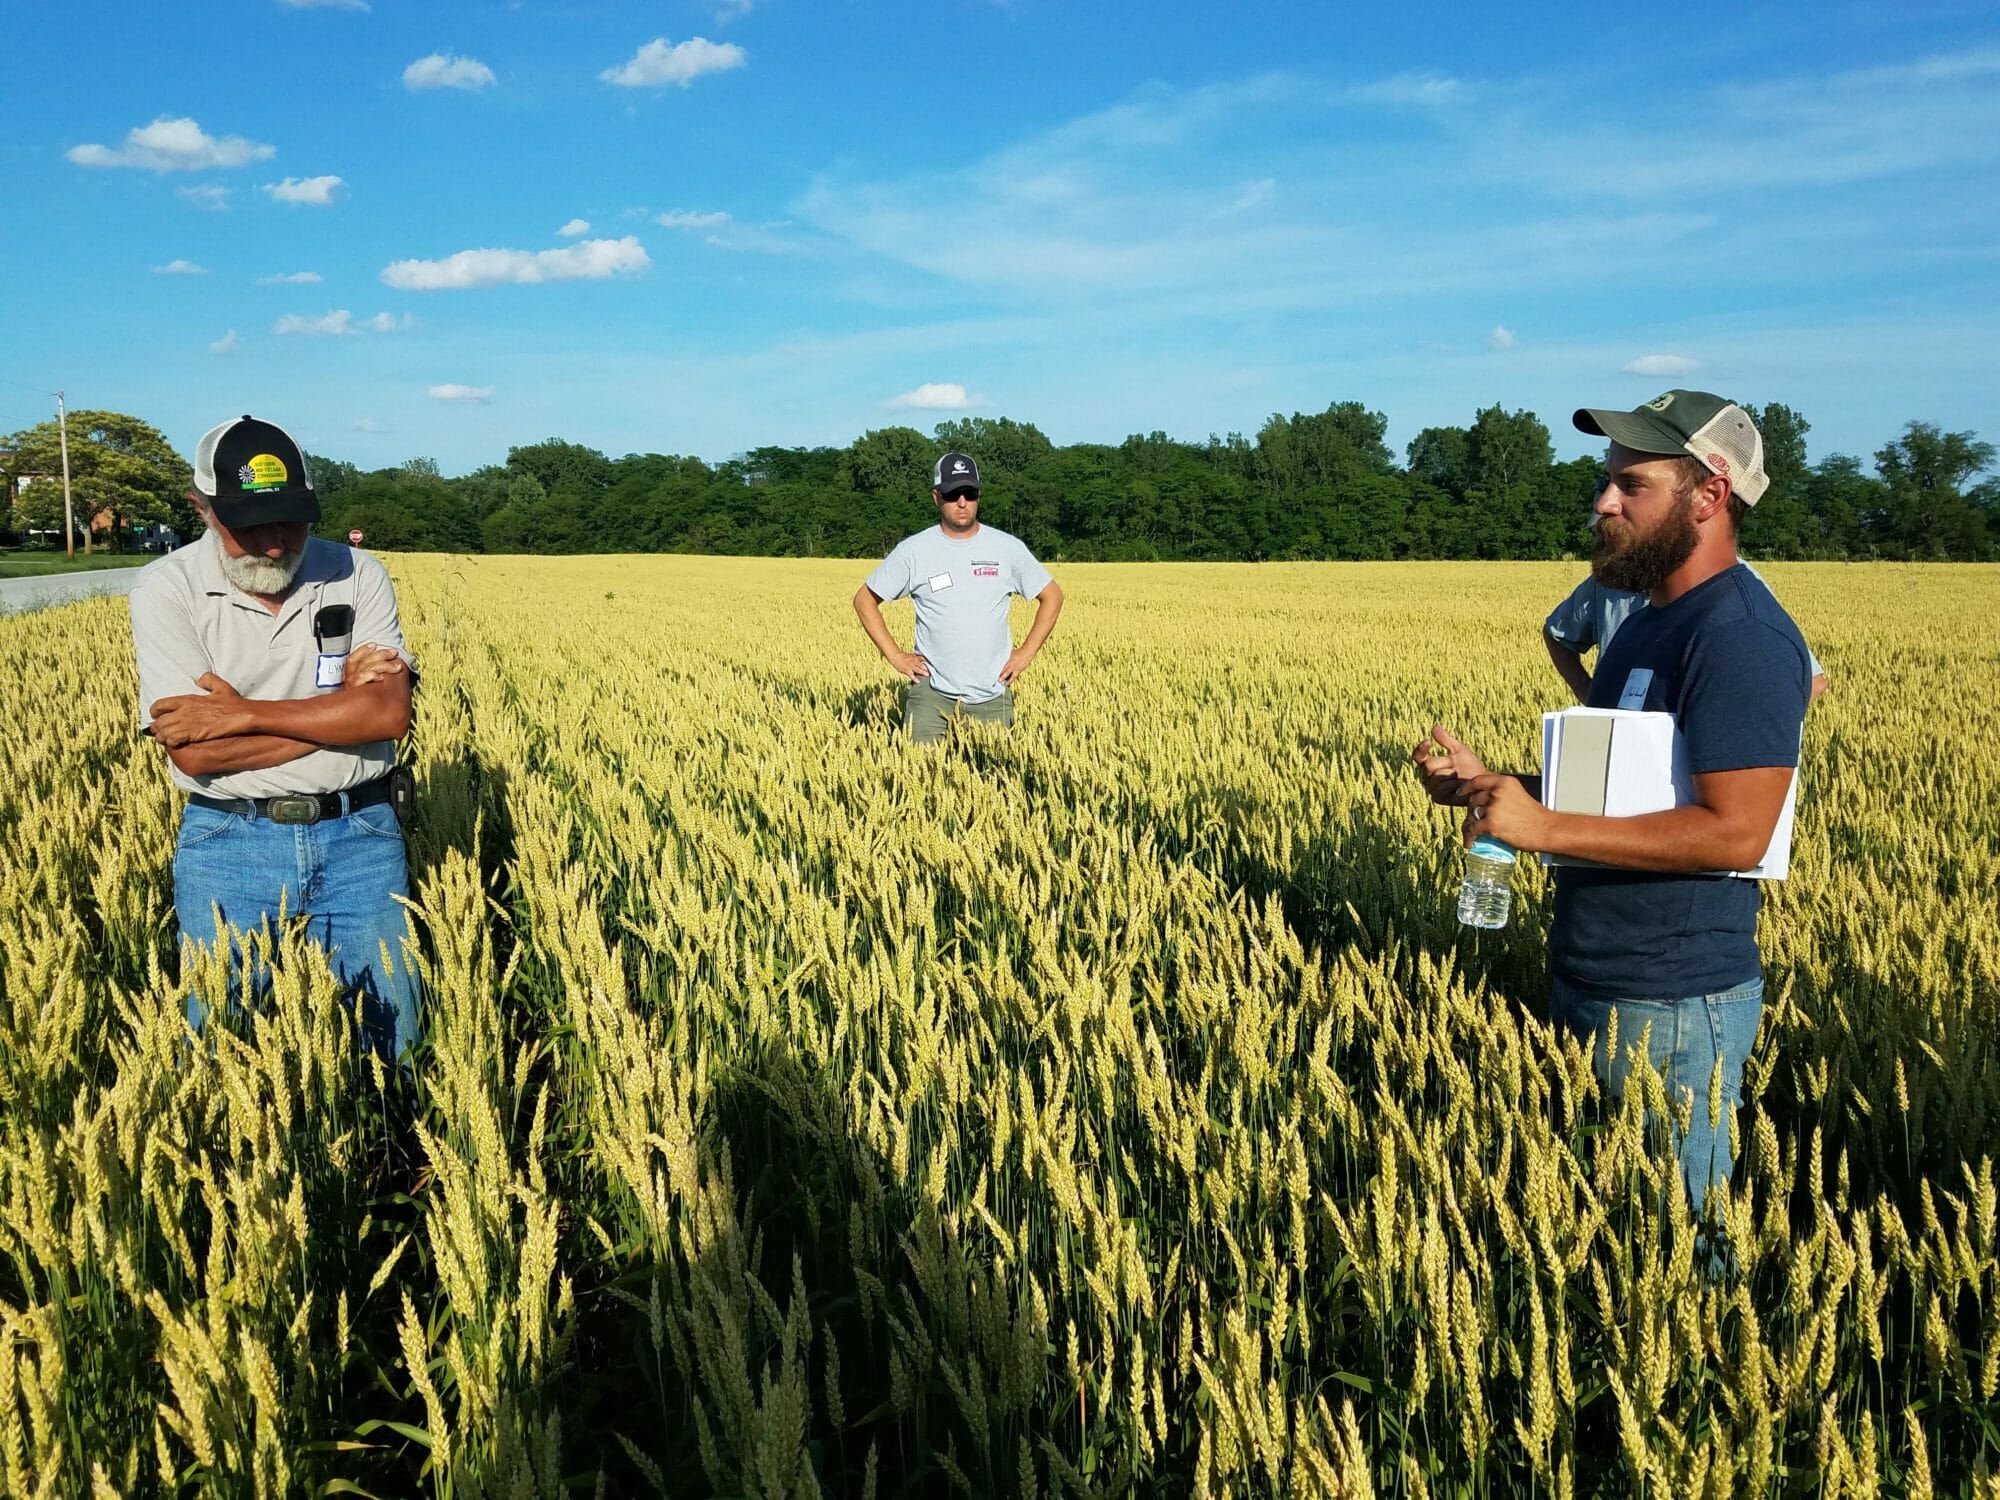
Dr. Hooker is a bit of a rare breed himself, not only is he a university professor conducting research and teaching students, he also farms about 600 acres with his father. On his own farm he practices a corn-soy-wheat rotation, learning from the findings of his trials at the university. “In Ontario we have several [long-term research trials],” Dave says. “The one I manage has seven different crop rotations, four nitrogen rate treatments and two tillage systems – with four reps of each combination. All repeated since 1995.” Some of the key crop rotations studied are: continuous corn; continuous soy; corn-soy; corn-soy-wheat and corn-soy-wheat/red clover cover crop. Comparing the results of these cropping trials provides a basis for understanding the full value of small grains in rotation.
 “The main question is what kind of impact does crop rotation have on corn yields,” Dave says, “When we include wheat into a corn-soybean rotation, our corn yields compared to a corn-soybean rotation are 15 bushels per acre higher.” The soybeans benefit too, 5 bushels per acre higher yields in a three-year rotation compared to the two-year corn-soy rotation.
“Another thing that wheat brings to the system is that it allows us to underseed or plant a cover crop after the wheat crop,” Dave says. “Cover crops are difficult to integrate into a corn-corn or corn-soy rotation – especially in Ontario, there’s not a lot of season left for a cover crop to grow.” In the cropping treatments with a red clover cover crop, Dave’s trials show an additional 10 bushels per acre increase to the corn yield on top of the 15 bushels per acre increase seen from just the wheat for a total bump of 25 bushels per acre over the corn-soy rotation. Dave also observed changes to the nitrogen fertilizer needs of the corn crop. “We determined that corn-soybean rotation is more reliant on fertilizer than a three-year rotation,” Dave says, “We can reduce economic optimum nitrogen by 15 pounds per acre with just wheat, no red clover. If we have red clover we get 70 to 90 pounds of nitrogen credit to that corn crop.”
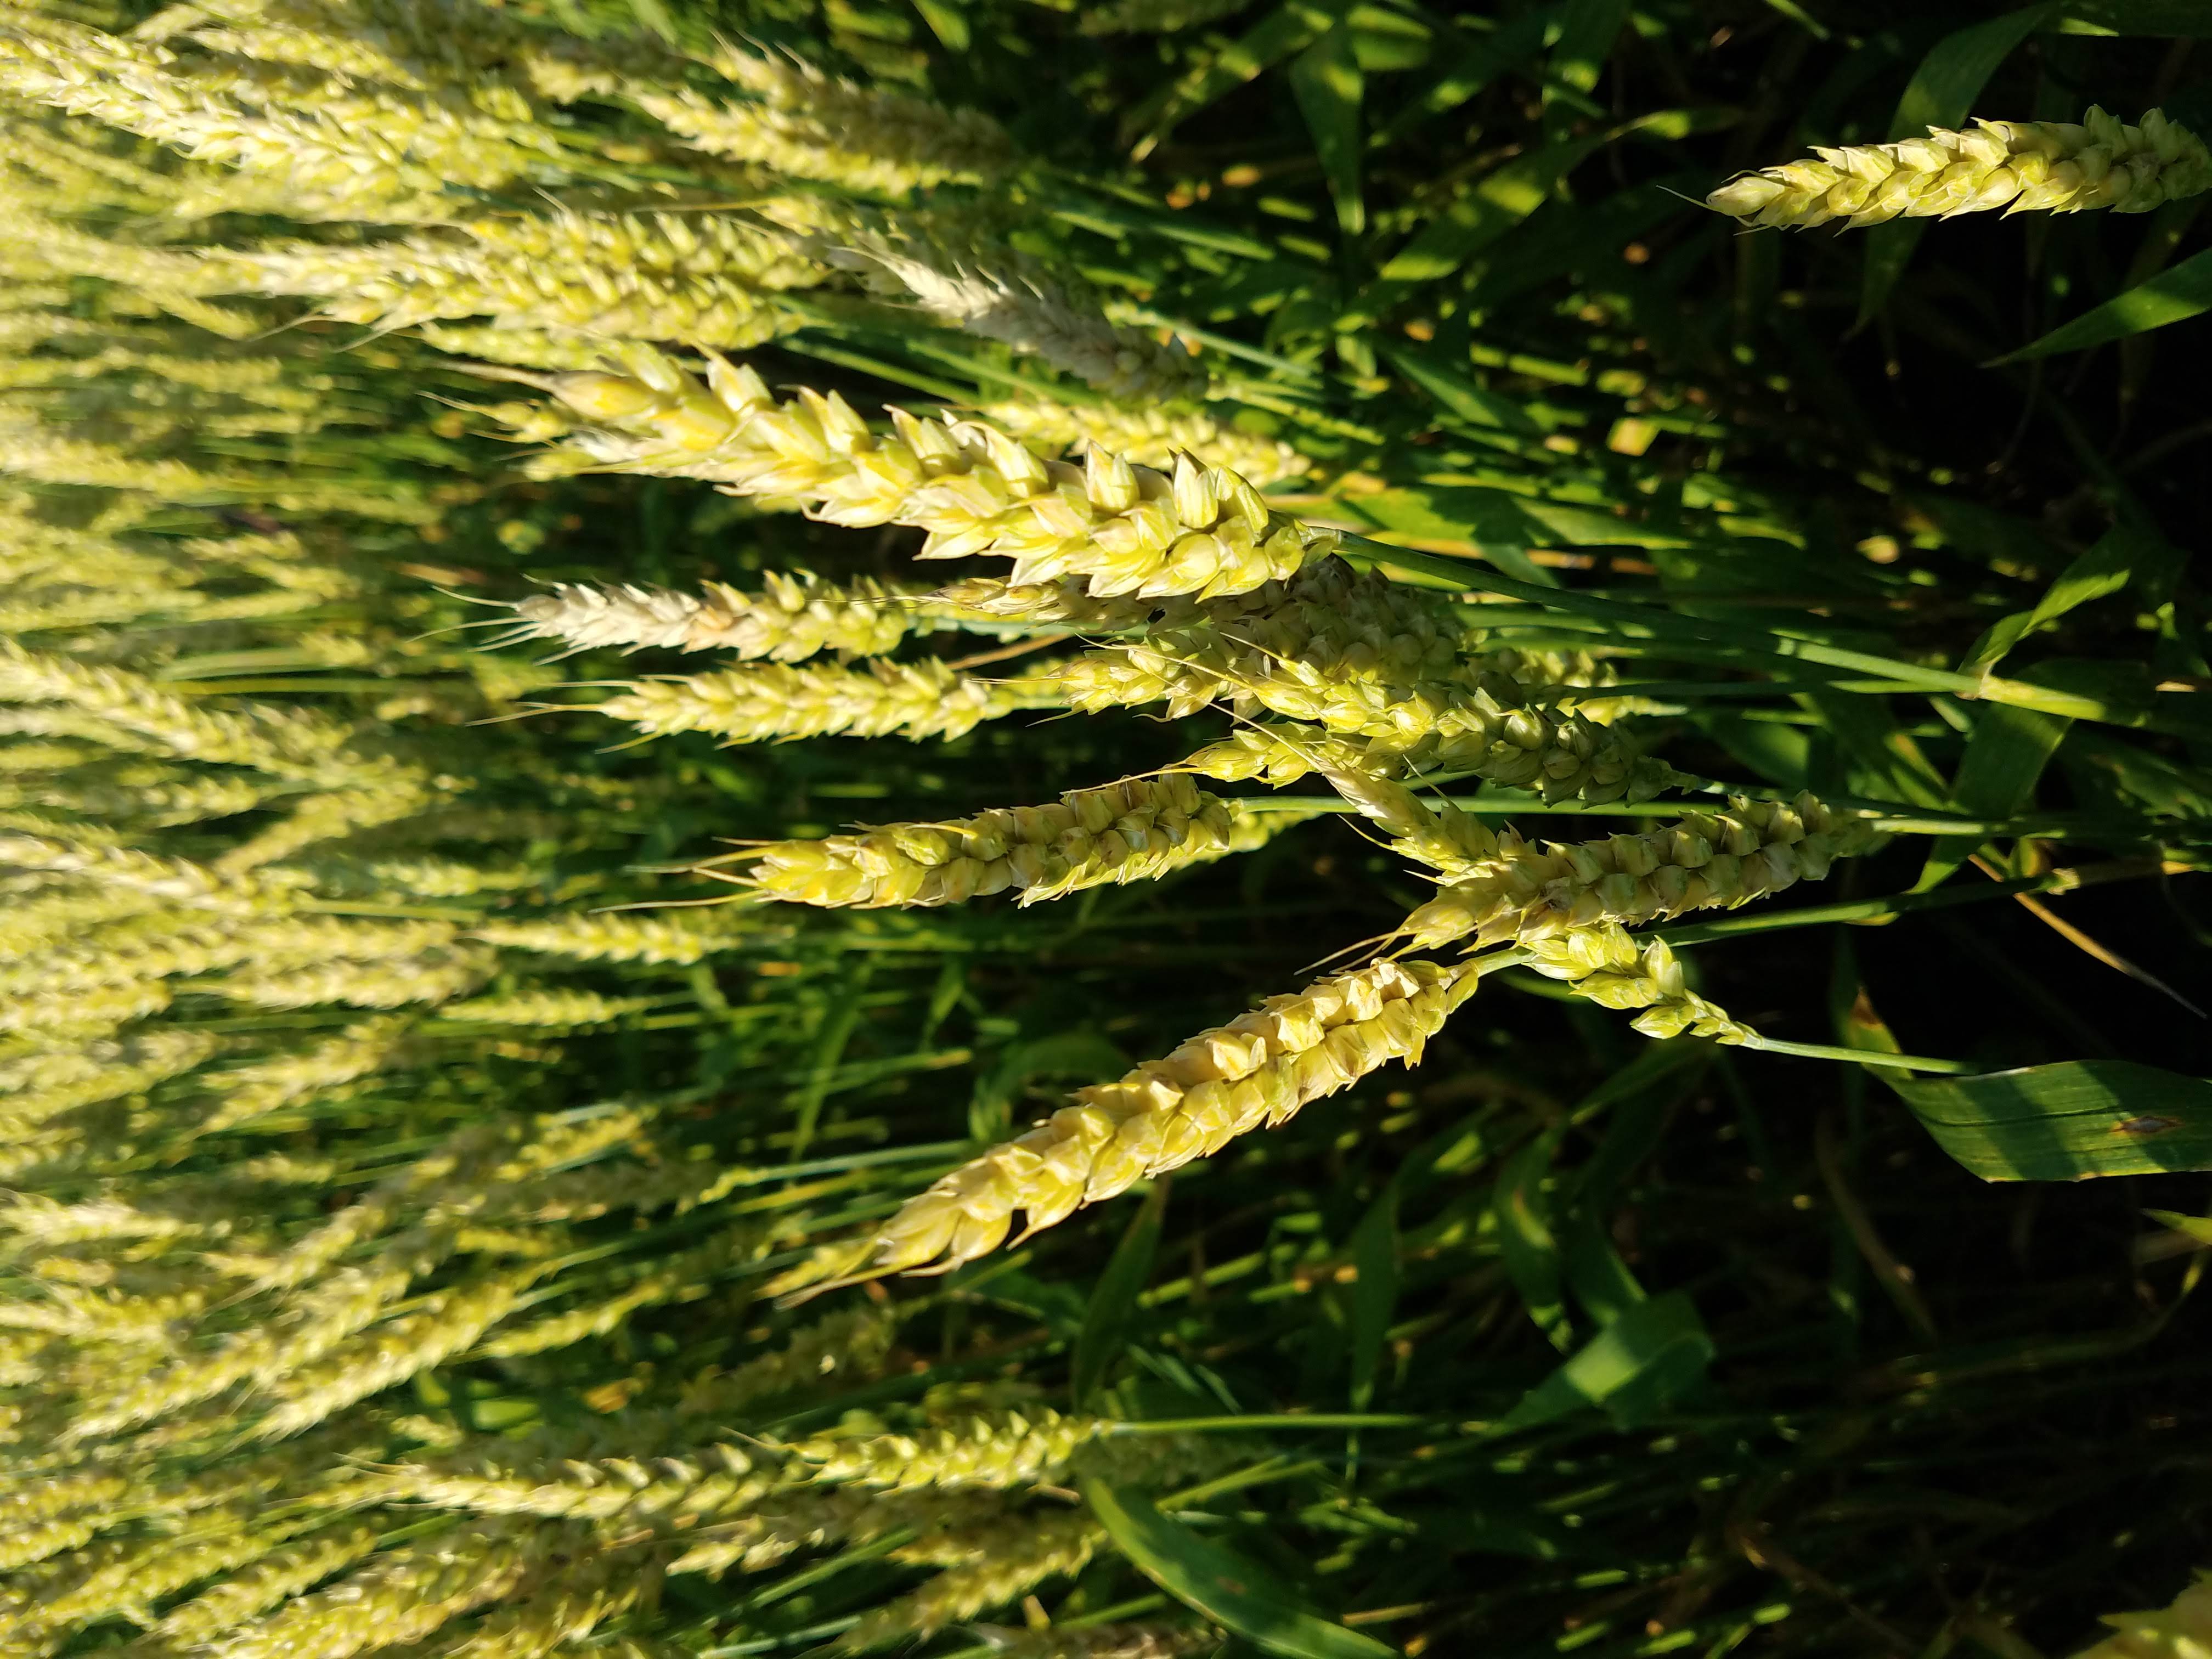
Another point that Dave makes, is that the health of the system also improves, which leads to more stability in extreme years. “Wheat supports soil structure, better organic matter, better aggregate stability,” Dave says, “The higher the corn or soybean yields, the more evapotranspiration takes place. Higher yields need more water and mother nature might not provide more water, so we should be building our soils to hold more water. Crop rotations are building more resiliency to handle this stress.” This shows in the cropping trial results, yield differences between two-year and three-year rotations are even wider in drought years, where the three-year rotation because of its soil health and water holding properties performs closer to average yields while the two-year, corn-soy rotation takes a big hit.
Crunching the Numbers
Now the hard part – putting numbers to this complex system. Dave demonstrated how he accounted for the revenues in a three-year rotation with market prices from where he lives in Ontario.
First, he accounted for the increased revenue from the augmented corn and soybean yields. Then he accounted for the nitrogen fertilizer costs avoided with the red clover.
| Performance Change in 3-Yr Rotation | Price per | Net Revenue Increases |
| 15 bu/ac increase in corn | $3/bushel | $45/acre |
| 5 bu/ac increase in soybean | $13/bushel | $65/acre |
| 90 lb. Nitrogen credit from clover | $0.38/lb of N | $35/acre |
| $145/acre |
In Ontario, wheat yields about 90 bushels per acre and fetches $5.50 per bushel at market, so a $145 per acre increase in revenue is similar to a 26 bushel per acre increase in yield or, phrased another way, the benefits to the rotation are similar to a $1.61 premium on top of the market price of the wheat. Because Ontario prices and yields were used for this example, it won’t be directly transferable to other states such as Iowa, but the method could be mimicked by swapping out the Ontario examples for prices and yields in your area.