In a Nutshell

- The practice of cover crop grazing provides economic returns, and farmers wonder if benefits to soil health follow suit. Economic returns are realized within a year’s time, while soil health impacts are slower to manifest.
- Mark Glawe, an integrated cattle-crop farmer, grazed cover crops in the fall, winter and spring from 2019-2021. In order to determine the economic and soil health impact of grazing cover crops, Glawe kept cover crop and grazing records and had his soil sampled in the fall and spring of each year.
Key Findings
- Glawe profited from grazing cover crops within the year of planting. In year 1, he profited $62.07/ac. In year 2, he profited $302.01/ac.
- Year 2 profits were higher due to a dry spring that provided more grazing days (21 in year 2 versus four days in year 1).
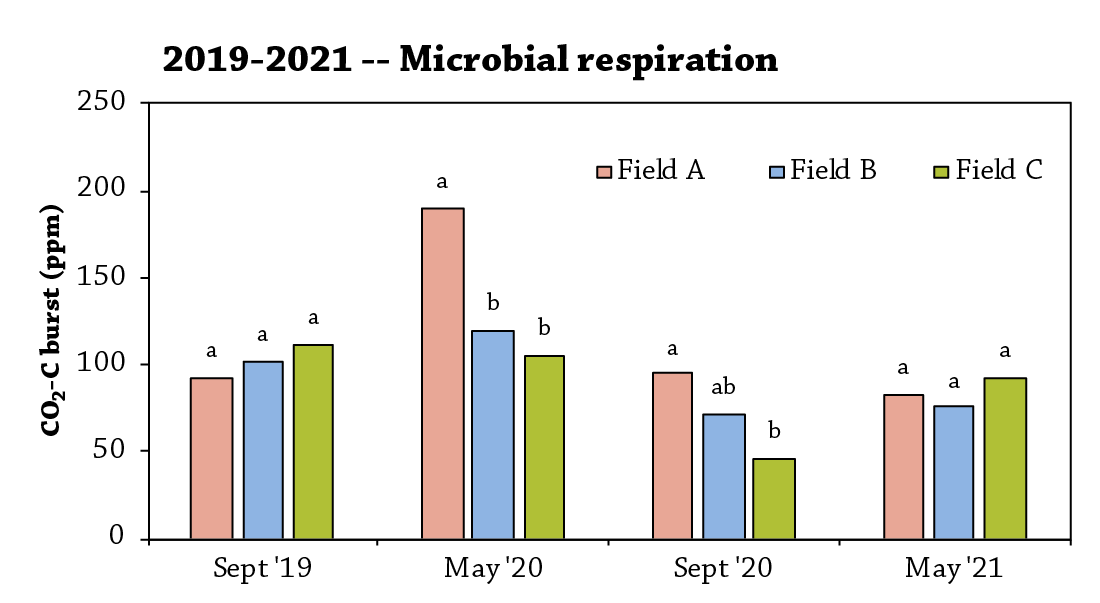
- Soil samples from May 2019 through May 2021 show few detectable trends in soil health indicators, but a 9-species, diverse cover crop mix improved microbial respiration.
- Grazing cover crops continues to be a way to achieve short-term economic benefits in integrated crop and livestock systems and helps subsidize the cost of cover crops in non-grazed fields.
Background
Mark Glawe’s farm is located in the hills of Clayton County, Iowa’s Driftless Area, a region known for ridges, valleys and karst geology. Glawe began using cover crops in his integrated crop and livestock operation 15 years ago. “The first reason I started planted cover crop was to stop erosion on the D and E slopes I farm. The second and third reasons were for feed and to break up compaction in my no-till soils,” explained Glawe. Not only do cover crop protect the soil, but profits can be achieved when livestock graze cover crops. [1,2] It is also known that grazing cover crops can provide benefits to soil health, but the effects are longer term [1] and require proper grazing management. This determine this, Glawe compared economics and soil health data between fields that grew different cover crop mixes and were grazed by cattle and also assessed a field that was only cover cropped in year 1 and never grazed.
Methods
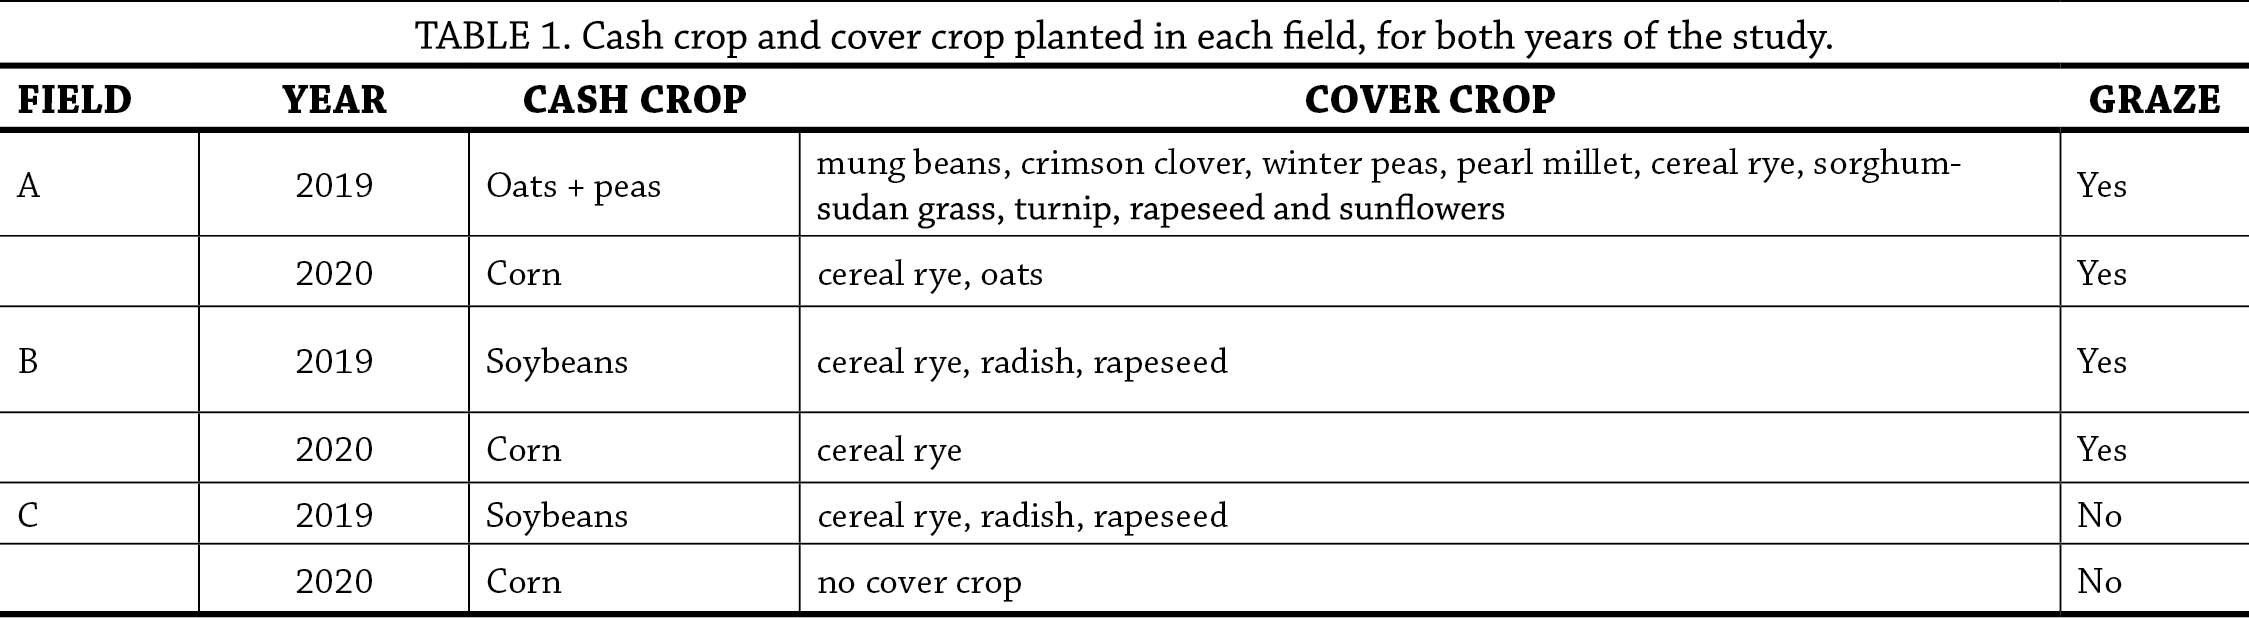
DesignIn summer of 2019 and 2020, Glawe seeded cover crops of his choice with the intention of grazing the forage produced. In order to determine the economic impact and soil health effects from cover crop and grazing management, Glawe established three treatment fields listed below and detailed in Table 1:
- Cover crops with grazing
- Cover crops with grazing
- Non-continuous cover crops with no grazing
 Grazing economics
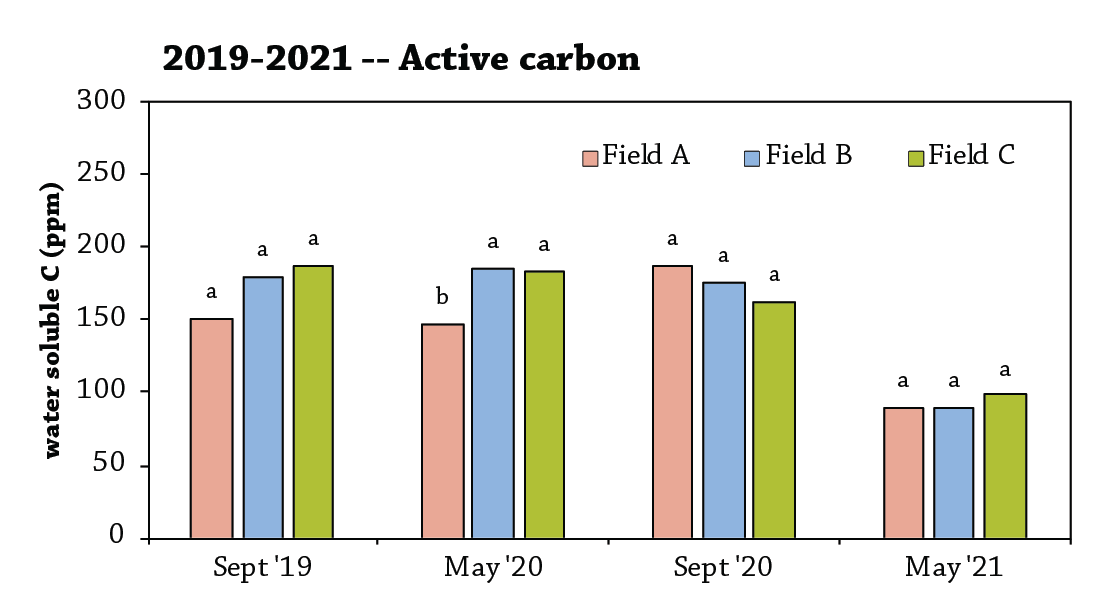
Glawe recorded cover crop expenses and grazing data in the grazed cover crops field, which were used to estimate the forage value of cover crops on each farm using ISU’s Ag Decision Maker Economics of Cover Crops tool. [3] This tool takes into account revenue and costs associated with cover crop grazing. Revenue includes the value of feed replaced by grazing, cost-share payments received and crop insurance discounts. Expenses include costs for establishing cover crops, additional herbicide and labor needed for cover crop termination, additional labor required, fence and water infrastructure. The value of feed replaced by grazing assumes cattle would have been fed hay valued at an average of $155/ton if cover crops were not available to graze. The tool takes into account number of cattle grazed, average weight of livestock, number of grazing days and cooperator estimates of dietary needs provided by supplemental feed and crop residue. The tool assumes cattle consume 4% of their bodyweight in forage dry matter (DM) each day (2.5 to 3.0% intake, 0.5% trampling loss and 0.5-1.0% buffer).[4] All formulas are nested within the tool. Net profit is reported on a per acre and a per animal unit (AU) basis. An animal unit is equal to 1,000 lb of animal. Net profit was calculated two ways – 1) including cost-share and crop insurance discounts and 2) without including cost share or crop insurance discounts. This economic analysis did not take into account effects on cash crop yield, soil retention value, nutrient retention value, soil health value, nutritional value of forage or animal weight gain. Grazing data was collected from fall 2019 to spring 2021. Soil health Soil samples were collected in September 2019 and 2020, and May 2020 and 2021 in all three treatment fields to a depth of 6 in. Soil samples were collected in the same locations each collection time. Samples were sent to AgSource Laboratories (Ellsworth, IA) and analyzed for microbial respiration by determining the burst of CO2 -C following rewetting of dried soil using an infrared gas analyzer. Other soil indicators measured included water soluble carbon (active C) and organic matter (OM). Soil data analysis Soil data were analyzed using JMP Pro 15 (SAS Institute Inc. Cary, NC) statistical software. Means separations are reported using Tukey’s least significant difference (LSD). Statistical significance was determined at the 90% confidence level.
Results and Discussion
Economic impact
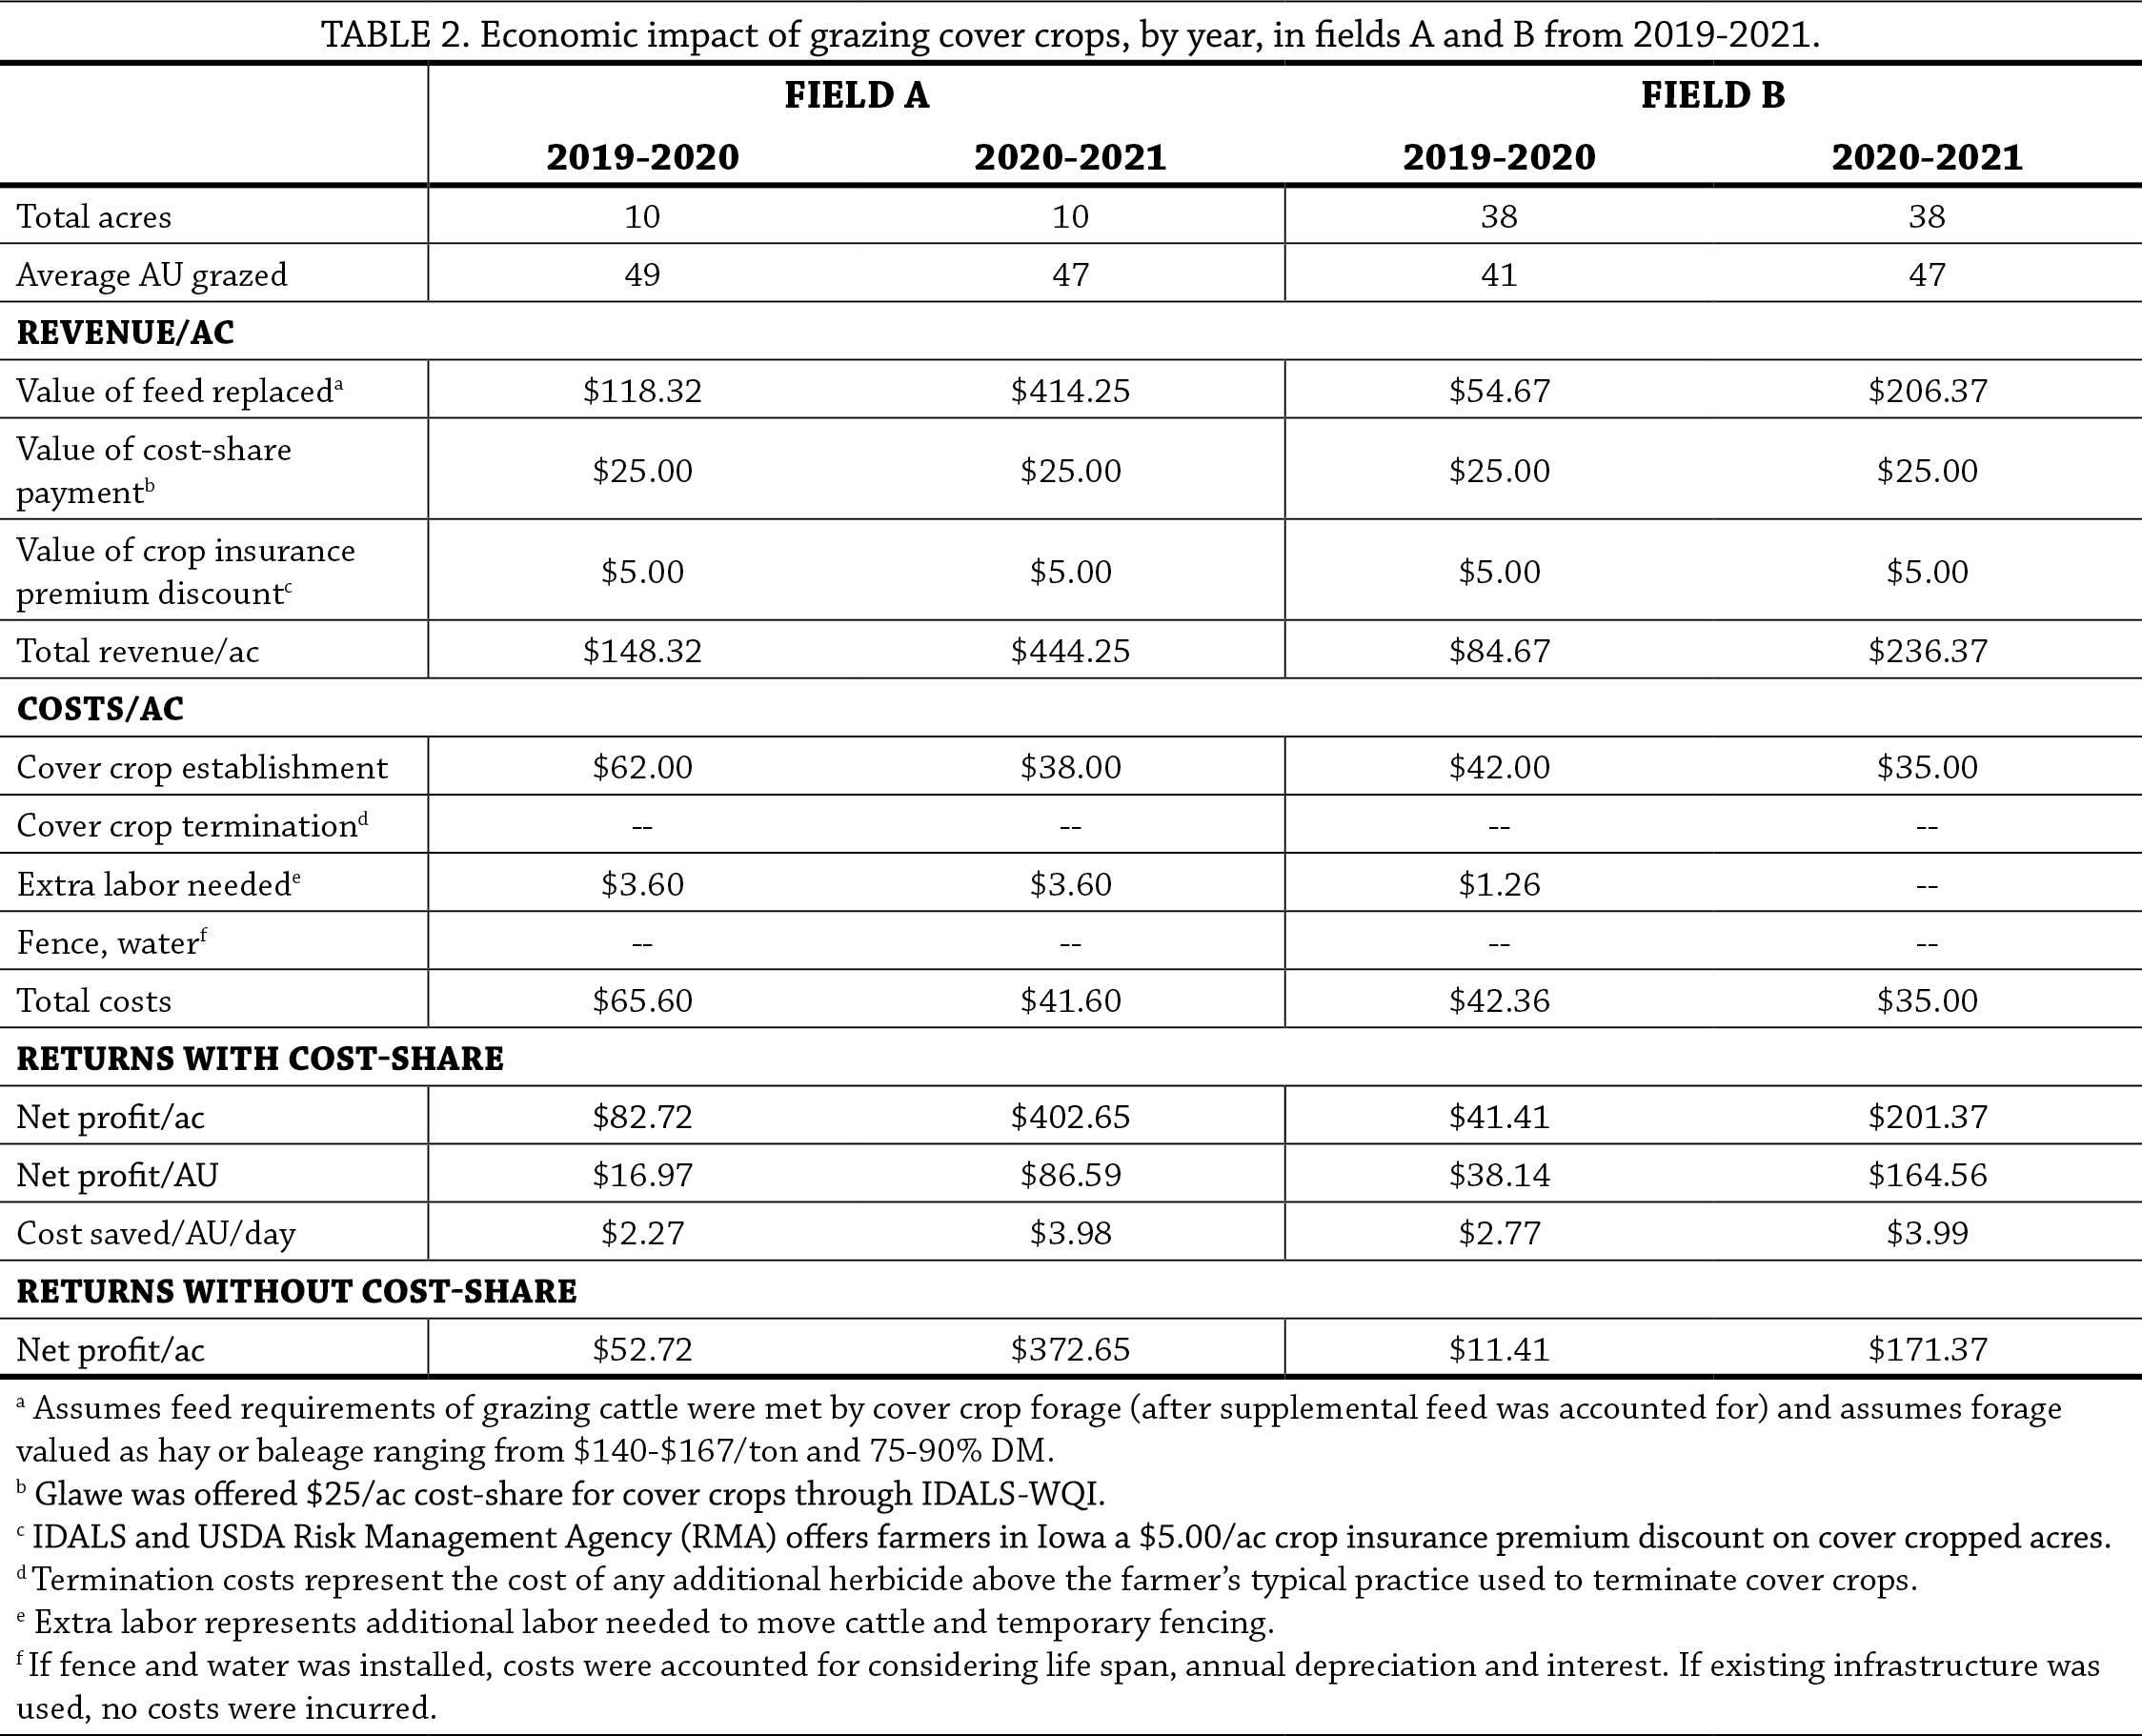
Results from Glawe’s farm are presented in Table 2. Two years of data for fields A and B (the grazed cover crop fields) are included, each year representing a full cover crop season spanning autumn to the following spring.
For field A, cover crop establishment cost Glawe $62.00/ac in year 1 and $38.00/ac in year 2. Year 1 cover crop seed price was higher due to the 9-species mix planted in July 2019 following a small-grain crop (Table 1). “Only 4 or 5 species out of the nine did really good in the mix because they seemed to drown out the less vigorous ones,” said Glawe who has determined his preferred mix would include cereal rye for spring grazing, oats for fall grazing, turnips (“because cows love them”), sorghum-sudan grass and pearl millet. For field B, cover crop establishment cost Glawe $42.00/ac in year 1 and $35.00/ac in year 2.
Glawe’s net profits from grazing cover crops averaged $62.07/ac in year 1 and $302.01/ac in year 2. The huge jump in year 2 is due to reduced seed costs and more fall grazing days in year 2 and particularly an abundance of available grazing in spring 2021. Glawe explained, “Out of the last ten years, 2020-2021 was my best year yet. On average, I profit about $50 per acre each year. Usually I don’t get that much spring grazing, but spring 2021 was dry so we weren’t having to take the cows off because of rain.” He grazed 36 cow-calf pairs for 21 days in fields A and B in spring of 2021 compared with 30 cows for four days in the spring of 2020. On an AU basis, Glawe profited an average of $27.55/AU in year 1 and $125.58/AU in year 2. For Glawe’s 1,300 lb cows, this equates to $35.82/head and $163.25/head, respectively.
It is important to note that Glawe reaped greater profits from less expensive cover crops (in year 2 he simply planted cereal rye and oats). Also contributing to year 2 profits was a decrease in supplemental feed (crop residue, hay and baleage) provided to the herd. Supplemental feed contributed to approximately 58% of the cow’s feed needs in the fall, winter and spring of year 1, compared with approximately 20% in year 2.
Another way to summarize the forage value of cover crops is to calculate feed costs saved per AU per day when cattle graze cover crops. On average, Glawe saved $2.52/AU/day in feed expenses in year 1 and $3.99/AU/day in year 2. This is an important finding considering winter feed costs represent the single largest cost in cattle operations.[5] Grazing cover crops reduce winter feed costs.
Without the assistance of cost-share and crop insurance discounts ($30/ac), net profits averaged $32.07/ac in year 1 and $272.01/ac in year 2. Regardless of financial assistance, Glawe scored positive profits from grazing cover crops within the same year of planting cover crops.
Field C was cover-cropped in year 1 only and was not grazed in either year. Glawe’s cover crop seed costs were $42/ac in year 1. He did not incur expenses in year 2 because no cover crop was planted. Because Glawe did not graze field C, we consider his cover crop seed cost as net negative economic returns for the sake of this project.
 Soil health-microbial respiration

Conclusions and Next Steps
The economic results from this project continue to prove that grazing cover crops provides short-term economic benefits and pay off in one year. Profits can be spread out over the entire farm. Glawe’s field C was not grazed in the study, but usually is planted to cover crops. One way to look at it: The profits reaped from grazing fields A and B help Glawe pay for cover crops on his non-grazed acres. In the case of field C, alfalfa is planted next to it and therefore he did not want cows escaping to graze the alfalfa. “I’m pretty conservative. If I wouldn’t be profiting I wouldn’t be doing it,” stated Glawe. “I started planting cover crops in 2006 and grazed them for the first time in 2021. The first few years were kind of disappointing but you have to stick with it. You’ll start seeing the benefits three to four years down the road.” Another economic boost that is was not quantified for this study but is important to mention is the decreased nitrogen fertilizer rate Glawe applied due to a soil health boost from microbial respiration (discussed with Figure 1). Lowering nitrogen application rates saves money and is made possible through diversifying the crop rotation with a small grain and legume cover crops (i.e., mung beans, clover, peas; Table 1). Glawe plans to grow 40 acres of either oats or cereal rye for seed in 2021, followed by a 4- or 6-species mix that will be rotationally grazed in the fall. In Glawe’s words, “it’s a no-brainer.” Others are catching on. “My neighbors are catching on. In Clayton County, we had 2,000 acres of cover crops and two thirds of those acres were used for grazing.”
Funding Acknowledgement

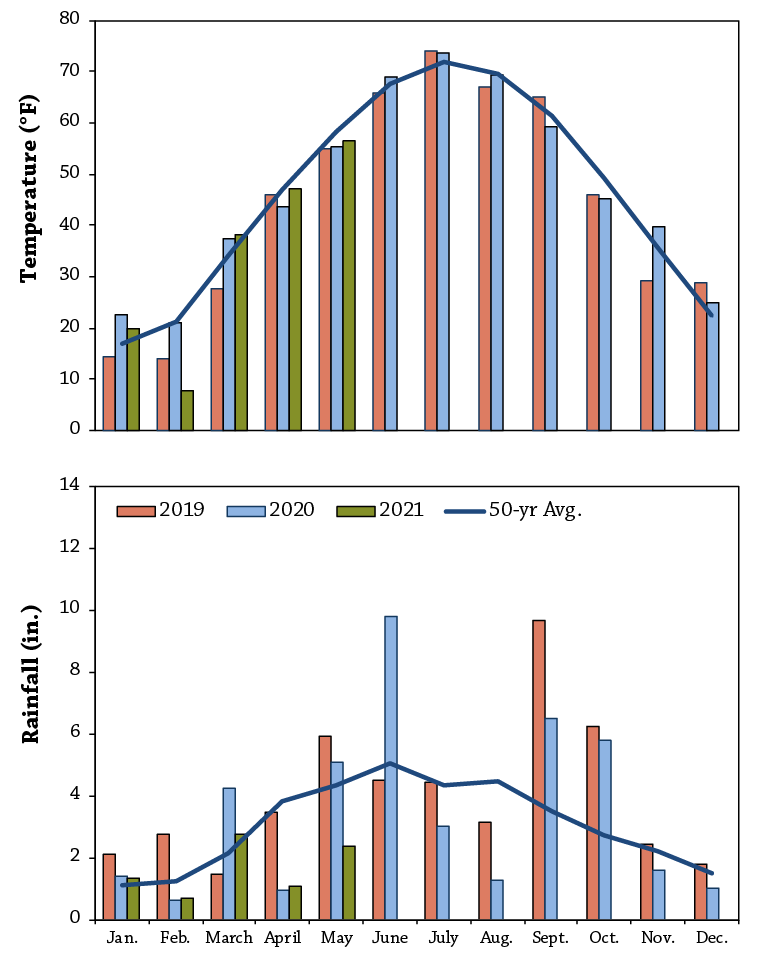
Appendix- Trail Design and Weather Conditions
References
- Myers, R., Weber, A., S. Tellatin. 2019. Cover Crop Economics. SARE Technical Bulletin. https://www.sare.org/resources/cover-crop-economics/ (accessed April 2020).
- Filbert, M. 2020. Economic and Soil Health Impact of Grazing Cover Crops, 2018-2019. Practical Farmers of Iowa Cooperators' Program. https://practicalfarmers.org/wp-content/uploads/2020/06/20_L_Economic-and-Soil-Health-Impact-of-Grazing-Cover-Crops.pdf (accessed June 2021).
- Edwards, E., Plastina, A., and M. Filbert. 2018. Economics of Cover Crops. Iowa State University Ag Decision Maker. https://www.extension.iastate.edu/agdm/crops/html/a1-91.html (accessed April 2020).
- NRCS. 2009. Balancing your Animals with your Forage. USDA. 2–5. https://www.nrcs.usda.gov/Internet/FSE_DOCUMENTS/stelprdb1097070.pdf (accessed April 2020).
- Boetel, B. 2017. In The Cattle Markets: Cost of Wintering Cattle. Drovers. https://www.drovers.com/article/cattle-markets-cost-wintering-cattle (accessed April 2020).
- Franzluebbers, A. J., Broome, S. W., Pritchett, K. L., Wagger, M. G., Lowder, N., Woodruff, S., & Lovejoy, M. (2021). Multispecies cover cropping promotes soil health in no-tillage cropping systems of North Carolina. Journal of Soil and Water Conservation, 76(3), 263-275.
- Franzluebbers, A.J. and J.A. Stuedemann. 2015. Does grazing of cover crops impact biologically active soil carbon and nitrogen fractions under inversion or no tillage management? Journal of Soil and Water Conservation. 70(6), 365–373.
- Iowa Environmental Mesonet. 2021. Climodat Reports. Iowa State University. http://mesonet.agron.iastate.edu/climodat (accessed July 2021).