

Economic and Soil Health Impacts of Grazing Cover Crops in a Feedlot System
This research was funded by the Iowa Department of Agriculture and Land Stewardship – Water Quality Initiative.
In a Nutshell:
- Ben Albright, an integrated beef and crop farmer, grazed cover crops with finishing steers in the fall, winter and early spring. In order to determine the economic and soil health impact of grazing cover crops, he kept cover crop and grazing records and had his soil sampled in 2019, 2020 and 2021.
Key Findings:
- Albright profited from grazing cover crops each year. His profits averaged $45.56/acre or $16.08/head.
- Soil samples from May 2019 through April 2021 show very few detectable trends in soil health.
- Grazing cover crops is becoming standard practice for cow-calf producers, but less so for feedlot producers. Albright proved how a cover crop field adjacent to his feedlot could provide supplemental forage through simply allowing finishing cattle to graze them, which saved him thousands of dollars in feed costs each year.
Background
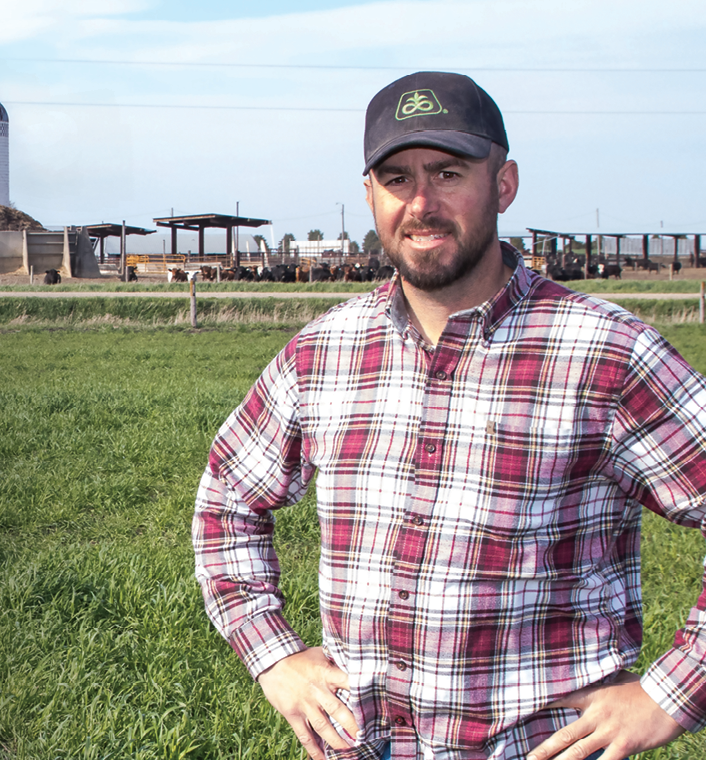
Ben Albright stands in his cover crop field adjacent to his feedlot in Lytton, IA. Photo courtesy of Landus Cooperative.
Ben Albright and his family operate a diversified crop and beef feedlot farm. Feedlot cattle were allowed access to a cover crop field adjacent to the lot, which provided supplemental forage to the herd. This allowed Albright to decrease the amount of total mixed ration (TMR) fed to the cattle, thus saving him money.
Evidence has been mounting around the profits that can be achieved when livestock graze cover crops.[1,2] It is known that grazing cover crops can provide benefits to soil health, but the effects are longer term [1] and require proper grazing management. To determine this, Albright tracked economics and soil health data for three years. This report describes the economic and soil health impacts Albright experienced in his field where cover crops were grazed from 2019-2021.
Methods
Design
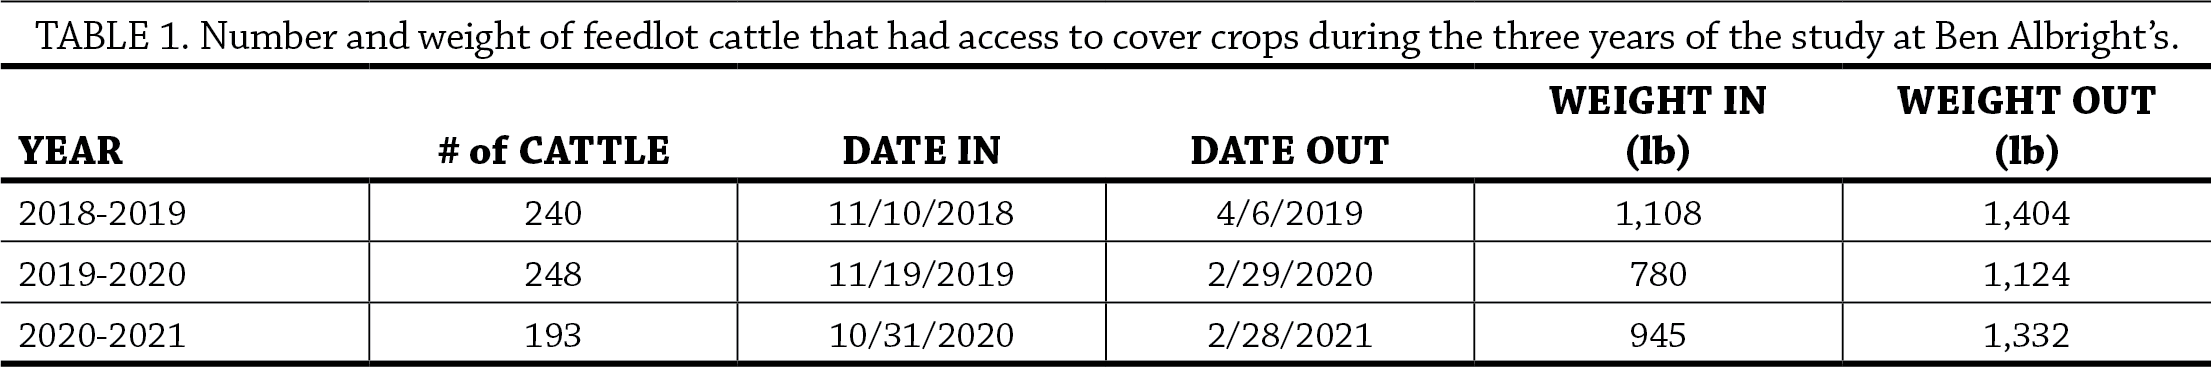
In September of 2018, 2019 and 2020, Albright seeded cereal rye and oats in a 79-acre field adjacent to his feedlot with the intention of grazing the forage produced. Cover crops were seeded in fields rotated with corn and soybeans. Cattle in the lot were given access to the cover crop field from fall to late winter/early spring (Table 1). For soil sampling, Albright established three treatment fields:
- No cover crops with no grazing (no cover crop)
- Cover crops with no grazing (cover crop)
- Grazed cover crops (cover crop and graze)
Feed economics
Albright recorded cover crop expenses, cover crop grazing data and tons of TMR amounts offered to cattle. Based on comparing tons of TMR offered to two different pens of cattle, one of which had access to cover crops as supplemental feed, Albright estimated cover crop forage to be valued at $0.05 per pound of gain.
In order to estimate the value of cover crops in Albright’s system, the revenue and costs associated with cover crop grazing were taken into account. Revenue includes the value of feed replaced by grazing, cost-share payments received and crop insurance discounts. Expenses include costs for establishing cover crops and additional herbicide needed for cover crop termination.
Cattle were weighed when they arrived and departed from the feedlot in order to calculate average weight gain per animal, which then was multiplied by $0.05/lb gain, representing the value of the cover crop forage. Net profit is reported on a per acre and a per head basis. Net profit was calculated two ways: 1) including cost-share and crop insurance discounts; and 2) without including cost-share or crop insurance discounts.
This economic analysis did not take into account effects on cash crop yield, soil retention value, nutrient retention value, soil health value or nutritional value of forage.
Soil health
Soil samples were collected in spring 2019, 2020 and 2021 and in fall 2019 and 2020 in all three treatment fields to a depth of 6 in. Soil sample locations were marked by GPS and taken within the same soil type.
Samples were sent to AgSource Laboratories (Ellsworth, IA) and analyzed for microbial respiration by determining the burst of CO2-C following rewetting of dried soil using an infrared gas analyzer. Other soil indicators measured included water soluble carbon (active C) and organic matter (OM).
Soil data were analyzed using JMP Pro 15 (SAS Institute Inc., Cary, NC) statistical software. Means separations are reported using Tukey’s least significant difference (LSD). Statistical significance was determined at the 90% confidence level.
Results and Discussion
Economic impact
Results from Albright’s farms are presented in Table 2. Three years of data are included, each year representing a full cover crop season spanning autumn to the following spring. On average, cover crop establishment cost $28.18/ac. Net profits from grazing averaged $45.56/ac or $16.08/head. Without the assistance of cost-share and crop insurance discounts, net profits averaged $15.56/ac or $5.51/head. Regardless of financial assistance, Albright scored positive profits from grazing cover crops within the same year of planting cover crops.
Across the three years, Albright saved an average of $3,851 in TMR per year. This is an important finding considering winter feed costs represent the single largest cost in cattle operations.[3] Grazing cover crops reduces winter feed costs. “I think grazing covers in a no brainer for cattle producers, as the numbers show,” stated Albright.

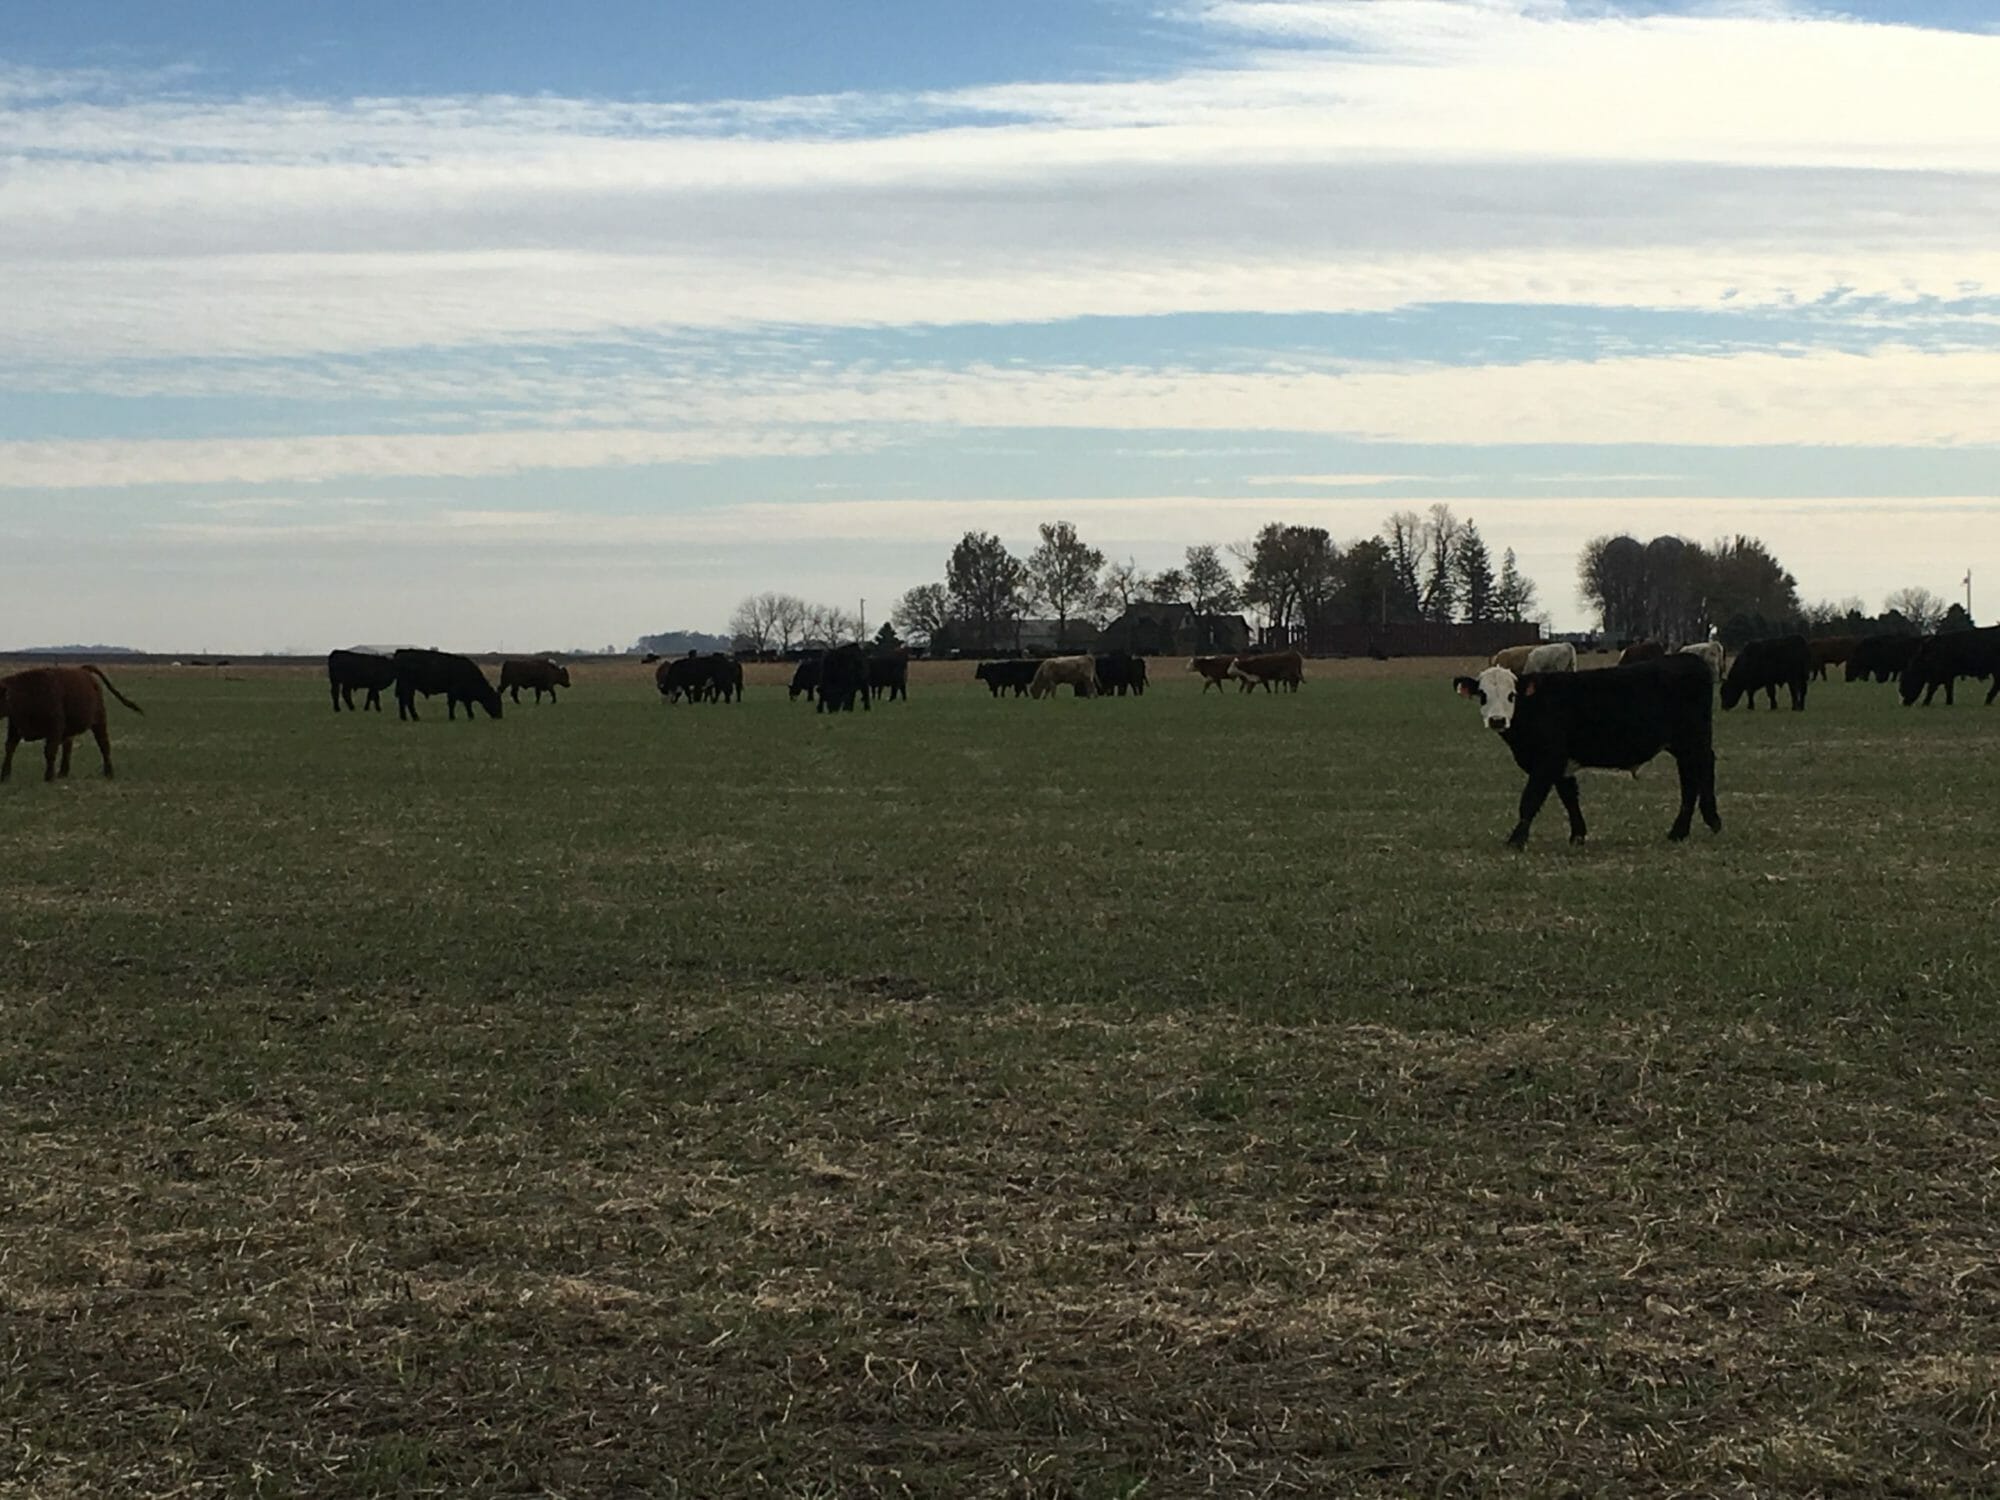
Cattle graze a cereal rye and oat cover crop field in early November at the Albright farm.
Soil health – microbial respiration
Figure 1 shows that microbial respiration readings were inconsistent over time. The highest values were recorded in 2019 and the lowest values in 2020. The cover crop field, which was not grazed, scored statistically greatest or among the statistically greatest on each sampling date.
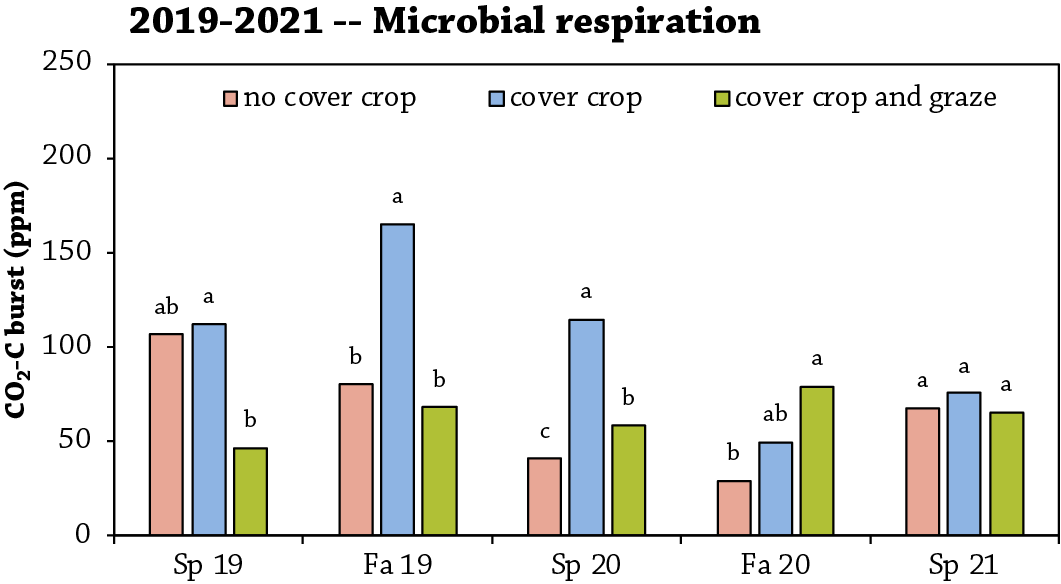
FIGURE 1. Soil microbial respiration (CO2-C burst from soils) for each field on each sampling date in 2019, 2020 and 2021. Analyses were conducted separately for each date. By date, results that differed by less than the least significant difference (LSD) are followed by the same letter-rankings and are considered statistically equal. Results followed by a different letter ranking are considered statistically different at the 90% confidence level.
Soil health – active carbon
Figure 2 shows active C in each field which illustrates no general differences among fields from spring 2019 to spring 2020. Active C was overall greatest in fall 2020; on that sampling date, the grazed cover crop field scored the highest value.
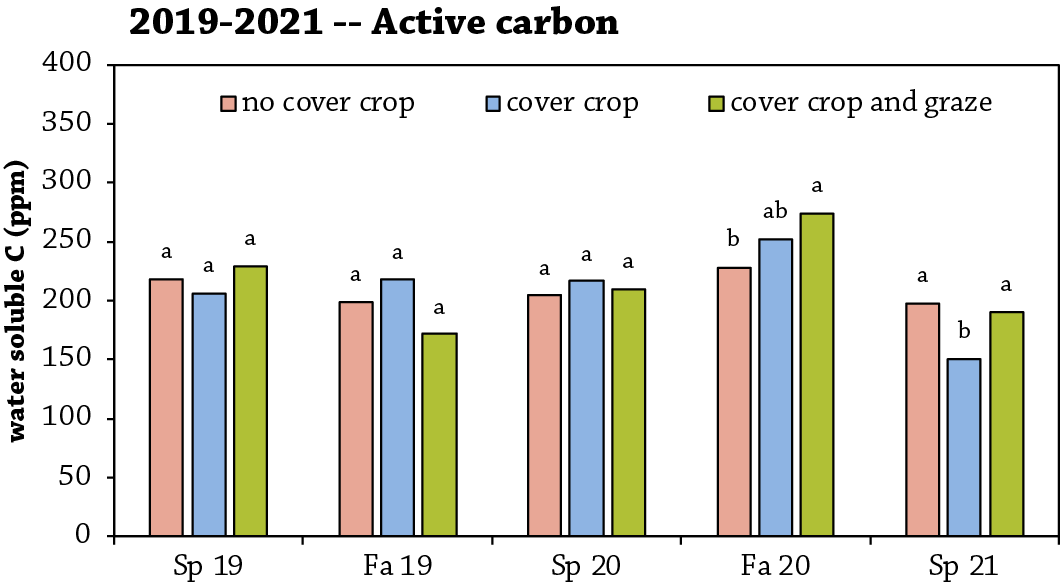
FIGURE 2. Active carbon (water soluble carbon) for each field at each sampling date in 2019, 2020 and 2021. Analyses were conducted separately for each date. By date, results that differed by less than the least significant difference (LSD) are followed by the same letter-rankings and are considered statistically equal. Results followed by a different letter ranking are considered statistically different at the 90% confidence level.
Soil health – organic matter
Figure 3 shows OM values differed from date to date but did not differ among the fields at any date. Soil organic matter in the Canisteo soils at Albright’s farm range from 2.2 to 5.5%. “We have high organic matter to begin with, so I wasn’t expecting any huge improvement. If there was any improvement in soil health that is just another added benefit,” explained Albright, who will continue to graze cover crops into the future.
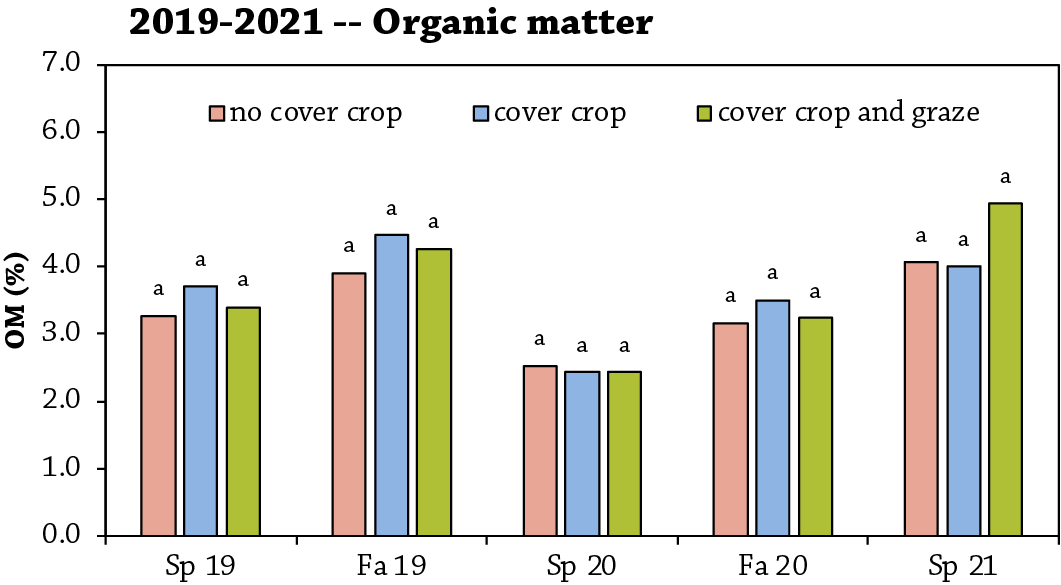
FIGURE 3. Soil organic matter (OM) for each field at each sampling date in 2019, 2020 and 2021. Analyses were conducted separately for each date. By date, results that differed by less than the least significant difference (LSD) are followed by the same letter-rankings and are considered statistically equal at the 90% confidence level.
Conclusions and Next Steps
The economic results from this project add to a growing body of work by PFI cooperators showing that grazing cover crops provides short-term economic benefits and pay off in one year. Grazing cover crops is becoming standard practice for cow-calf producers, but less so for feedlot producers. In this case, Albright proved how a cover crop field adjacent to his feedlot could provide supplemental forage through simply allowing finishing cattle to graze them. This saved him thousands of dollars in feed costs each year. Albright proclaimed, “I will definitely continue to plant cover crops on all the fields we graze.”
Soil health results indicate the soil health impact of grazing cover crops may take more time to realize and research efforts may be better spent focusing on economics, ecological benefits and field fitness.
Funding Acknowledgement
![]()

References
- Myers, R., Weber, A., S. Tellatin. 2019. Cover Crop Economics. SARE Technical Bulletin. https://www.sare.org/Learning-Center/Bulletins/Cover-Crop-Economics (accessed August 2021).
- Filbert, M. 2017. Livestock Economic Impact of Grazing Cover Crops in Cow-Calf Operations. Practical Farmers of Iowa Cooperators’ Program. https://practicalfarmers.org/research/economic-impact-of-grazing-cover-crops-in-cow-calf-operations/ (accessed August 2021).
- Boetel, B. 2017. In The Cattle Markets: Cost of Wintering Cattle. Drovers. https://www.drovers.com/article/cattle-markets-cost-wintering-cattle (accessed August 2021).
- Franzluebbers, A.J. and J.A. Stuedemann. 2015. Does grazing of cover crops impact biologically active soil carbon and nitrogen fractions under inversion or no tillage management? Journal of Soil and Water Conservation. 70(6):365–373. https://www.jswconline.org/content/70/6/365 (accessed August 2021).