

This research was funded by the Walton Family Foundation.
In a Nutshell:
- Jack Boyer was interested to know if the soil health benefits of long-term cover cropping on his farm would permit him to reduce his nitrogen program without sacrificing corn yield. In a field with a 9-year history of cover cropping, Boyer compared corn yields and returns on investment between corn receiving different nitrogen rates.
- Boyer hypothesized he could reduce nitrogen by 60 lb/ac from his typical rate (180 lb N/ac) while maintaining similar corn yields and generating a greater return on investment.
Key Findings:
- Maximum corn yields were achieved at 180 lb N/ac.
- Maximum returns to N, however, were achieved at 150 lb N/ac.
- Trialing N fertilizer rates in soil health systems appears to be low-hanging fruit for discovering economic advantages in the face of rising input costs.
Background
Jack Boyer has been curious to determine if the soil health benefits of long-term cover cropping would allow him to reduce nitrogen in the corn phase of his corn-soybean rotation. Boyer conducted trials in 2019 and 2020 to compare yield and profitability of corn receiving his typical nitrogen rate (180 lb/ac) and a reduced nitrogen rate (130 lb/ac).[1,2] In the first year of research, Boyer found that reducing his typical nitrogen rate by 50 lb/ac saved him $26/ac and did not reduce corn yield. In the second year of his research, however, Boyer reduced nitrogen by 70 lb/ac, which resulted in lower corn yields and a $129/ac loss to his return on investment. Drought and the derecho windstorm during the second year of Boyer’s research likely influenced the results. Thus, in 2021, Boyer conducted the trial a third time with his fingers crossed for better weather conditions than 2020. This time he compared five nitrogen-rate treatments: 90, 110, 130, 150 and 180 lb N/ac.
Methods
Design
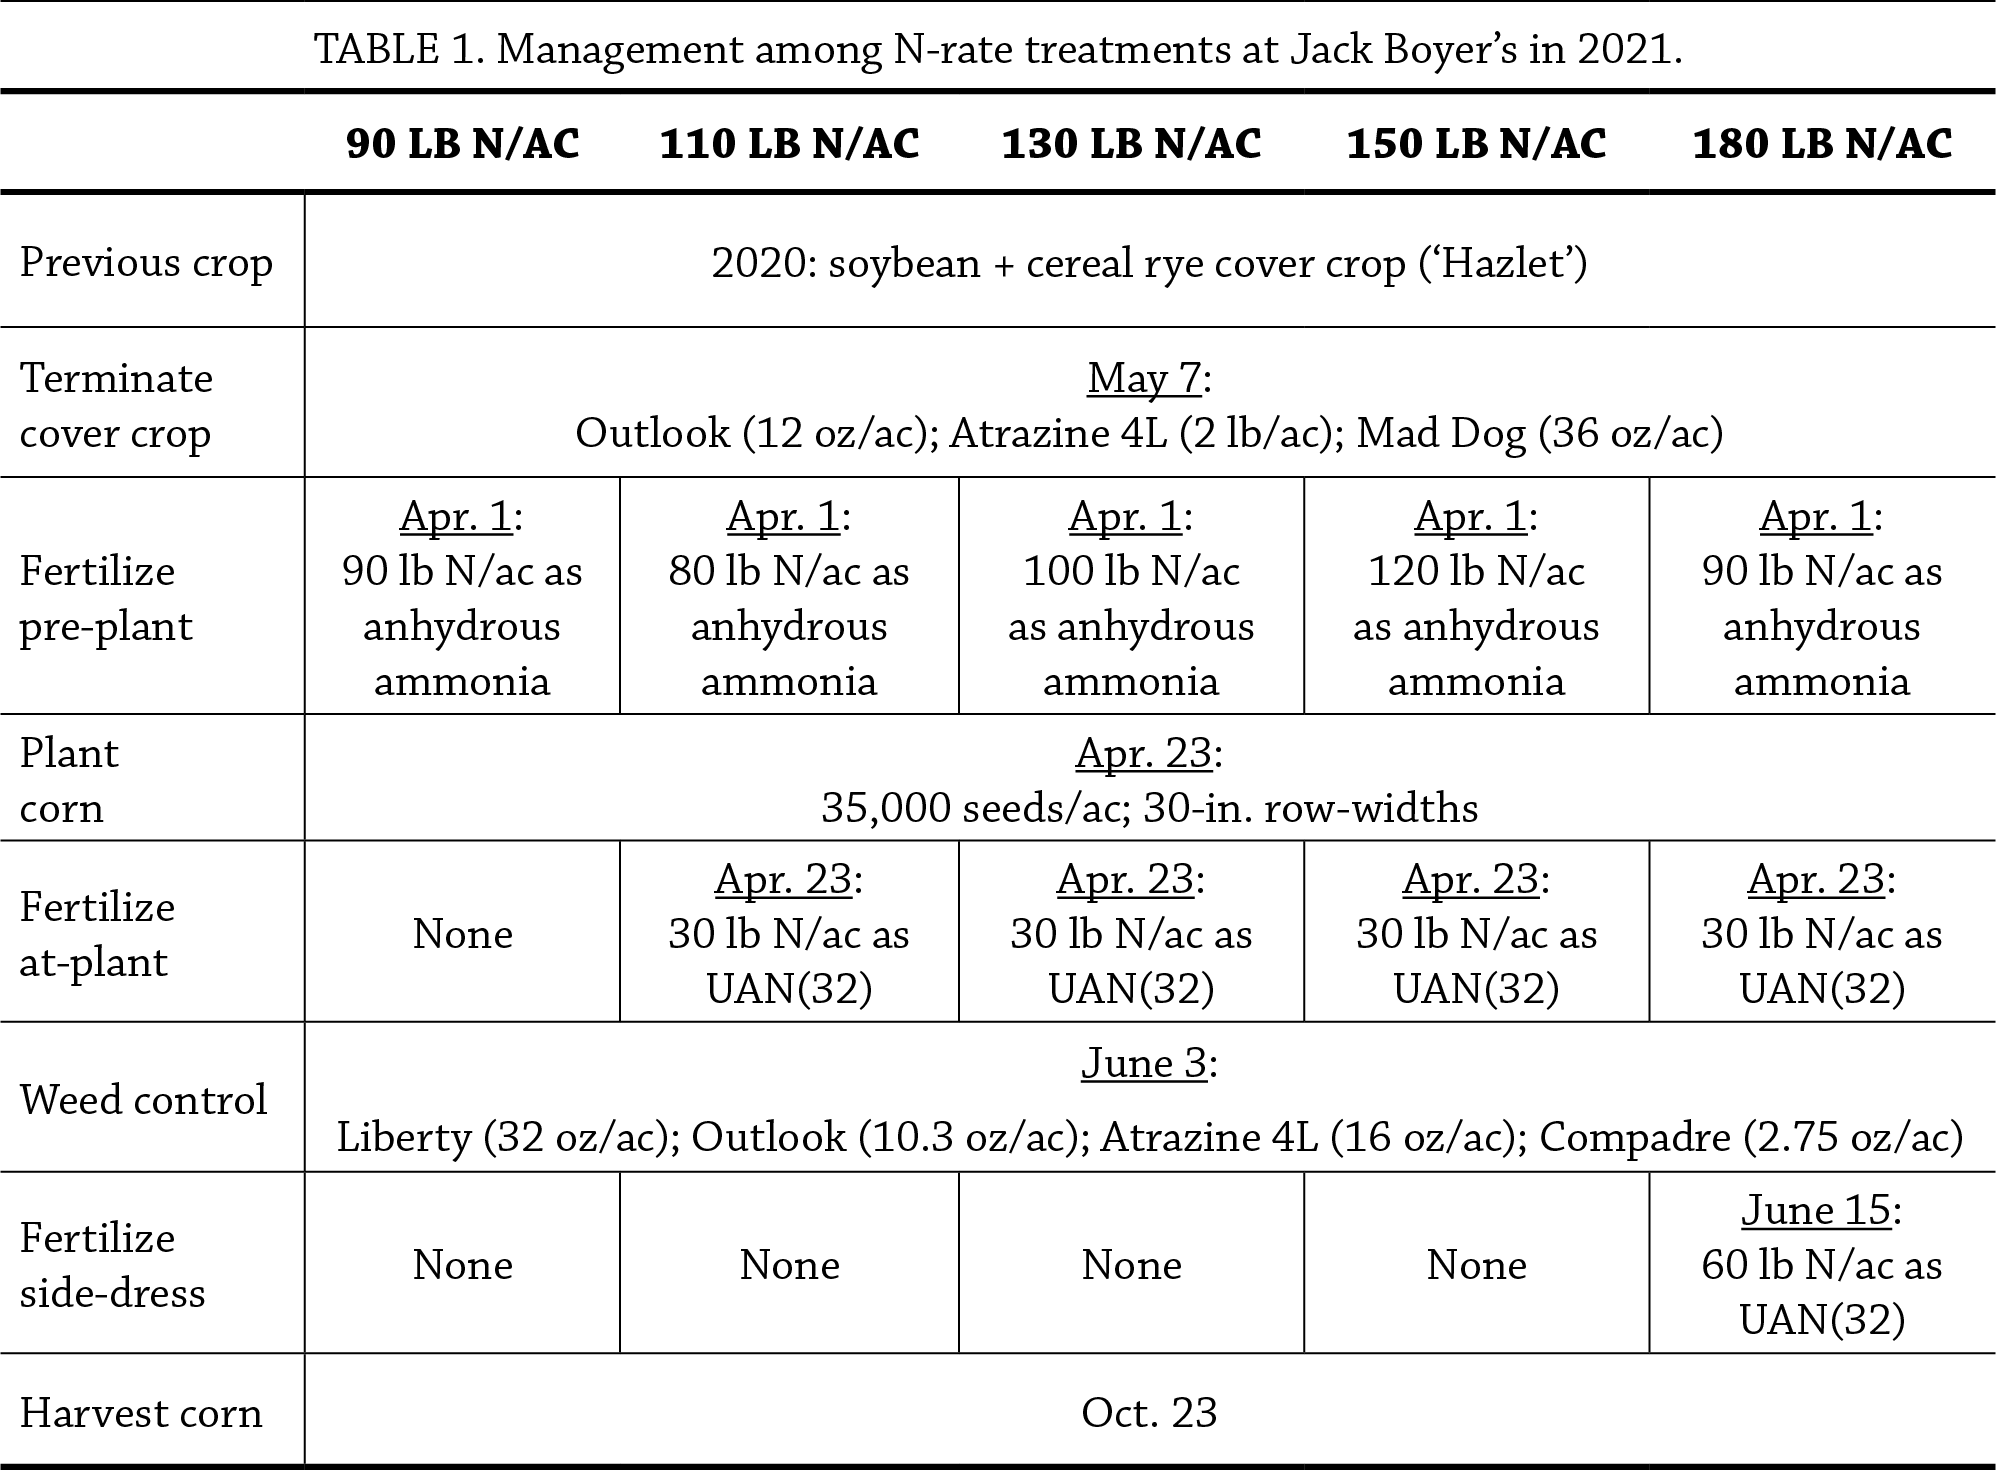
To test the effect of N rate, Boyer arranged treatments in neighboring strips measuring 30 ft wide by 2,100 ft long and replicated all treatments at least four times (Figure A1). The 130 lb N/ac rate was actually replicated eight times (twice as many strips as all other N rates). He established treatment strips on April 1, 2021, by injecting anhydrous ammonia and all management operations can be found in Table 1.
Measurements
Staff from the Iowa Soybean Association collected cornstalk samples from the 90, 110, 130 and 150 lb N/ac strips only for end-of-season nitrate assay on Sept. 23, 2021. On Oct. 23, Boyer harvested corn from the center of all strips and recorded yields and percent moisture in each strip. Yields were adjusted to standard moisture (15.5%).
Data analysis
To evaluate the effect of N fertilizer rate on corn yield we plotted both linear and quadratic curves and chose the curve that best fit the response of corn yield to N rate. To evaluate the effect of N fertilizer rate cornstalk nitrate, we calculated the treatment averages for each measurement then used Tukey’s tests to compute least significant differences (LSD) at the 95% confidence level. The difference in average yields of two treatments is compared with the LSD. Differences greater than or equal to the LSD indicate the presence of a statistically significant treatment effect, meaning one treatment outperformed the other and the cooperator can expect the same result to occur 95 out of 100 times under the same conditions. A difference that is less than the LSD indicates the difference is not statistically significant and the treatment had no effect.
Results and Discussion
Corn yield
Corn yield increased with each incremental increase in N rate (Figure 1). This was especially so between the 90 lb N/ac and 130 lb N/ac rates; beyond 130 lb N/ac, yield continued to increase but at a lesser rate and this is illustrated by the quadratic shape of the response curve in Figure 1. Average yields were 222.4, 229.3, 237.8, 241.2 and 245.1 bu/ac, respectively, from the lowest (90 lb N/ac) to highest (180 lb N/ac) N rate. Yields at all N rates exceeded the five-year Grundy County average (207 bu/ac).[3]
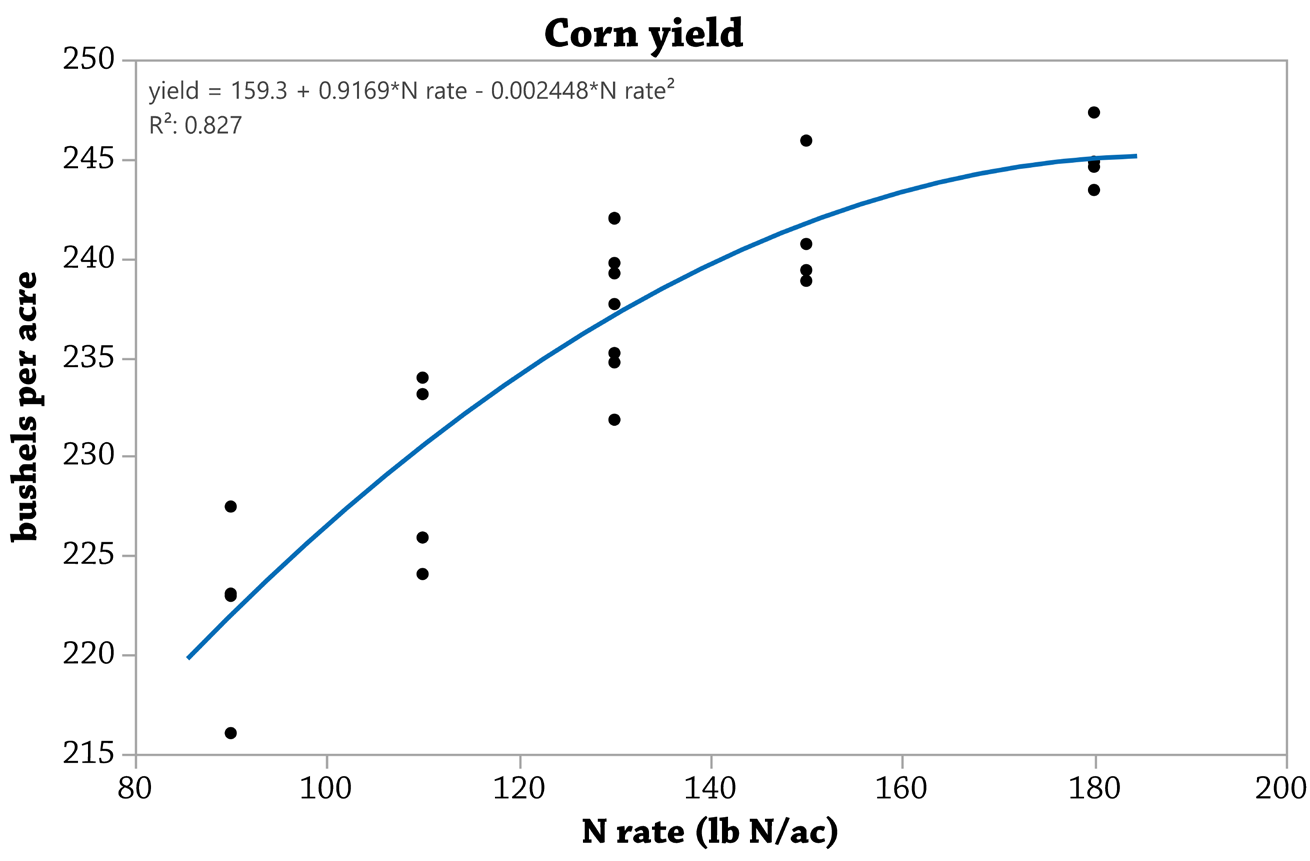
FIGURE 1. Corn yield response to N fertilizer rate at Jack Boyer’s in 2021. Points represent yields of individual strips receiving the different N rates. The curve was fit to the average yield at each N rate. The equation describes the shape of the curve, in this case a quadratic shape best fit the response of corn yield to N rate.
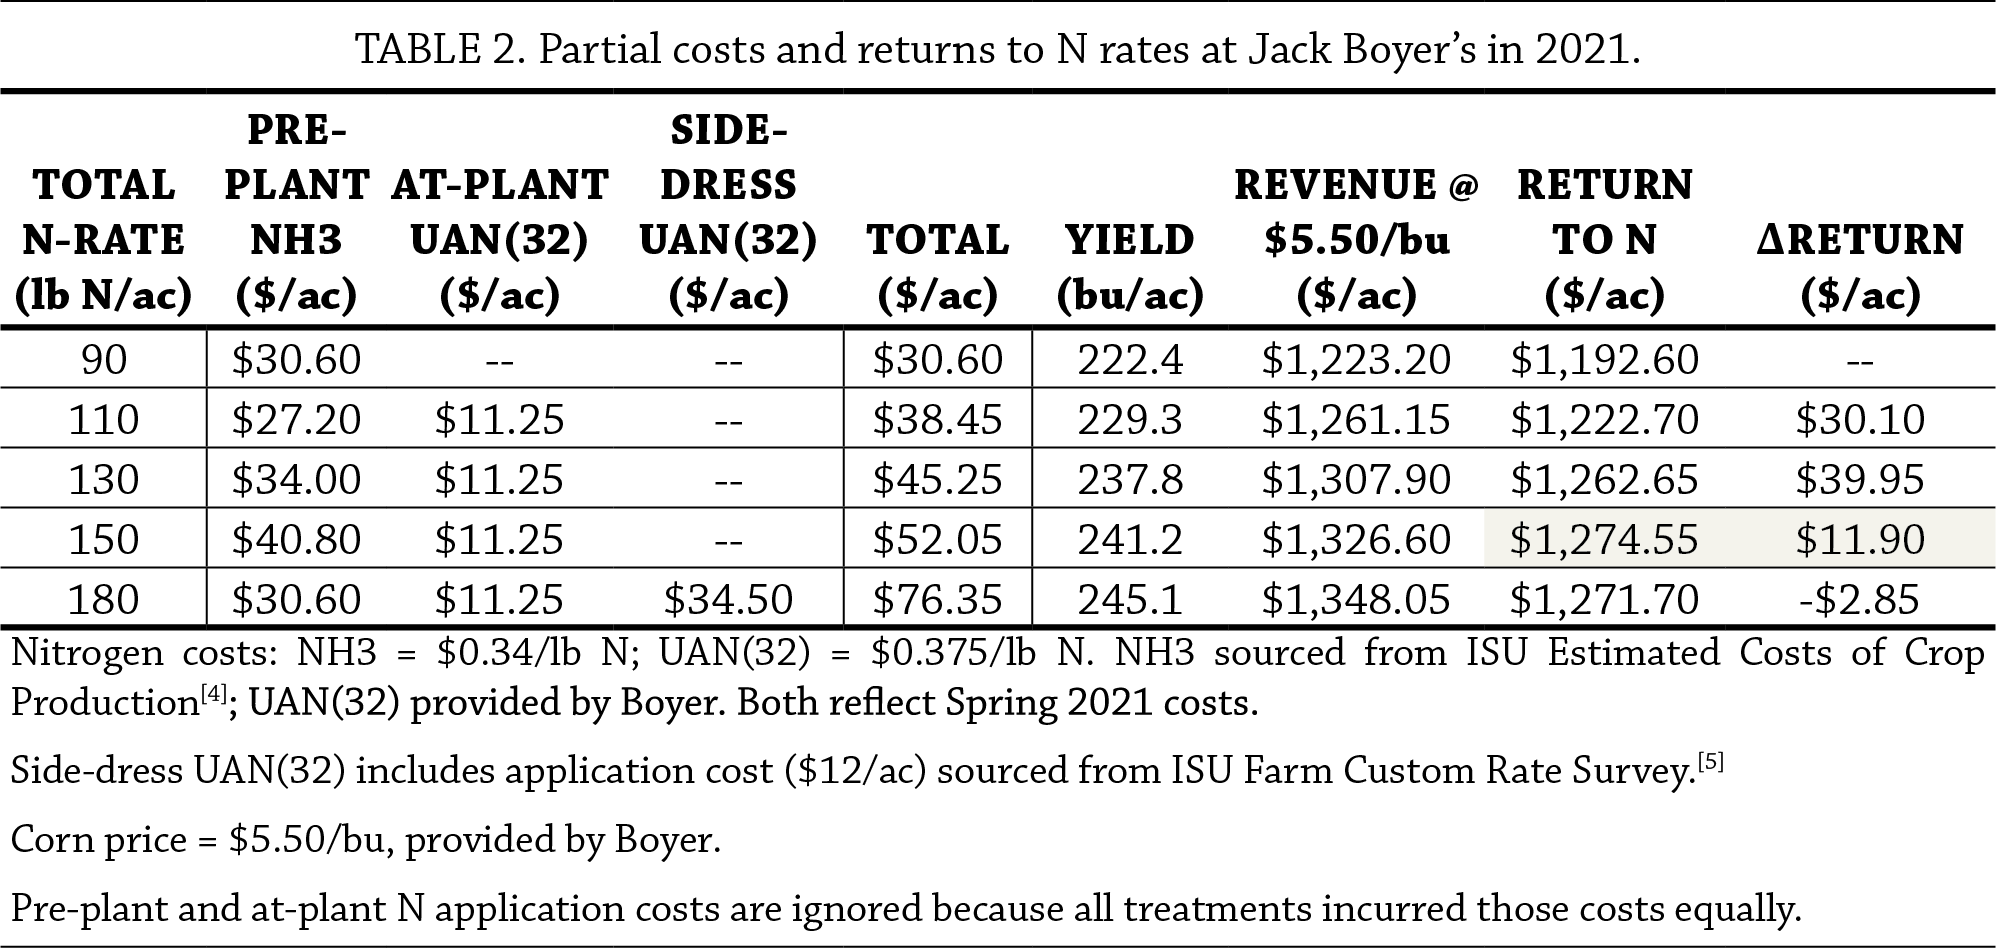
Maximum returns to applied N were achieved at the 150 lb N/ac rate (Table 2). Beyond this rate, returns diminished. In other words, though yield increased when increasing the N rate from 150 to 180 lb N/ac, returns to those additional 30 lb N/ac shrank.
Cornstalk nitrate test
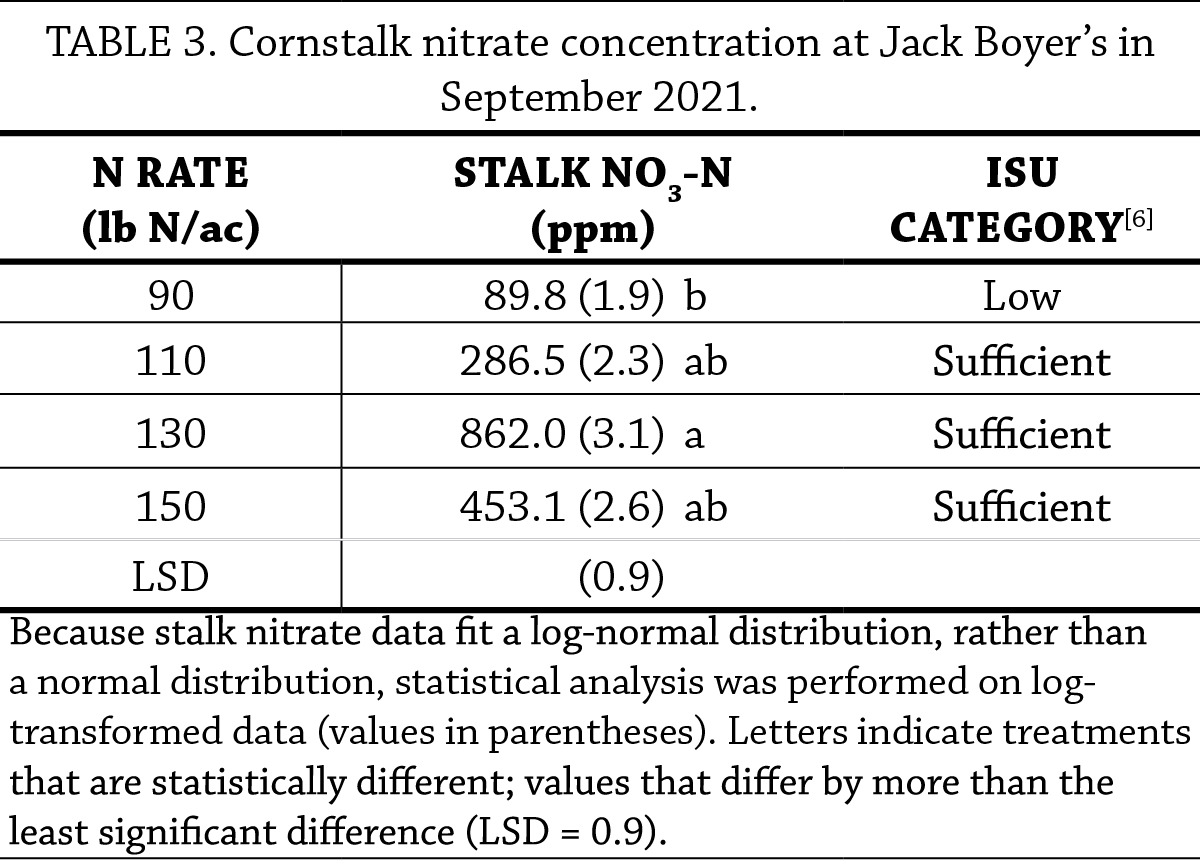
Cornstalk nitrate tested consistently lowest from the 90 lb N/ac rate (Table 3). Higher tests were observed from the higher N rates, but they were also much more variable, which made statistical means separations difficult. Average cornstalk nitrate tests from the 110, 130 and 150 lb N/ac rates fell in the “sufficient” category (250–2,000 ppm); the average test from the 90 lb N/ac rate fell in the “low” category (<250 ppm), according to ISU Extension and Outreach.[6]
Conclusions and Next Steps
For three years in a row, Boyer has been able to reap similar corn yields, increased net revenue or both from N fertilizer rates lower than his once-typical rate of 180 lb N/ac. In previous years, these improvements came with the 130 lb N/ac rate; in the present trial, 150 lb N/ac. “Running the trials in consecutive years continues to show that reducing commercial N is possible,” Boyer said about his results. Still uncertain by how much he can consistently reduce N fertilizer applications to fields he has dedicated to soil health practices like cover crops, Boyer will continue to trial rates. In the face of rising fertilizer costs, trialing N rates is one way to investigate economic advantages. These advantages may be more likely to manifest in fields with a history of long-term soil health practices.
Appendix – Trial Design and Weather Conditions
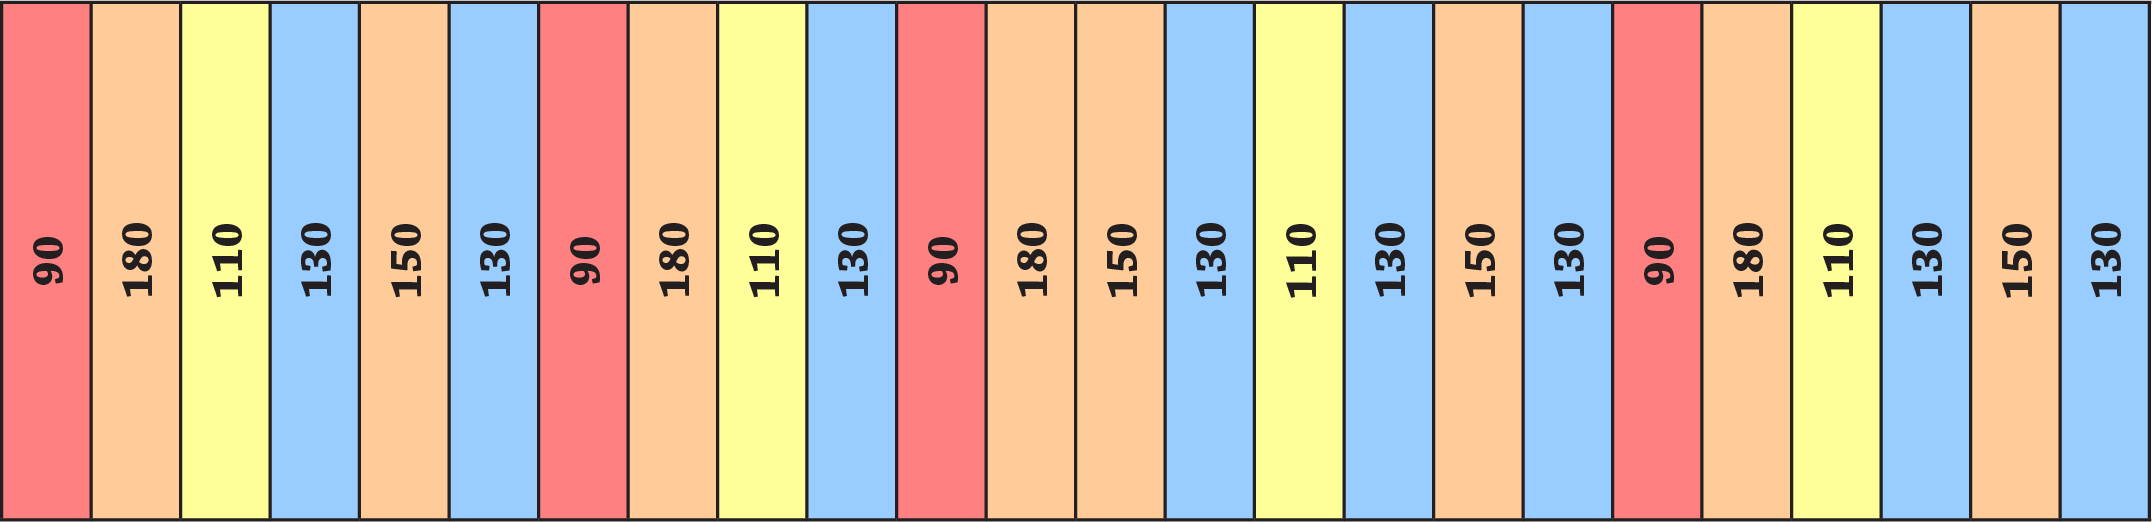
FIGURE A1. Jack Boyer’s experimental design consisted of at least four replications of each N rate (lb N/ac). This design allowed for statistical analysis of the data.
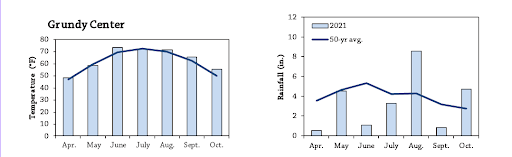
FIGURE A2. Mean monthly temperature and rainfall and the long-term averages during the trial period at Grundy Center, the nearest weather station to Boyer’s farm.[7] Click to enlarge.
References
- Gailans, S. and J. Boyer. 2019. Does Repeated Use of a Cereal Rye Cover Crop Reduce the Need for N Fertilizer for Corn? Practical Farmers of Iowa Cooperators’ Program. https://practicalfarmers.org/research/does-repeated-use-of-a-cereal-rye-cover-crop-reduce-the-need-for-n-fertilizer-for-corn/ (accessed December 2021).
- Nelson, H. and J. Boyer. 2020. Reduced N Rate to Corn After Repeated Use of Cover Crops.
- US Department of Agriculture-National Agricultural Statistics Service. Quick stats. USDA-National Agricultural Statistics Service. https://quickstats.nass.usda.gov/ (accessed November 2021).
- Plastina, A. 2021. Estimated costs of crop production in Iowa – 2021. Iowa State University Extension and Outreach. https://www.extension.iastate.edu/agdm/crops/html/a1-20.html (accessed December 2021).
- Plastina, A. 2021. 2021 Iowa Farm Custom Rate Survey. Iowa State University Extension and Outreach. https://www.extension.iastate.edu/agdm/crops/pdf/a3-10.pdf (accessed December 2021).
- Sawyer, J. and A. Mallarino. 2018. Use of the End-of-Season Corn Stalk Nitrate Test in Iowa Corn Production. Iowa State University Extension and Outreach. https://store.extension.iastate.edu/product/Use-of-the-End-of-Season-Corn-Stalk-Nitrate-Test-in-Iowa-Corn-Production (accessed November 2021).
- Iowa Environmental Mesonet. 2021. Climodat Reports. Iowa State University. http://mesonet.agron.iastate.edu/climodat/ (accessed December 2021).