

Economic and Soil Health Impact of Grazing Cover Crops in Cow-Calf Operations
This research was funded by the Iowa Department of Agriculture and Land Stewardship – Water Quality Initiative.
In a Nutshell:
- The practice of cover crop grazing provides economic returns, and farmers wonder if benefits to soil health follow suit. Economic returns are realized within a year’s time, while soil health impacts seemingly are slower to manifest.
- Four cooperators, each of whom are integrated cattle-crop farmers, grazed cover crops in the fall, winter and/or spring. In order to determine the economic and soil health impact of grazing cover crops, the cooperators kept cover crop and grazing records and had their soil sampled in 2019, 2020 and 2021.
Key Findings:
- Each cooperator profited from grazing cover crops within the year of planting. Profits varied due to cover crop and grazing management but averaged $73.52/ac across the four sites.
- Soil samples from 2019 through 2021 showed greater soil organic matter when comparing cover crops alone to no cover crop. We detected no consistent trends, however, in soil health indicators from grazing cover crops among farms.
- Grazing cover crops is becoming standard practice for cow-calf producers due to the short-term economic benefits the practice provides. Farmers are able to save thousands of dollars in hay expenses each year.
Background
Evidence has been mounting around the profits that can be achieved when livestock graze cover crops. [1,2,3] It is known that grazing cover crops can provide benefits to soil health, but these are typically realized in the longer term [1] and require proper grazing management. This report describes the economic and soil health impacts of grazing cover crops from four cooperating farms in western Iowa from 2019-2021. The project, funded by the Iowa Department of Agriculture and Land Stewardship (IDALS) began in 2015 strictly to quantify economic impacts from grazing cover crops.[2] In 2019, soil health sampling was added to data collection.
Four farmers profited an average of $73.52/acre when grazing cereal rye cover crops between their corn and soybean crops.
Methods
Design
In summer and fall of 2018, 2019 and 2020 farmers seeded cover crops with the intention of grazing the forage produced. In order to determine the effects on economics and soil health of cover crop and grazing management, each cooperator established three treatment fields:
- No cover crops with no grazing (control)
- Cover crops with no grazing (cover crop)
- Grazed cover crops (cover crop and graze)
All farms were in corn-soybean rotations, and each cover crop field was planted with cereal rye. In 2019, Frederick seeded triticale with cereal rye.
Grazing economics
Each cooperator recorded cover crop expenses and grazing data in their grazed cover crops field, which were used to estimate the forage value of cover crops on each farm using ISU’s Ag Decision Maker Economics of Cover Crops tool.[4] This tool takes into account revenue and costs associated with cover crop grazing. Revenue includes the value of feed replaced by grazing, cost-share payments received, crop insurance discounts and reduced labor due to grazing instead of feeding stored feed. Expenses include costs for establishing cover crops, additional herbicide and labor needed for cover crop termination, additional labor required, fence and water infrastructure.
The value of feed replaced by grazing assumes cattle would have been fed hay valued at $150/ton if cover crops were not available to graze. The tool takes into account number of cattle grazed, average weight of livestock, number of grazing days and cooperator estimates of dietary needs provided by supplemental feed and crop residue. The tool assumes cattle consume 4% of their bodyweight in forage dry matter (DM) each day (2.5 to 3.0% intake, 0.5% trampling loss and 0.5-1.0% buffer).[5] All formulas are nested within the tool.
Net profit is reported on a per acre and a per animal unit (AU) basis. An animal unit is equal to 1,000 lb of animal. Net profit was calculated two ways – 1) including cost-share and crop insurance discounts and 2) without including cost-share or crop insurance discounts.
This economic analysis did not take into account effects on cash crop yield, soil retention value, nutrient retention value, soil health value, nutritional value of forage or animal weight gain.
Soil health
Soil samples were collected in spring 2019, 2020 and 2021 and in fall 2019 and 2020 in all three treatment fields to a depth of 6 in. Soil sample locations were marked by GPS and taken within the same soil type at each farm.
Samples were sent to AgSource Laboratories (Ellsworth, IA) and analyzed for microbial respiration by determining the burst of CO2-C following rewetting of dried soil using an infrared gas analyzer. Other soil indicators measured included water soluble carbon (active C) and organic matter (OM).
Soils data were analyzed by calculating response ratios that compared control treatments to the cover crop and grazed cover crop treatments. Response ratios for each soil health metric were calculated as the natural log of the cover crop or grazed cover crop treatment divided by the control treatment. For example:
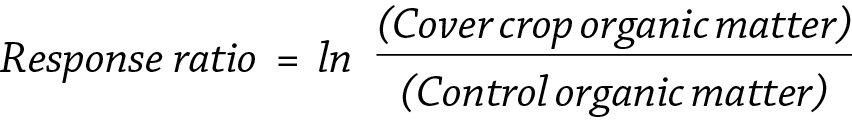
For ease of interpretation, we back transformed natural log results to percent change. Results were considered statistically significant if the 95% confidence intervals did not cross zero.
Results and Discussion
Economic Impact

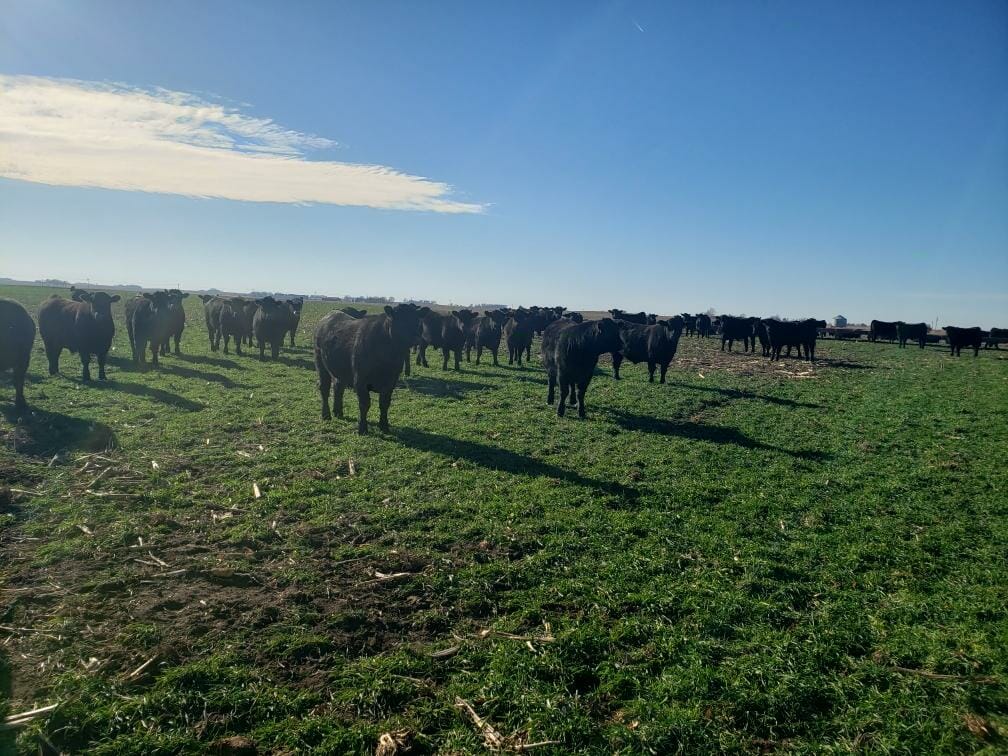
Cereal rye growing at Wesley Degner’s farm near Lytton, in November of 2020, prior to grazing.
Results from each of the four farms are presented in Table 1. On average, cover crop establishment cost cooperators $27.97/ac. Net profits from grazing averaged $73.52/ac. Without the assistance of cost-share and crop insurance discounts, net profits averaged $43.52/ac. Regardless of financial assistance, each cooperator scored positive profits from grazing cover crops within the same year of planting cover crops.
On an AU basis, cooperators profited, on average, $123.70/AU. For a 1,200 lb cow, this equates to $148.44/head. Without cost-share and crop insurance discounts, cooperators profited $71.81/AU.
Another way to summarize the forage value of cover crops is to calculate feed costs saved per AU per day when cattle graze cover crops. On average, cooperators saved $2.71/AU/day in feed expenses. This is an important finding considering winter feed costs represent the single largest cost in cattle operations.[6] Our results show that grazing cover crops can reduce winter feed costs.
Existing fencing and water infrastructure was used, so no costs were incurred nor accounted for in this analysis. Net profits ranged from $36.83 to $123.77/ac. This range is attributed to how well cover crop established at each farm, which in turn affected the amount of forage produced. Other factors contributing to the range in profits include varying grazing period lengths, number of cattle and particular costs of some practices at each farm.
Important to note, Kennedy grazed cows on cereal rye for about forty days in the spring of 2019 and 2020, then removed cows to let the rye grow back and was able to harvest an average of 47 tons of ryelage in late May of each year, after an application of fertilizer. This revenue was not accounted for in the analysis, therefore any resulting profit would be in addition to his returns detailed in Table 1.

Soil health – microbial respiration
On average, cover crops alone resulted in no significant change in soil microbial respiration compared to the no cover crop control. This is depicted in Figure 1, in which all of the confidence intervals (error bars) for the comparisons at each farm cross zero. In other words, the percent change in microbial respiration was not significantly different than zero.
Grazing cover crops at Frederick’s resulted in a significant improvement in soil microbial respiration compared to no cover crop (Figure 2). Both Degner and Kennedy, however, saw significant reductions in soil microbial respiration from the grazed cover crop while Smith saw no change. When considering all four sites together, the percent change in microbial respiration from grazing cover crops was not significantly different than zero.
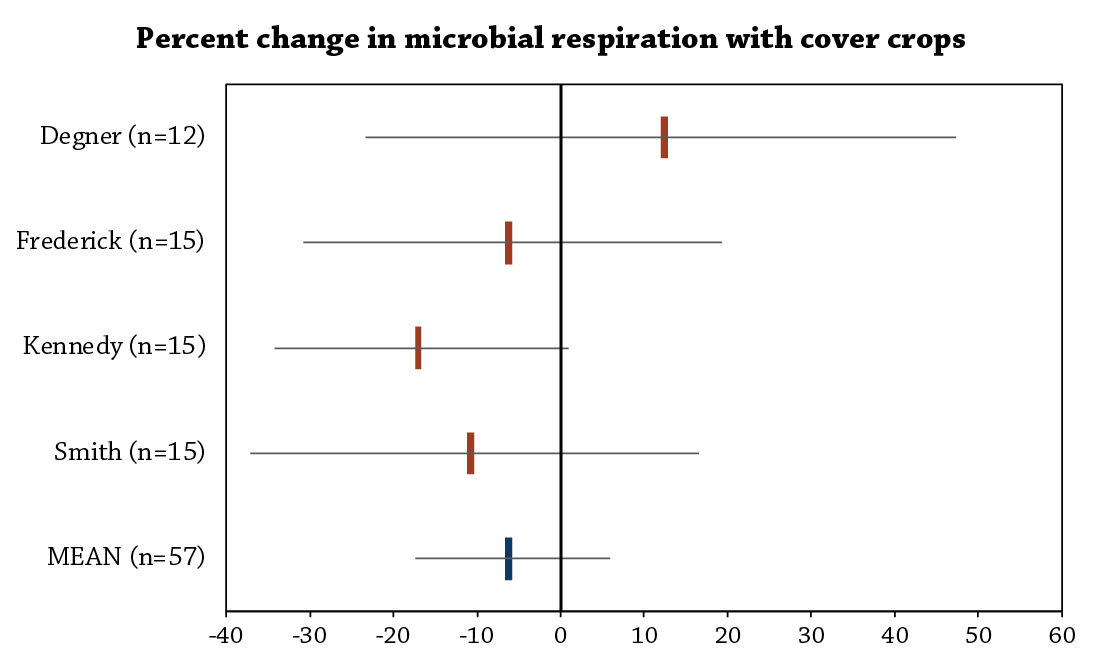
FIGURE 1. Percent change in soil microbial respiration (CO2-C burst from soils) with cover crops compared to the no cover crop control for each site and the overall mean (n = number of paired comparisons). We considered percent change significant if confidence intervals did not cross zero. Wide confidence intervals (error bars) represent more variability.
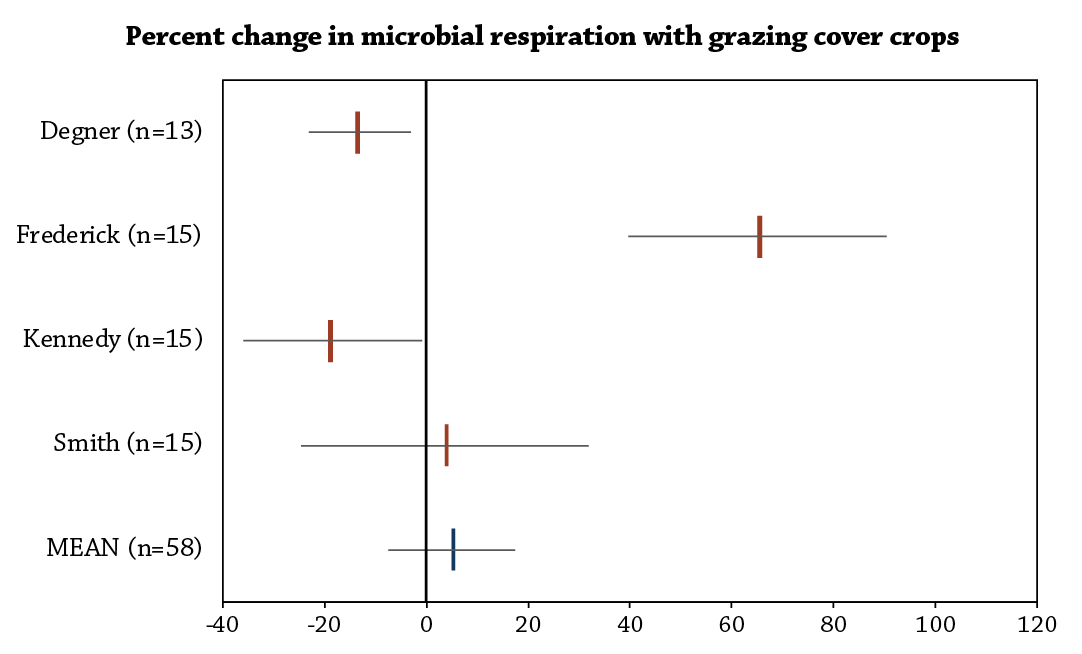
FIGURE 2. Percent change in soil microbial respiration (CO2-C burst from soils) with grazed cover crops compared to the no cover crop control for each site and the overall mean (n = number of paired comparisons). We considered percent change significant if confidence intervals did not cross zero. Wide confidence intervals (error bars) represent more variability.
Soil health- active carbon
Similar to microbial respiration, we saw no effect on average of cover crops or grazed cover crops on active carbon compared to the no cover crop control (Figures 3 and 4). The lone exception occurred at Frederick’s where he saw the grazed cover crop significantly improve active carbon compared to no cover crop (Figure 4; Frederick’s confidence interval does not cross zero).
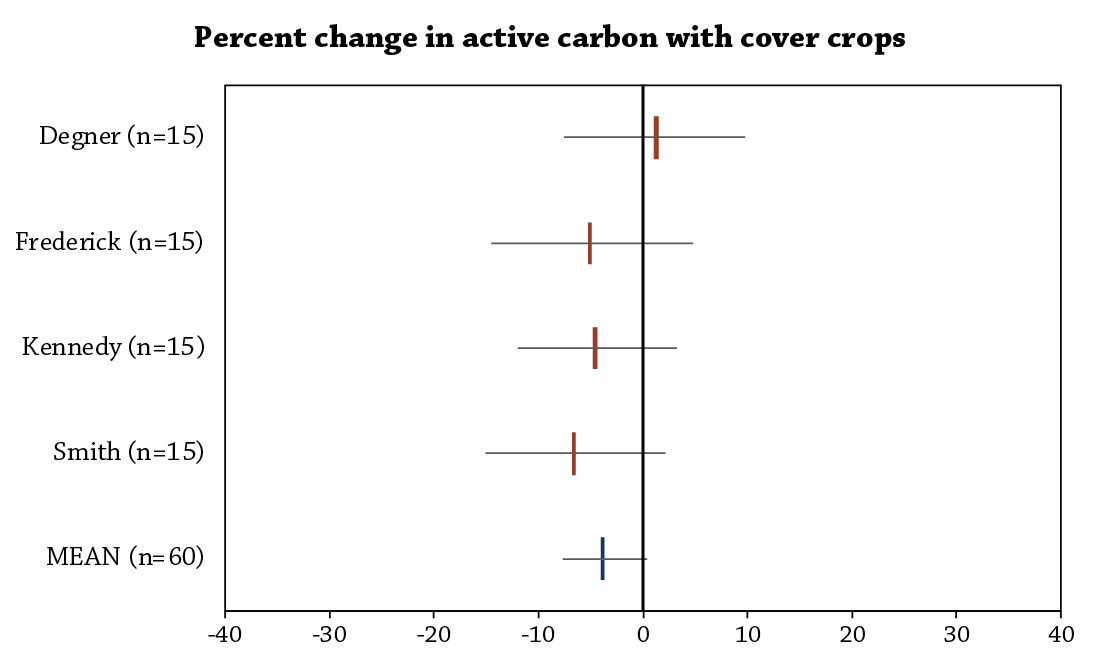
FIGURE 3. Percent change in soil active carbon (water soluble carbon) with cover crops compared to the no cover crop control for each site and the overall mean (n = number of paired comparisons). We considered percent change significant if confidence intervals did not cross zero. Wide confidence intervals (error bars) represent more variability.
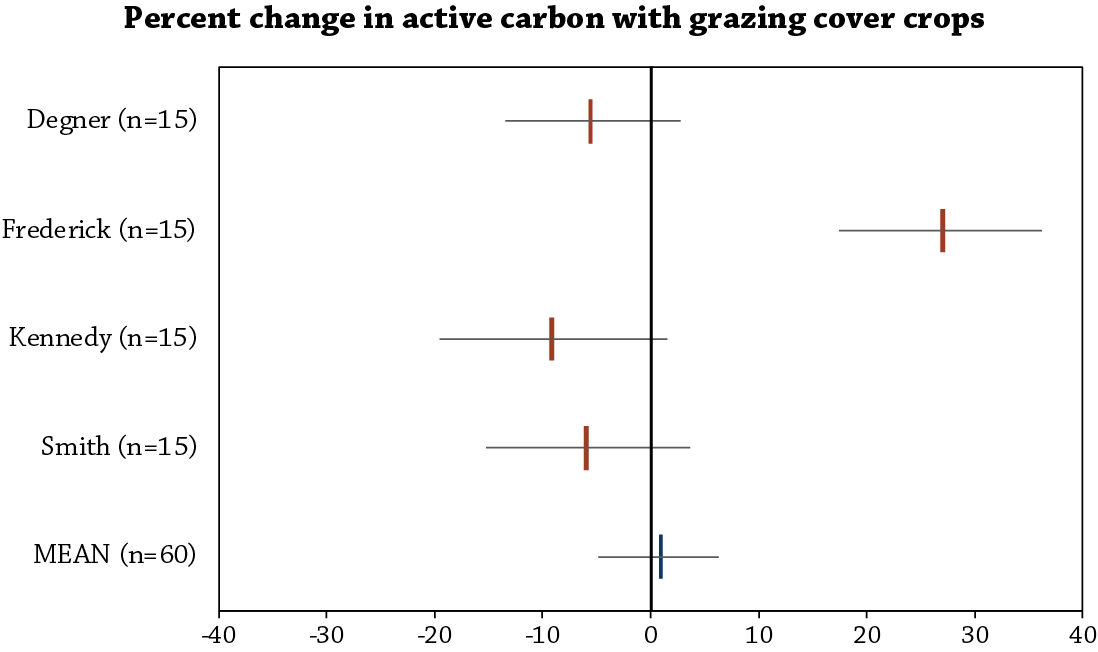
FIGURE 4. Percent change in soil active carbon (water soluble carbon) with grazed cover crops compared to the no cover crop control for each site and the overall mean (n = number of paired comparisons). We considered percent change significant if confidence intervals did not cross zero. Wide confidence intervals (error bars) represent more variability.
Soil health – organic matter
Across sites and sampling dates, soil organic matter ranged from 2.1% to 5.1%. Compared to the no cover crop control, organic matter was statistically greater with a cover crop by 7% on average across all sites (Figure 5; overall mean confidence interval does not cross zero). Grazing cover crops, however, resulted in no average statistical difference compared to no cover crop (Figure 6). An exception again occurred at Frederick’s. As with soil microbial respiration and active carbon, grazing cover crops at Frederick’s resulted in statistically positive percent change in soil organic matter.
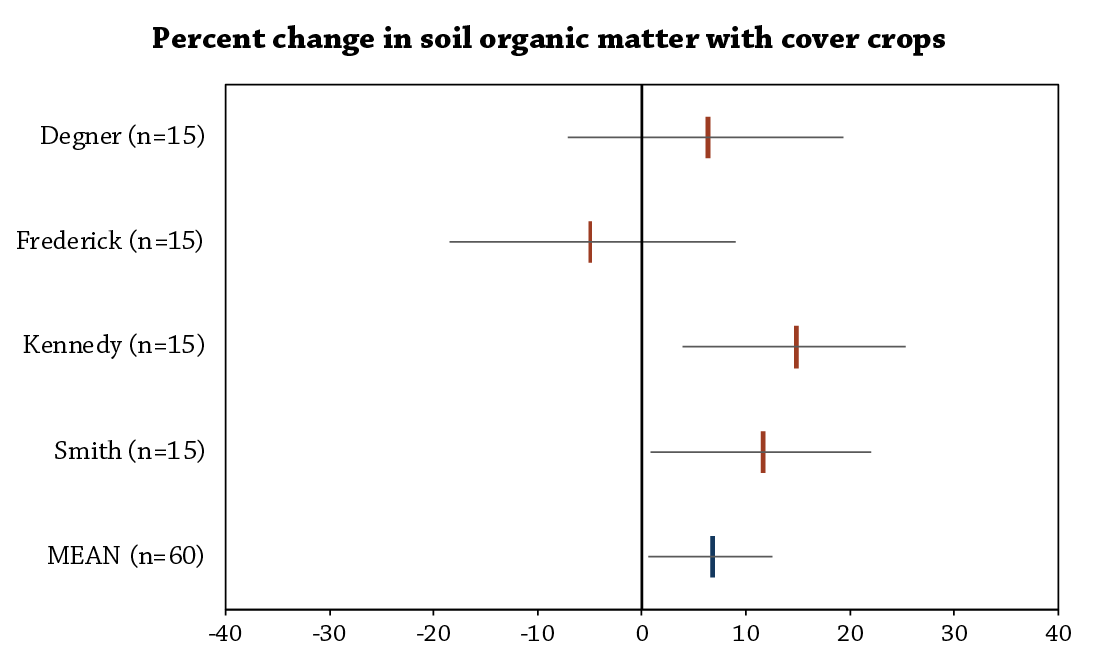
FIGURE 5. Percent change in soil organic matter with cover crops compared to the no cover crop control for each site and the overall mean (n = number of paired comparisons). We considered percent change significant if confidence intervals did not cross zero. Wide confidence intervals (error bars) represent more variability.
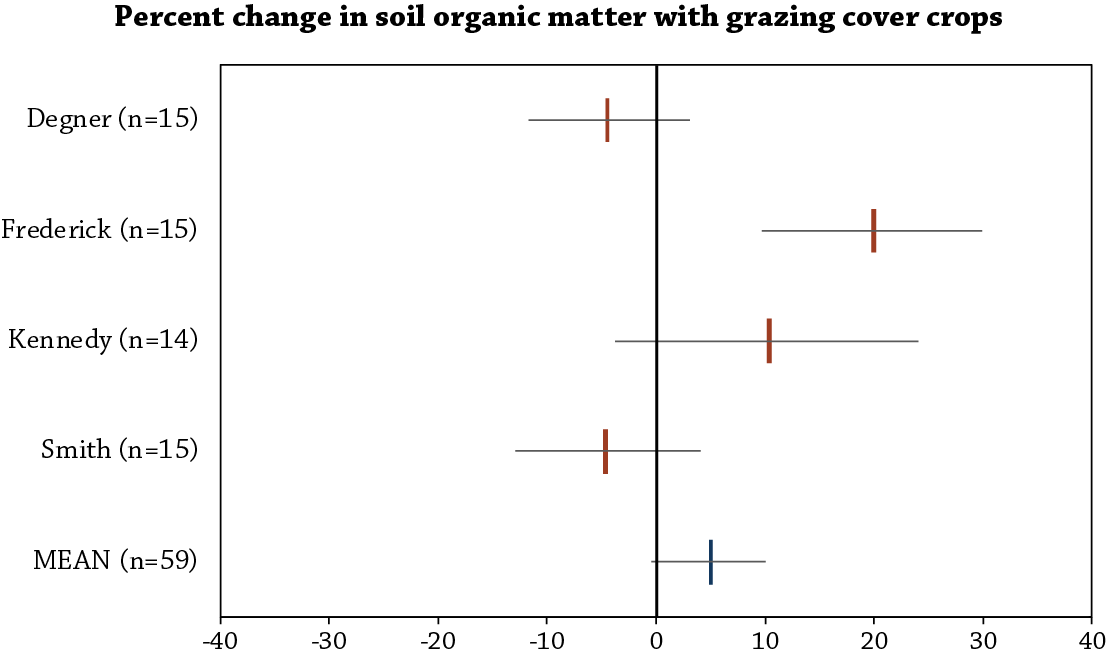
FIGURE 6. Percent change in soil organic matter with grazed cover crops compared to the no cover crop control for each site and the overall mean (n = number of paired comparisons). We considered percent change significant if confidence intervals did not cross zero. Wide confidence intervals (error bars) represent more variability.
Conclusions and Next Steps
The economic results from this project continue to show that grazing cover crops provides short-term economic benefits and pay off in one year. Kennedy found he did not have to feed any hay over a 37-day period while his cattle grazed a rye cover crop from April 14 to May 21, 2019 and stated, “If a farmer can incorporate livestock into cover crops, it’s hard to deny it works.”
Soil health results indicate the soil health impact of grazing cover crops may take more time to realize and research efforts may be better spent focusing on economics, ecological benefits and field fitness. Changes in soil health are expected to be slow and may take years to show measurable differences; although academic research does provide evidence for livestock integration in cropping systems stimulating soil biology.[7] In the short term, our economic analysis shows that grazing cover crops is a profitable practice.
Degner, who was new to cover crops at the start of this project, now has six years of experience under his belt. “We’re planning to continue grazing cows on cereal rye that we aerial seed around the Labor Day time frame each year. It makes our life easier in the winter, we have less feed costs and grazing gives the cows exercise before spring calving.”
Funding Acknowledgement
![]()

References
- Myers, R., Weber, A., S. Tellatin. 2019. Cover Crop Economics. SARE Technical Bulletin. https://www.sare.org/Learning-Center/Bulletins/Cover-Crop-Economics (accessed July 2021).
- Filbert, M. 2017. Economic Impact of Grazing Cover Crops in Cow-Calf Operations. Practical Farmers of Iowa Cooperators’ Program. https://practicalfarmers.org/research/economic-impact-of-grazing-cover-crops-in-cow-calf-operations/ (accessed July 2021).
- Filbert, M. 2020. Economic and Soil Health Impact of Grazing Cover Crops, 2018-2019. Practical Farmers of Iowa Cooperators’ Program. https://practicalfarmers.org/research/economic-and-soil-health-impact-of-grazing-cover-crops-2018-2019/ (accessed July 2021).
- Edwards, E., Plastina, A., and M. Filbert. 2018. Economics of Cover Crops. Iowa State University Ag Decision Maker. https://www.extension.iastate.edu/agdm/crops/html/a1-91.html (accessed July 2021).
- NRCS. 2009. Balancing your Animals with your Forage. USDA. 2–5. https://www.nrcs.usda.gov/Internet/FSE_DOCUMENTS/stelprdb1097070.pdf (accessed July 2021).
- Boetel, B. 2017. In The Cattle Markets: Cost of Wintering Cattle. Drovers. https://www.drovers.com/article/cattle-markets-cost-wintering-cattle (accessed July 2021).
- Franzluebbers, A.J. and J.A. Stuedemann. 2015. Does grazing of cover crops impact biologically active soil carbon and nitrogen fractions under inversion or no tillage management? Journal of Soil and Water Conservation. 70(6):365–373. https://www.jswconline.org/content/70/6/365 (accessed August 2021).